
RESEARCH REPORT A life course approach to determining the prevalence and impact of sexual violence in Australia: Findings from the Australian Longitudinal Study on Women’s Health
Research Report
ISSUE 14 | AUGUST 2022
ANROWS acknowledgement
This material was produced with funding from the Australian Government Department of Social Services. Australia’s National Research Organisation for Women’s Safety (ANROWS) gratefully acknowledges the financial and other support it has received from the government, without which this work would not have been possible. The findings and views reported in this paper are those of the authors and cannot be attributed to the Australian Government Department of Social Services.
Acknowledgement of Country
ANROWS acknowledges the Traditional Owners of the land across Australia on which we live and work. We pay our respects to Aboriginal and Torres Strait Islander Elders past, present and emerging. We value Aboriginal and Torres Strait Islander histories, cultures and knowledge. We are committed to standing and working with First Nations peoples, honouring the truths set out in the Warawarni-gu Guma Statement.
Peer review process
The quality of ANROWS publications is ensured through a rigorous peer review process that is consistent with the principles of the Committee on Publication Ethics (COPE) Ethical Guidelines for Peer Review. This report has been assessed by at least two peer reviewers with relevant academic expertise.
© ANROWS 2022

With the exception of the ANROWS branding, content provided by third parties, and any material protected by a trademark, all material presented in this publication is licensed under a Creative Commons Attribution-NonCommercial 3.0 Australia (CC BY-NC 3.0 AU) licence.
The full licence terms are available at creativecommons.org/licenses/by-nc/3.0/au/legalcode
Published by
Australia’s National Research Organisation for Women’s Safety Limited (ANROWS)
PO Box Q389, Queen Victoria Building, NSW 1230 | www.anrows.org.au | Phone +61 2 8374 4000
ABN 67 162 349 171
ISBN: 978-1-922645-45-6 (paperback)
ISBN: 978-1-922645-46-3 (PDF)
Please note that there is the potential for minor revisions of this report.
Please check the online version at www.anrows.org.au for any amendment.

Natalie Townsend
Research Program Manager, Centre for Women’s Health Research and Australian Longitudinal Study on Women’s Health, University of Newcastle
Professor Deborah Loxton
Director, Centre for Women’s Health Research and Australian Longitudinal Study on Women’s Health,
University of Newcastle
Nicholas Egan
Statistician, Centre for Women’s Health Research and Australian Longitudinal Study on Women’s Health,
University of Newcastle
Isabelle Barnes
Senior Research Officer, Centre for Women’s Health Research and Australian Longitudinal Study on Women’s Health,
University of Newcastle
Emma Byrnes
Research Officer, Centre for Women’s Health Research and Australian Longitudinal Study on Women’s Health,
University of Newcastle
Peta Forder
Senior Statistician, Centre for Women’s Health Research and Australian Longitudinal Study on Women’s Health,
University of Newcastle
This report addresses work covered in the ANROWS research project 4AP.4 “A life course approach to determining the prevalence and impact of sexual violence in Australia: The Australian Longitudinal Study on Women’s Health”. Please consult the ANROWS website for more information on this project.
ANROWS research contributes to the six National Outcomes of the National Plan to Reduce Violence against Women and their Children 2010–2022. This research addresses National Plan Outcome 1 – Communities are safe and free from violence and Outcome 4 – Services meet the needs of women and their children experiencing violence.
Suggested citation:
Townsend, N., Loxton, D., Egan, N., Barnes, I., Byrnes, E., & Forder, P. (2022). A life course approach to determining the prevalence and impact of sexual violence in Australia: Findings from the Australian Longitudinal Study on Women’s Health (Research report, 14/2022). ANROWS.

University of Newcastle
University Drive
Callaghan NSW 2308
Author acknowledgement
The research on which this report is based was conducted as part of the Australian Longitudinal Study on Women’s Health by researchers from the University of Queensland and the University of Newcastle. We are grateful to the Australian Government Department of Health for funding and to the women who provided the data. The authors also acknowledge the Australian Government Department of Health for providing Medicare Benefits Schedule and Pharmaceutical Benefits Scheme data, and the Australian Institute of Health and Welfare (AIHW) as the integrating authority.
Note: the authors acknowledge that “family and domestic violence” is the preferred terminology of ANROWS. However, in this report, the term “domestic violence” has been used where violence pertained to violence between intimate partners. This reflects the measures used in collecting the data, which were focused on violence between intimate partners.
Acknowledgement of lived experiences of violence
ANROWS acknowledges the lives and experiences of the women and children affected by domestic, family and sexual violence who are represented in this report. We recognise the individual stories of courage, hope and resilience that form the basis of ANROWS research.
Caution: Some people may find parts of this content confronting or distressing. Recommended support services include 1800RESPECT (1800 737 732), Lifeline (13 11 14) and, for Aboriginal and Torres Strait Islander people, 13YARN (13 92 76
Executive summary
Background
The Australian Government Department of Social Services (2019, p. 60) defines sexual violence as
sexual actions without consent, which may include coercion, physical force, rape, sexual assault with implements, being forced to watch or engage in pornography, enforced prostitution or being made to have sex with other people.
While there is a growing body of international evidence on sexual violence, its prevalence and impact has not been extensively examined in the Australian context. The existing evidence base is largely limited to data sources that are likely to underestimate the prevalence of sexual violence or to apply only to discrete groups of women (e.g. clinical samples). Further, while international and national estimates of sexual violence prevalence are available, these rarely capture experiences and outcomes across the life span.
The Australian Longitudinal Study on Women’s Health (ALSWH) has collected sexual violence data since its inception in 1996 and offers an ideal opportunity to examine sexual violence over the life span. The ALSWH has captured a broad range of data on women’s health, which are crucial for understanding the economic, social, physical and mental health trajectories of women who have experienced sexual violence. This report was developed in consultation with ANROWS to address the limitations of the existing evidence by utilising ALSWH data.
Aims
The purpose of this report was to assess the prevalence of sexual violence over the life course and the impacts of experiencing sexual violence on health and wellbeing among Australian women using national, longitudinal data. The research had the following specific aims:
- Determine the prevalence of sexual violence across the life course, including sexual violence experienced in childhood and adulthood, perpetrated both within an intimate relationship and outside of such a relationship.
- Determine the role of sexual violence during childhood as a risk factor for experiences of multiple forms of violence later in life.
- Identify the impact of sexual violence on socio-economic factors over time, such as education, paid employment and financial stress.
- Determine the nature of associations between sexual violence experienced by women at different life stages and subsequent health behaviours.
- Assess the impact of sexual violence on women’s physical and mental health.
- Measure health service use in relation to sexual violence, including costs of selected health services and satisfaction with general practitioner services.
- Identify factors associated with the general health and wellbeing of women who have experienced sexual violence.
Method
The ALSWH is an ongoing, national cohort study that investigates factors influencing the health and wellbeing of Australian women. The study began in 1996 and now includes data from more than 57,000 women across four age cohorts (born in 1921 to 1926, 1946 to 1951, 1973 to 1978, and 1989 to 1995). ALSWH surveys collect data on women’s physical and mental health as well as demographics, health behaviours and attributes, lifestyle factors, use of health services and experiences of violence. ALSWH data are linked with national and state-based administrative health datasets such as the Medicare Benefits Schedule (MBS) and the Pharmaceutical Benefits Scheme (PBS), as well as hospital admission, perinatal and cancer registry datasets.
Key ALSWH variables analysed for this report in relation to sexual violence included measures of domestic and physical violence, socio-demographic factors, financial outcomes, health behaviours, mental health, physical health and social support. Data on healthcare costs and mental health consultations were sourced from MBS and PBS datasets linked to ALSWH participant data, to investigate the associations between health service use and sexual violence.
Results
Overall findings indicated that women experience sexual violence at a much higher prevalence than has been previously reported at the national level, especially among younger women. Sexual violence in childhood was found to be a risk factor for experiencing later violence. Experiencing sexual violence at any stage increased the risk of financial stress, adverse health behaviours (among women in their twenties and forties), and poor physical and mental health. Social support, mental health service use and physical activity were indicated as potentially beneficial to wellbeing among women who had experienced sexual violence. A summary of the main results is presented below and highlights are included in the accompanying infographic package.
Aim 1: Prevalence of sexual violence
The lifetime prevalence of experiencing sexual violence was:
- 51 per cent of women in their twenties
- 34 per cent of women in their forties
- 26 per cent of women aged 68 to 73.
The prevalence of sexual violence during childhood was 12 to 15 per cent of women, depending on the age cohort.
The lifetime prevalence of sexual violence in adulthood was 39 per cent of women in their twenties, 18 per cent of women in their forties and 12 per cent of women aged 68 to 73.
The differences in prevalence by age may reflect generational differences in understanding, personal feelings about disclosing sexual violence and the time since the violence occurred (Loxton, Townsend et al., 2017)
Women identifying as bisexual or as mainly or exclusively lesbian were more likely to report having experienced sexual violence in their lifetime than those who identified as mainly or exclusively heterosexual. For example, 76 per cent of women aged 24 to 30 identifying as bisexual, 55 per cent of those identifying as mainly or exclusively lesbian, and 48 per cent of women identifying as mainly or exclusively heterosexual reported having experienced sexual violence in their lifetime. This is in line with previous international research in this area (Black, 2011). However, the low number of women in the ALSWH cohorts who identify as bisexual limits the generalisability of our findings.
Women with disability or illness were more likely to report having experienced sexual violence in their lifetime than those without disability or illness (73% versus 51% for women aged 24 to 30; 55% versus 34% for women aged 40 to 45; 34% versus 26% for women aged 68 to 73). We have previously reported similar results in relation to domestic violence (Loxton, Townsend et al., 2018). The findings were also in line with those of the 2016 Personal Safety Survey, which estimated a higher prevalence of sexual violence after the age of 15 among women living with disability compared to those without disability (16% versus 9.6%; Australian Bureau of Statistics, 2017).
Aim 2: Sexual violence during childhood as a risk factor for further violence
Compared with women of the same age who did not report experiencing sexual violence in childhood:
- Women aged 24 to 30 in 2019 who had experienced childhood sexual violence were twice as likely to have experienced recent sexual violence, 59 per cent more likely to have experienced recent domestic violence and approximately 60 per cent more likely to have experienced recent physical violence.
- Women aged 40 to 45 in 2018 who had experienced childhood sexual violence were twice as likely to have experienced recent sexual violence, 33 per cent more likely to have experienced recent domestic violence and 63 per cent more likely to have experienced recent physical violence.
Aim 3: Lifetime sexual violence and economic factors
Compared with women of the same age who did not experience sexual violence in their lifetime:
- Women aged 24 to 30 in 2019 who had experienced sexual violence were less likely to have completed Year 12 and less likely to be in full-time employment.
- Women aged 40 to 45 in 2018 who had experienced sexual violence were less likely to have completed Year 12.
- Women aged 68 to 73 in 2019 to 2020 who had experienced sexual violence were more likely to have completed further study after Year 12 and more likely to have been in full-time employment.
Despite differences between cohorts regarding education and employment, sexual violence was consistently associated with high financial stress over time for all three cohorts (women were 30% to 45% more likely to experience high financial stress if they had experienced sexual violence).
Aim 4: Sexual violence and health behaviours
Experiencing sexual violence was associated with illicit drug use, high-risk alcohol consumption, current tobacco use, less physical activity and obesity among women in their twenties and forties.
Women aged 68 to 73 in 2019 to 2020 were slightly less likely to have had a mammogram or cervical cancer screening in the previous two years if they had experienced sexual violence in their lifetime. Conversely, women aged 24 to 30 in 2019 were slightly more likely to have had a cervical cancer screening in the previous two years if they had experienced sexual violence.
Aim 5: Sexual violence and health
Regardless of age or generation, women who had experienced sexual violence reported worse physical and mental health than women who had never experienced sexual violence. This included poorer general health and increased risk of chronic conditions, sexually transmitted infections, anxiety, depression and psychological distress.
Aim 6: Sexual violence and health services
Across all cohorts, women who had experienced sexual violence had higher average annual costs for non-referred health services (such as a consultation with a general practitioner or registered doctor) than women who had not experienced sexual violence. Over time, this difference in annual costs increased.
There was higher uptake of at least one mental health consultation for women who had experienced sexual violence compared to those who had not experienced sexual violence. However, for women who had at least one mental health consultation, the total number of consultations and government-subsidised costs for mental health services were similar between women who had and had not experienced sexual violence.
Aim 7: Wellbeing among women who have experienced sexual violence
Two forms of social support (emotional support and guidance, and affection and social interaction) and physical activity were related to good health among women who had experienced sexual violence. Three forms of social support (emotional support and guidance, affection and social interaction, and tangible or physical assistance), physical activity and mental health service use were related to better mental health among women who had experienced sexual violence.
Conclusion
Primary prevention is key to alleviating the traumatic and long-term impact of experiencing sexual violence but there are many women in our community who have already experienced sexual violence. The outcomes are grave and long lasting, impacting economic security and physical and mental health. There are reasons for hope, as the findings here have shown the value of interpersonal support and mental health services. Still, there is much work to be done in policy, practice and research.
The data provide a national picture of life for women who have experienced sexual violence. Findings emphasise the importance of accurate measurement and the seriousness and longevity of adverse impacts. The results also indicate the need for a comprehensive understanding and investment in primary healthcare and intersectoral support for women who have experienced sexual violence so that they can enjoy optimal wellbeing and avoid secondary traumatisation.
Implications and recommendations for policy and practice
- A holistic response that takes account of women’s whole lives at both policy and practice levels is needed, given the high prevalence of sexual violence and its multiple impacts. We recommend that sexual violence be considered a health risk within policy development at all levels of government.
- A clear focus on priority populations (e.g. LGBTQA+ and intersex people, women with disability, women from culturally and linguistically diverse backgrounds) is required in all policies addressing sexual violence.
- There is a need for a broad, consistent definition of sexual violence. Our broad measures resulted in a much greater data capture of sexual violence and are in keeping with current national conversations concerning consent. Further consultation with stakeholder communities is needed.
- Research should take a life course, longitudinal approach to estimating the prevalence of sexual violence. With consistent definitions, longitudinal data permit changes in prevalence to be captured and assessed in relation to policy initiatives.
- Service providers should employ a life course approach when delivering services to women who have experienced sexual violence. Women who had experienced childhood sexual violence were more likely to experience violent acts in adulthood.
- Prevention programs and policies should be designed with consideration of potential behavioural drivers. The increased likelihood of adverse health behaviours among women who have experienced sexual violence indicates the need for a more nuanced lens in overall prevention program and policy development. For example, obesity prevention tends to focus on nutrition and physical activity, with potentially insufficient attention given to the drivers of adverse health behaviours.
- Health and support services for women who have experienced sexual violence should be subsidised or free. The strong association between sexual violence and poor health outcomes across all generations indicates a need for more health service support, but the impact of financial stress might deter service access.
- Health services can play a key role. Primary healthcare providers are well placed to be the gateway to an intersectoral approach. Evidence-based training and investment in primary healthcare and referral services are needed to facilitate an intersectoral response to the health impact of sexual violence.
Directions for future research
To continue to develop the evidence base in Australia, the following directions are recommended for future research:
- Distinct differences in prevalence were noted between generations. There is a need to understand more fully what is driving these differences for more accurate prevalence data across the life course.
- Research conducted in partnership with communities is needed to describe and understand the factors that influence disclosure of sexual violence and the health and wellbeing of women who have experienced sexual violence who belong to priority populations.
- There is no comprehensive understanding of why women who have experienced sexual violence at one stage of life are more likely to experience sexual and other forms of violence at later life stages. Research is needed in this area to provide the evidence base for policy and practice development, with a view to prevention of multiple experiences of violence.
- A mixed-methods study that uses qualitative data to investigate the nuances of the economic impact of sexual violence followed by quantitative scenario modelling could reveal potential interventions designed to alleviate the economic burdens associated with sexual violence.
- A better understanding of the drivers of risky health behaviour for women who have experienced sexual violence is needed to inform prevention practice and policy development.
- Long-term physical and mental health impacts and behavioural risk factors underscore the need for nuanced primary healthcare services and intersectoral referral networks that can address the needs of women who have experienced sexual violence. More research is needed into effective primary care service provision for those who have experienced sexual violence.
- While beyond the scope of the current report, there remains a need for research on prevention of sexual violence.
Introduction
Sexual violence is a pervasive issue that affects women and is primarily perpetrated by men (World Health Organization, 2017; World Health Organization & London School of Hygiene and Tropical Medicine, 2010). The World Health Organization (WHO) defines sexual violence as
any sexual act, attempt to obtain a sexual act or other act directed against a person’s sexuality using coercion, by any person regardless of their relationship to the victim, in any setting. (World Health Organization & London School of Hygiene and Tropical Medicine, 2010, p. 11)
Within an Australian context, the Australian Government Department of Social Services adopts a similar definition, as stated in the Fourth Action Plan of the National Plan to Reduce Violence against Women and their Children 2010–2022 (Department of Social Services, 2019, p. 60):
Sexual violence refers to sexual actions without consent, which may include coercion, physical force, rape, sexual assault with implements, being forced to watch or engage in pornography, enforced prostitution or being made to have sex with other people.
Similarly, the Australian Institute of Health and Welfare refers to sexual violence as “behaviours of a sexual nature carried out against a person’s will”, specifying that it may be perpetrated by current or previous partners, other known people or strangers (Australian Institute of Health and Welfare, 2019a, p. 2). It should be noted that states and territories in Australia adopt different definitions of sexual violence, often resulting in various jurisdictional datasets (Australian Institute of Health and Welfare, 2018; Parliament of Australia, 2006). The need for consistent definitions to improve the measurement and understanding of sexual violence has been highlighted (Australian Institute of Health and Welfare, 2018).
It is widely documented that women who have experienced sexual violence suffer adverse health, economic and social outcomes (Bacchus et al., 2018; Carr et al., 2020; Dillon et al., 2015; Nikischer, 2014; Sanz-Barbero et al., 2019). It has also been suggested that experiencing sexual violence may increase women’s likelihood of experiencing further violence throughout their lives (Aakvaag et al., 2019; Conley et al., 2017; Cox, 2015; Gartland et al., 2016; Öberg et al., 2019; Öberg et al., 2021; Relyea & Ullman, 2017). Further, there is evidence to indicate differential risks of victimisation among diverse groups of women, including ethnic minorities, LGBTQA+ and intersex communities, and women with disability (Australian Institute of Health and Welfare, 2019b; Bonomi et al., 2018; Campo & Tayton, 2015; Heywood et al., 2022). To address these issues and effectively support women in their recovery from sexual violence, it isnecessary to understand how they are affected by sexual violence across the life course.[1] The following section provides a review of previous research on the prevalence and impact of sexual violence, as well as findings on potential factors that may assist women in recovering from sexual violence.
Literature review
The prevalence of sexual violence
To address the impact of sexual violence, it is important to understand the prevalence of the issue. This requires accurate and reliable data on multiple forms of sexual violence across women’s lives (World Health Organization, 2017). In recent years, the prevalence of sexual violence has been widely reported across the global, international and national literature.
A broad range of data sources have captured women’s experiences of sexual violence at various stages of life including childhood, adolescence, young adulthood, adulthood and older age. There is significant variation in the figures reported which can be attributed to the endorsement of different definitions of sexual violence, heterogeneity in data collection methods and the different settings in which the research is conducted (Cox, 2015; Davidson et al., 2016; Taylor & Shrive, 2021). It is important to consider the individual contexts from which these findings have been drawn.
Global estimates of the prevalence of sexual violence
Global estimates from the WHO indicate that 35 per cent of women have experienced physical and/or sexual intimate partner violence or non-partner sexual violence. Worldwide, nearly one third of women who have been in a relationship have experienced physical and/or sexual violence by their intimate partner. Moreover, 7 per cent of women have experienced sexual assault by someone other than their partner (World Health Organization et al., 2013). Sexual violence also affects a large proportion of children. In 2014, approximately 18 per cent of females worldwide had experienced sexual violence before the age of 18, according to a meta-analysis of population-based prevalence studies (World Health Organization, 2014).
International estimates of the prevalence of sexual violence
Estimates of the prevalence of sexual violence have been reported across a range of international studies. Recently, the United Kingdom Women’s Experiences of Violence and Abuse Study (Taylor & Shrive, 2021) examined experiences of sexual violence and abuse in a sample of over 22,000 women. Prevalence was higher than reported elsewhere, with 99 per cent of women aged 18 and over subjected to at least one sexual offence in their lifetime (Taylor & Shrive, 2021). Additionally, more than half of women (51%) reported having woken up to their male partner performing sexual acts on them while they were asleep; 80 per cent were sexually touched without consent by someone; 36 per cent were sent an unsolicited nude picture of a male; and nearly one third (30%) of women reported being forced to engage in sex acts by someone before the age of 13 years old (Taylor & Shrive, 2021). The survey also captured multiple experiences ofsexual violence, with results suggesting that women will be subjected to at least 26 acts of sexual violence in their lifetime, with 13 of these occurring before the age of 18 (Taylor & Shrive, 2021). In this study, “sexual offence” included multiple forms of sexual harassment, sexual assault and rape. In addition, terms such as “abuse”, “rape”, “sexual violence” and “sexual abuse” were omitted from survey items as this improved accuracy of responses (Taylor & Shrive, 2021). These results suggested a potential underestimation of the prevalence of sexual violence against women among other studies that use more conservative measures (Taylor & Shrive, 2021).
In comparison, findings from the United States National Intimate Partner and Sexual Violence Survey included that 19 per cent of women aged 18 years and over had been raped and more than two fifths (44%) had experienced other forms of sexual violence during their lifetime (Breiding, 2015). Findings from the Canadian National Victimization Survey revealed that approximately 2 per cent of women reported experiencing physical and/or sexual intimate partner violence in their current relationships in the past five years (Lysova et al., 2019).
Other studies have utilised linkage to administrative health databases to estimate the frequency of sexual assaults. For example, Muldoon et al. (2019) conducted a 15-year retrospective analysis of substantiated sexual assault cases in Canada. The highest rate was seen among the 15 to 19 years age group, with approximately 187 per 100,000 females having experienced sexual assault, followed by 127 per 100,000 females aged 20 to 24 (Muldoon et al., 2019).
While much of the literature on sexual violence in adulthood draws from samples over the age of 18, few studies have examined experiences of sexual violence among older women. A recent systematic review and meta-analysis of predominately high-income countries estimated that 2 per cent of adults in institutional settings had experienced sexual violence, however, there is a paucity of evidence applicable to the general population (Yon et al., 2019).
Much of the United States-based research on the prevalence of sexual violence among women has also utilised college sampling due to higher rates of assault often reported by college-aged women compared to other age groups (Bradel et al., 2019; Brener et al., 1999; Conley et al., 2017). For example, Conley et al. (2017) reported that 23 per cent of women experienced sexual assault while in college, defined as rape, attempted rape, being made to perform any type of sexual act through force or threat of harm, or any other unwanted or uncomfortable sexual experience.
International studies have also examined the prevalence of sexual violence in childhood years (Craner et al., 2015; Finkelhor et al., 2014; Herbert et al., 2021; Merrick et al., 2018; Wincentak et al., 2016). Using data from the United Kingdom Avon Longitudinal Study of Parents and Children, Herbert et al. (2021) estimated the lifetime prevalence of intimate partner sexual violence victimisation among women aged 17 to be 9 per cent (Herbert et al., 2021). Similarly, findings from an online survey of youth in the United States indicated that 11 per cent of females aged 14 to 15, 12 per cent of females aged 16 to 17, and 15 per cent of females aged 18 to 21 had experienced sexual adolescent dating violence, including unwanted kissing, unwanted touching, other unwanted sexual activity, attempted forced sex and forced sex by a partner (Ybarra et al., 2016).
National estimates of the prevalence of sexual violence
Estimates of sexual violence prevalence have also been reported at the national level in Australia. According to the Australian Bureau of Statistics’ 2016 Personal Safety Survey (PSS; Australian Bureau of Statistics, 2017), approximately one in five Australian women have experienced sexual violence. In 2016, it was estimated that 18 per cent of Australian women over the age of 18 had experienced sexual violence since the age of 15. The PSS also indicated that just under 2 per cent of Australian women had experienced sexual violence in the last 12 months. Eleven percent of women had been sexually abused before the age of 15, with more than half of these experiencing sexual violence for the first time before the age of 10. Further, of those who had experienced sexual violence before the age of 15, nearly half (47%) reported that the perpetrator was a non-familial known person (Australian Bureau of Statistics, 2017).
Australian cross-sectional studies have also captured prevalence data on sexual violence, although there is variation reported across the literature (Gartland et al., 2016; González-Chica et al., 2019; Kisely et al., 2020; Mills et al., 2016; Tarzia et al., 2017; Tarzia et al., 2018). A recent South Australian population-based study reported that 17 per cent of females had been sexually abused during their lifetimes (González-Chica et al., 2019). According to a different study conducted in general practice clinics, 41 per cent of women had experienced sexual violence since 15 years of age and 11 per cent had experienced sexual violence in the past 12 months (Tarzia et al., 2018). This study also documented large proportions of those who had experienced rape or sexual assault (16%), coercion into sexual acts or in reproductive control (18%), and unwanted sexual contact (e.g. groping, harassment, flashing or touching; 18%; Tarzia etal., 2018).
As reflected in the international literature, the body of research on the prevalence of sexual violence among young women often utilises university or college sampling, due to the disproportionate numbers of sexual assaults in these settings. Within an Australian setting, the 2021 National Safety Survey revealed that 21.3 per cent of female Australian students had been sexually harassed and 6 per cent had been sexually assaulted in an Australian university context (Heywood et al., 2022).
A number of Australian studies have also examined the prevalence of sexual violence within childhood (Gartland et al., 2016; Kisely et al., 2020; Mills et al., 2016; Tarzia et al., 2017; Tarzia et al., 2018). Data from a clinical sample revealed that 27 per cent of women had experienced a form of childhood sexual violence (Tarzia et al., 2017). Similarly, findings from a Melbourne pregnancy cohort indicated that nearly one in four (23%) women had a self-reported history of childhood sexual violence (Gartland et al., 2016). Additionally, much of the Australian literature on childhood sexual violence has reported on data captured from the Mater–University of Queensland Study of Pregnancy (Mills et al., 2016). According to a 2016 analysis, 31 per cent of females followed up at age 21 had a self-reported history of childhood sexual violence (Mills et al., 2016). More recently, state child protection agency data were used todetermine history of exposure to suspected childhood maltreatment at the 30-year follow-up phase. Although this analysis did not permit reporting of childhood sexual violence among females, 2 per cent of young adults had notifications of childhood sexual violence (Kisely et al., 2020).
Further, Australian studies have demonstrated that women from diverse groups and communities often experience sexual violence at higher rates (Dillon et al., 2015; Heywood et al., 2022; Ussher et al., 2020). For example, the 2021 National Safety Survey found higher rates of sexual assault and sexual harassment in an Australian university context among gay/lesbian, bisexual, nonbinary and transgender students compared to heterosexual students. Similarly, students with disability were more than twice as likely to experience sexual assault in an Australian university context, compared to those without disability (Heywood et al., 2022). Finally, previous research using ALSWH data found that women from inner regional and other rural areas were more likely to report lifetime intimate partner violence than those from major cities (Dillon et al., 2015).
The cumulative risk of violence
Associations between experiencing violence earlier in life and then again later in life have been documented, although these are not well understood (Aakvaag et al., 2019; Gartland et al., 2016; Relyea & Ullman, 2017). It has been suggested that women with a history of experiencing sexual violence are more likely to experience further violence throughout their lives (Aakvaag et al., 2019; Conley et al., 2017; Öberg et al., 2019; Öberg et al., 2021; Relyea & Ullman, 2017). This is important to understand in order to identify those at an increased risk of violence and address the potential cumulative impact of violence (Cox, 2015; Öberg et al., 2019). While there is a paucity of longitudinal studies examining trends over time, the available evidence reveals potential avenues to explore in future analyses.
Sexual violence and domestic violence co-occurrence and revictimisation has previously been examined in the ANROWS Landscapes Series (Cox, 2015). A review of the international literature from middle- and high-income countries suggested that women who have experienced childhood sexual violence are more likely to experience intimate partner sexual violence in adulthood than those without a history of childhood sexual violence. Further, the severity of the violence during childhood was shown to mediate the relationship to a certain degree. A similar association was found between childhood sexual violence and domestic violence in adulthood. It was noted that the lack of longitudinal studies of revictimisation limited the authors’ ability to draw conclusions on causal factors. Additionally, the lack of samples representative of the general population affected the external validity of the results (Cox, 2015).
Similarly, other international studies have demonstrated a strong link between experiencing violence in childhood and later in adulthood (Aakvaag et al., 2019; Bradel et al., 2019; Conley et al., 2017; Öberg et al., 2021; Relyea & Ullman, 2017). However, many of these do not differentiate between the types of violence experienced at both timepoints, and thus there is uncertainty surrounding the cumulative risk of sexual violence specifically (Aakvaag et al., 2019; Bradel et al., 2019; Relyea & Ullman, 2017).
Another review, conducted by Bidarra et al. (2016), demonstrated a link between exposure to parental intimate partner violence in childhood and experiencing childhood sexual violence. It was found that children exposed to intimate partner violence within their parents’ or caregivers’ relationships were at greater risk of being sexually abused during childhood, with the prevalence of the co-occurrence ranging from 12 to 70 per cent (Bidarra et al., 2016).
Within an Australian context, there is a paucity of evidence concerning women’s experiences of violence subsequent to an experience of sexual violence. Gartland et al. (2016) investigated patterns of violence and trauma among a prospective pregnancy cohort. Among women who had never given birth, 41 per cent reported a history of childhood violence. When followed up four years from baseline, 28 per cent of women reported having experienced intimate partner violence. Women with a history of childhood sexual or physical violence had a two- to three-fold risk of intimate partner violence during the study period compared to those without such a history (Gartland et al., 2016).
The relationship between experiencing sexual violence and socioeconomic factors
It is well known that lower socioeconomic status can impact on physical health and mental health, as can sexual violence (Bacchus et al., 2018; Carr et al., 2020; Hailes et al., 2019; Tarzia et al., 2017). Yet, the interplay between these factors is not well understood. Sexual violence has been shown to have an impact on various socioeconomic factors, including education, paid employment and financial stress (Baigorria et al., 2017). It is important to understand the relationship between women’s experiences of sexual violence at different stages of life and their socioeconomic status to ascertain the degree and length of this impact (Dillon et al., 2015; Sanz-Barbero et al., 2019). This will allow for tailored strategies to assist women in recovering from sexual violence (Kennedy et al., 2021; Nikischer, 2014).
International research has highlighted an inverse relationship between women experiencing sexual violence and educational attainment (Baigorria et al., 2017; Kennedy et al., 2021; Sanz-Barbero et al., 2019). Recently, a review found that low educational level was associated with experience of sexual violence among adolescent and adult women (Baigorria et al., 2017). Similarly, low educational status, as determined by the highest educational grade of participants’ primary caregivers, has been shown to predict sexual intimate partner violence (Kennedy et al., 2021).
There is also evidence to suggest that a history of sexual violence predicts poor academic performance in tertiary education settings (Baker et al., 2016). Baker et al. (2016) showed that a history of childhood sexual violence and adolescent/adult sexual assault predicted a poorer grade point average both at the end of the semester and at the four-year follow-up among college students. Experiencing sexual violence was also associated with a higher likelihood of dropping out of college, underscoring the need to address adverse educational outcomes of those who have experienced sexual violence and assess for sexual violence in college settings to identify women at risk of poor performance or leaving their studies.
A United States qualitative study provided insight into the interplay between experiencing sexual violence and educational outcomes (Nikischer, 2014). Participants reported drops in grades during high school and university degree programs, and this was attributed to a lack of confidence following sexual assault, fear of violence occurring at the educational setting, and difficulties with mental health and health behavioural factors that also followed experiencing violence. Further, women described a “ripple effect” on employment and career goals, indicating that socioeconomic challenges persisted in the long term (Nikischer, 2014).
Associations have also been drawn between women experiencing sexual violence and disruptions to employment and income hardship (Dillon et al., 2015; Showalter, 2016). A 2016 systematic review of the literature explored the co-occurrence of domestic violence, including sexual violence, and employment instability (Showalter, 2016). Many of the included studies documented higher rates of unemployment for women who had experienced domestic violence, compared to those who had not. Additional findings showed a correlation between experiencing domestic violence and job performance, inability to concentrate at work, fewer hours in paid work and job loss by termination or resignation. Direct workplace disruptions from women’s abusers were also observed and shown to negatively impact women’s employment stability. These included on-the-job harassment in person or via telephone, being prevented from going to work by the abuser and being late to work as aresult of violence. Finally, some of these relationships were mediated by mental health factors, highlighting a potential interaction between sexual violence, socioeconomic status and mental health (Showalter, 2016).
A number of studies have also observed differences in income and financial hardship between those with a history of sexual violence and their counterparts (Dillon et al., 2015; Loya, 2015; Showalter, 2016). However, there is a paucity of evidence demonstrating this relationship over time. Therefore, it is difficult to ascertain the extent of this association and fully understand women’s experiences of financial disadvantage in relation to sexual violence.
The relationship between experiencing sexual violence and health behaviours
Exposure to sexual violence has been widely associated with adverse health behaviours, including drug use, excessive alcohol use and tobacco use (Bacchus et al., 2018; Baigorria et al., 2017; González-Chica et al., 2019; Miller-Graff et al., 2021; Nemeth et al., 2016). It is important to understand the relationships between these variables to identify those who may benefit from referral to support services (Bone et al., 2018). Further, it is necessary to gain insight into these factors to understand and respond to the needs of women exposed to sexual violence (Bacchus et al., 2018; Bone et al., 2018).
Drug use has been consistently linked to experiencing sexual violence within the international literature, although the mechanisms underlying this relationship remain unclear (Austin & Short, 2020; Bacchus et al., 2018; Silva et al., 2020). A systematic review examined the associations between intimate partner violence, including sexual violence in the previous 12 months, and health risk behaviours (Bacchus et al., 2018). Intimate partner violence was shown to be associated with the use of cocaine, crack, heroin and marijuana among women aged 15 and over. This review highlighted the uncertainty surrounding the relationships over time, underscoring the need for longitudinal studies in this area (Bacchus et al., 2018).
Recently, data from the National Longitudinal Study of Adolescent to Adult Health in the Netherlands were used to examine the association between prescription opioid use and misuse and sexual violence over a decade (Austin & Short, 2020). Participants with a history of sexual violence were nearly 70 per cent more likely to use prescription opioids than those with no such history. An increased risk was also observed for past-30-day prescription opioid misuse, with a 20 per cent higher likelihood for women who had experienced sexual violence (Austin & Short, 2020).
There is variation within the literature regarding the link between alcohol consumption and experiencing violence (Bacchus et al., 2018; González-Chica et al., 2019). The associations have not been widely examined over time due to the paucity of longitudinal data (Bacchus et al., 2018; Massetti et al., 2018). A study using data from the 2006 United States Behavioral Risk Factor Surveillance System (BRFSS) examined the risk of binge drinking among those with a history of experiencing intimate partner violence, including sexual violence (Massetti et al., 2018). Those reporting intimate partner violence victimisation were more likely to have engaged in binge drinking in the past month compared to those without a history of intimate partner violence (Massetti et al., 2018). In contrast, a recent Australian study reported no significant association between experiencing sexual violence among adolescents and excessive alcoholintake (González-Chica et al., 2019).
There is also evidence to suggest a relationship between cigarette use and sexual violence (González-Chica et al., 2019; Melka et al., 2019; Nemeth et al., 2016). For example, an Australian study found that participants who had experienced sexual violence were more likely to indicate smoking dependence (defined as smoking three or more cigarettes every day) than those without a history of sexual violence (González-Chica et al., 2019).
International research has also highlighted a link between body mass index (BMI) and sexual violence in childhood and adolescence (Clark et al., 2014; Stensland et al., 2015). Clark et al. (2014) examined data from the United States National Longitudinal Study of Adolescent Health, finding that the occurrence of violence within a relationship predicted an increase in BMI. Further, stratified results showed a magnification of the increase in BMI for those with a history of childhood sexual violence. Stensland et al. (2015) found a robust and significant relationship between interpersonal violence, including sexual violence, and increased BMI within a cohort of Norwegian youth. This remained after adjustment for socioeconomic and health behavioural factors and was more evident among female participants compared to males (Stensland et al., 2015).
The relationship between experiencing sexual violence and health
Experiencing violence has been linked to a plethora of negative health outcomes (Bacchus et al., 2018; Felitti et al., 1998). Globally, intimate partner violence has been shown to result in a higher burden of disease and has been linked to a lower life expectancy (Mokdad et al., 2016). Regarding sexual violence, there are consistent reports of an association with mental health, including depression, anxiety, psychological distress and post-traumatic stress disorder (PTSD; Bacchus et al., 2018; Coles et al., 2014; Hailes et al., 2019). The relationship between sexual violence and physical health has not been thoroughly examined, although links to cancer diagnoses, bodily pain and general health have been documented (Coles et al., 2014; Reingle Gonzalez et al., 2018). Studies have also reported links between experiencing sexual violence and socioeconomic status, health behaviours and health. However, the mechanisms through which thesefactors interact are not well understood. It is necessary to determine the health outcomes of women who have experienced sexual violence as a means to improve the identification of who may present to services and address the impact of violence on their health and wellbeing (Oram et al., 2017).
Physical health
A recent systematic review examined the long-term health and psychosocial outcomes of child maltreatment within long-term care settings, including experiencing childhood sexual violence (Carr et al., 2020). Participants of the included studies had retrospectively reported violence in residential care centres and in foster care settings. There were significant associations between child violence and physical health outcomes across the life span, including physical illness, being on long-term sick leave from work, chronic medical complaints (particularly headaches, back pain and joint pain), allergies and asthma (Carr et al., 2020).
The relationship between sexual violence and cancer diagnoses has also been examined. Reingle Gonzalez et al. (2018) conducted a meta-analysis and demonstrated a significant, positive relationship between violence against women and cancer diagnoses. Women who had experienced intimate partner violence, including sexual violence, were more likely to be diagnosed with cancer compared to those who had not. Associations were particularly strong for cervical cancer (Reingle Gonzalez et al., 2018).
Previous cross-sectional research using ALSWH data has investigated the relationship between childhood sexual violence and physical health (Coles et al., 2014). Among women in their late twenties and early thirties, those who had experienced childhood sexual violence were more likely to report bodily pain and poor general health than those who had not. Further, those who experienced childhood sexual violence and adult violence were more than twice as likely to experience poor general health compared to those without a history of violence (Coles et al., 2014).
Mental health
It is well documented that poor mental health and psychiatric conditions are common among those with a history of experiencing violence (Bacchus et al., 2018; Bone et al., 2018; Coles et al., 2014; Hailes et al., 2019; Khadr et al., 2018; Tarzia et al., 2017; Tarzia et al., 2018). However, the extent to which this persists over time is unclear. For example, in a study of adolescents accessing sexual assault services in Greater London, 88 per cent of participants were at risk of depression, 71 per cent were at risk of anxiety and 91 per cent were at risk of PTSD. Furthermore, more than half of the sample were at risk of experiencing multiple mental health conditions, highlighting the need for comprehensive support following sexual assault (Khadr et al., 2018).
Additionally, a recent systematic review collated findings on the relationship between recent intimate partner violence, including sexual violence, and depressive symptoms as reported in cohort studies (Bacchus et al., 2018). Women reporting recent intimate partner violence were 76 per cent more likely to experience subsequent depressive symptoms than those reporting no violence. Similarly, those reporting depressive symptoms had a 72 per cent increased risk of subsequent intimate partner violence. Additionally, results from cohorts of pregnant women revealed more than a two-fold risk of subsequent postpartum depression among those who had experienced recent intimate partner violence. The review noted significant differences in measurement between the studies, while also highlighting the need for longitudinal studies that consider the differential effects of recent versus historical exposure to intimate partner violence (Bacchus et al.,2018).
Another systematic review examined the association between childhood sexual violence and mental health (Hailes et al., 2019). Childhood sexual violence was shown to be associated with schizophrenia, borderline personality disorder, anxiety and depression, with odds ratios ranging from 2.2 to 3.3. (Hailes et al., 2019).
At the national level, many Australian studies have also provided evidence for the link between sexual violence and poor mental health (Coles et al., 2014; Gartland et al., 2016; Tarzia et al., 2017; Tarzia et al., 2018). Previous ALSWH research has examined mental health and childhood sexual violence within a cross-sectional study of the 1973 to 1978 cohort, when aged 28 to 33 (Coles et al., 2014). Findings revealed that women who experienced childhood sexual violence were 40 per cent more likely to have been depressed and 40 per cent more likely to have had anxiety in the previous three years than those who had not experienced childhood sexual violence (Coles et al., 2014).
An Australian pregnancy cohort study has also demonstrated greater odds of anxiety among those with a history of child maltreatment (Gartland et al., 2016). Similarly, Tarzia et al. (2017) examined this using a clinical sample, finding that women attending Australian general practice clinics who had experienced sexual violence in adulthood were more likely to experience anxiety than those who had not experienced sexual violence in adulthood. A later analysis from the same study highlighted the effect of perpetrator identity on the relationship between mental health and sexual violence (Tarzia et al., 2018). Sexual violence perpetrated by an intimate partner was associated with higher scores for PTSD and depression compared to those for women who had experienced sexual violence perpetrated by a stranger or a person known to them (Tarzia et al., 2018).
Service use, cost of selected services and satisfaction with general practitioners in relation to experiencing sexual violence
International studies have also investigated experiencing sexual violence in relation to use of different health services (Massetti et al., 2018; Mørk et al., 2014; Sutherland et al., 2016; Watson-Johnson et al., 2012; Yang et al., 2014). Some cross-sectional analyses have demonstrated a lower uptake of health services among those with a history of sexual violence, although there is a paucity of longitudinal data to examine long-term trends and potential reasons for this (Graham et al., 2019). The current evidence base highlights shortfalls in screening for a history of sexual violence in healthcare settings (Sutherland et al., 2016) and suggests a need for improved responses by practitioners to disclosures of sexual violence (Mørk et al., 2014; Taylor et al., 2012). Some studies have also revealed a significant cost to women accessing services following sexual assault, highlighting a potential barrier to accessingsupport (Yang et al., 2014). It is important to determine the differences in service use, cost and satisfaction between those who have experienced sexual violence and those who have not, to improve service provision (Taylor et al., 2012). It should be noted that much of the available evidence is drawn from countries with non-comparable health systems to Australia, such as the United States.
Data from the large-scale United States BRFSS have been used to show that fewer women reporting intimate partner violence had health insurance, a personal doctor or healthcare provider, or regular check-ups within the previous two years compared to those not reporting intimate partner violence. Massetti et al. (2018) suggested that these findings may partially explain the link between violence and chronic disease. It was also noted that these associations were likely affected by sociodemographic differences (Massetti et al., 2018). Watson-Johnson et al. (2012) demonstrated a link to cancer screening using these data, reporting that women with a history of sexual violence were less likely to undergo regular mammography screening for breast cancer than those without such history (74% versus 77%; Watson-Johnson et al., 2012). Lower rates of mammography and colorectal cancer screening were also reported among women who hadexperienced intimate partner violence compared to those who had not (66% versus 77% and 49% versus 55%, respectively; Massetti et al., 2018). These findings support the notion that sexual violence may be associated with reduced healthcare use.
The costs of service use in relation to sexual violence have not been extensively examined. A large, population-based study in Iowa investigated the incidence and cost of sexual violence, including health service expenses (Yang et al., 2014). Yang et al. (2014) utilised data from population surveys and government agencies, among other sources, to calculate direct costs of sexual violence against 55,340 people in the state. These costs included medical care and mental healthcare expenses, among other non-health-related expenses (e.g. property damage and indirect expenses for loss of work). The estimated total cost of sexual violence in Iowa in 2009 was US$4.7 billion, which equated to US$1,580 per resident (Yang et al., 2014).
Recovery from sexual violence
Despite some variation in the strength of associations, the literature consistently demonstrates the significant and long-lasting impact of sexual violence on women. This underscores the need to address the increased vulnerability to further violence, sociodemographic differences and health deficits shown to exist among women who have experienced sexual violence (Ellsberg et al., 2015). It is important to understand the factors that might assist in improving women’s recovery from sexual violence, to inform potential services and policies (Hellman, 2014). There is a paucity of evidence regarding sexual violence specifically; however, some studies have identified potential factors for future research to focus on. In particular, the recent literature highlights the influence of social support for assisting women with a history of sexual violence in their recovery from mental health and health behavioural issues (Dillon et al., 2015; Hunteret al., 2012; Rees et al., 2019), although the relationship between sexual violence and social support remains unclear (Hunter et al., 2012; Rees et al., 2019).
A number of studies have assessed the effectiveness of programs and psychological services designed to assist women’s recovery from domestic violence, however, there is a need for research into services specific to supporting those who have experienced sexual violence. A recent review of previous systematic reviews was conducted to identify interventions relevant to recovery from domestic and sexual violence in primary care (Hegarty et al., 2016). Findings revealed limited evidence regarding effective interventions. However, the following interventions showed strong potential:
- nurse home visiting advocacy programs
- mother–child psychotherapeutic interventions
- specific psychological treatments (including cognitive behaviour therapy, trauma-informed cognitive behaviour therapy and eye movement desensitisation and reprocessing interventions; Hegarty et al., 2016).
A recent mixed-methods study demonstrated the negative impact of intimate partner violence on women’s sense of self (Moulding et al., 2021). Moulding et al. (2021) outlined the losses in relation to income, work, housing and social participation that were seen to undermine women’s recovery from violence in the long term. This study highlighted the influence of socioeconomic factors on psychological distress in response to experiencing violence and highlighted the potential role of these factors in assisting with women’s recovery (Moulding et al., 2021).
Furthermore, some services have demonstrated improvements in health behaviour linked to sexual violence. For example, for a sample of 233 girls, Walsh et al. (2020) reported on the effectiveness of a brief video delivered to victims during medical forensic examination of sexual assault. The video intervention, designed to reduce psychopathology, was shown to prevent uptake of cigarette smoking following sexual assault. Notably, this intervention focused on preventing further impact of sexual violence rather than recovery (Walsh et al., 2020).
In addition, a recent Australian study followed a mixed-methods approach to identify contextual factors and mediating emotional responses associated with experiences of mental health conditions following sexual violence (Rees et al., 2019). The qualitative component of the study highlighted the impact of negative responses to violence disclosure by parents and other family members, as well as barriers to support, validation and trust among women who had experienced sexual violence as a child. Women with a history of childhood sexual violence reported being ignored, not being believed and being threatened with retribution following disclosure to adult family members. Other themes that emerged included self-blame, betrayal and psychosocial vulnerability. These findings underscored the need for further research in this area to gain deeper understanding of potential factors that support women’s recovery from the long-term impacts of sexualviolence (Rees et al., 2019).
Policy context: The National Plan to Reduce Violence Against Women and Their Children 2010–2022
The Australian Government Department of Social Services highlights sexual violence as a national priority area in the Fourth Action Plan of the National Plan to Reduce Violence against Women and Their Children 2010–2022 (Department of Social Services, 2019). In addition, the Fourth Action Plan underscores the need to respond to diverse experiences of violence, identifying priority populations of women who experience higher rates of violence, experience more barriers to help-seeking and accessing support, and/or are at higher risk of experiencing violence at particular life stages (Department of Social Services, 2019). To address these national priorities, there is a need for high-quality research into the prevalence and impact of sexual violence across the life course. This requires accurate and comprehensive longitudinal data.
Evidence gap
Despite the pervasive nature of sexual violence, data in Australia are largely confined to those collected at a single point in time. This approach is limited due to its inability to capture experiences of violence across the life course. Thus, there is uncertainty surrounding the true prevalence of sexual violence throughout women’s lives. Previous ALSWH research highlights the importance of collecting longitudinal data on violence to capture the complexity of women’s experiences. In addition, it is suggested that repeated data collection of experiences of violence across time may mitigate the effects of potential under-reporting (Loxton, Townsend et al., 2017).
Some of the variation within the available literature on prevalence likely reflects heterogeneity between sample characteristics. Non-population-based samples, such as those in the general practice setting and among pregnant women, can affect external validity by limiting the applicability of findings to the general population (Cox, 2015; Davidson et al., 2016; Gartland et al., 2016; Tarzia et al., 2017; Tarzia et al., 2018; Woolhouse et al., 2015). A number of studies have also reported on data collected using conservative measures of violence, such as cases captured from child protection data (Mathews et al., 2017). As experiencing violence is often under-reported, studies using administrative data sources are likely to underestimate true prevalence (Alaggia et al., 2017). Further, this is exacerbated for various cohorts of women, including First Nations women, migrant and refugee women, women in rural and remote communities, womenwith disability, and LGBTQA+ and intersex communities (Australian Institute of Health and Welfare, 2019b; Bonomi et al., 2018; Dillon et al., 2015; Heywood et al., 2022; Szalacha et al., 2017; Ussher et al., 2020; Willis, 2011). Population-based surveys capturing self-reported data from people who have experienced sexual violence offer the most accurate estimates of sexual violence prevalence (World Health Organization, 2017).
Research suggests that women with a history of sexual violence are more likely to experience further violence throughout the life course compared to those without such history (Aakvaag et al., 2019; Conley et al., 2017; Cox, 2015; Gartland et al., 2016; Öberg et al., 2019; Öberg et al., 2021; Relyea & Ullman, 2017). However, as previously highlighted in the ANROWS Landscapes Series (Cox, 2015), this is yet to be examined using longitudinal data from nationally representative samples in Australia. Thus, there is also a large degree of uncertainty surrounding the potential links between sexual violence at different life stages and vulnerability to violence.
There is also limited understanding about the ways sexual violence impacts women over time. The trajectory of economic, social, physical and mental health of women who have experienced sexual violence is unknown (Bacchus et al., 2018; Carr et al., 2020; Dillon et al., 2015; Nikischer, 2014; Sanz-Barbero et al., 2019). It is important to better understand this to identify factors that might assist in recovery from sexual violence. Service use, cost and satisfaction has not been examined at the national level in Australia, nor have potentially helpful social factors. In addition to education and paid employment, services and social factors might have the capacity to help improve women’s quality of life after sexual violence, but empirical evidence is lacking. There is a crucial need to identify factors that improve women’s recovery from sexual violence.
A recent ANROWS research synthesis on intimate partner sexual violence underscored the current need for studies that accurately capture multiple experiences of violence across the life course within samples that are representative of the general population (Australia’s National Research Organisation for Women’s Safety, 2019). The ALSWH offers a unique opportunity to fill this gap, providing data on sexual violence that are comprehensive, accurate, broadly representative and span a period of more than 20 years. Recent findings from the study indicate that almost one in two (46%) women born in 1989 to 1995 had experienced sexual violence (Loxton et al., 2019). The present study builds on these results by examining sexual violence prevalence and impact across multiple time points and for women in three distinct age cohorts (those born in 1989 to 1995, 1973 to 1978 and 1946 to 1951), covering ages 18 to 74.
Further, previous research findings have indicated that those from certain groups and communities may experience sexual violence at higher rates, however these have not been extensively examined (Australian Institute of Health and Welfare, 2019b; Bonomi et al., 2018; Dillon et al., 2015; Heywood et al., 2022; Lewis et al., 2015; Sanz-Barbero et al., 2019; Sigurvinsdottir & Ullman, 2016; Szalacha et al., 2017; Ussher et al., 2020). This study considers differences in the prevalence and impact of sexual violence among priority populations. For the purposes of this report, this includes those identified as belonging to priority populations in the Fourth Action Plan of the National Plan to Reduce Violence Against Women and Their Children 2010–2022 (Department of Social Services, 2019), for whom data are available. This includes women living in regional and remote areas; women who are from CALD backgrounds; women with disability;and women who are lesbian, gay and bisexual.
It should be noted that, while Aboriginal and Torres Strait Islander women take part in the ALSWH, the data are not currently disaggregated by Indigenous status for historical and ethical reasons.[2] Due to requests from Aboriginal and Torres Strait Islander communities to access this data, this policy is under review and consultations with representatives from Aboriginal and Torres Strait Islander communities are underway.
Aims of project
The purpose of this report was to assess the prevalence of sexual violence over the life course and the impact of sexual violence on health and wellbeing among Australian women by analysing national, longitudinal data. The research had the following specific aims:
- Determine the prevalence of sexual violence across the life course, including sexual violence experienced in childhood and adulthood, experienced both within an intimate relationship and outside of such a relationship.
- Determine the role of sexual violence during childhood as a risk factor for experiences of multiple forms of violence later in life.
- Identify the impact of sexual violence on socioeconomic factors over time, such as education, paid employment and financial stress.
- Determine the nature of associations between sexual violence experienced by women at different life stages and subsequent health behaviours.
- Assess the impact of sexual violence on women’s physical and mental health.
- Measure health service use in relation to sexual violence, including costs of selected health services and satisfaction with general practitioner services.
- Identify factors associated with the general health and wellbeing of women who have experienced sexual violence.
Methods
Study setting
The ALSWH is an ongoing, national cohort study that investigates factors influencing the health and wellbeing of Australian women. The study began in 1996, and now includes data from more than 57,000 women across four age cohorts (born in 1989 to 1995, 1973 to 1978, 1946 to 1951 and 1921 to 1926). The ALSWH collects data on women’s physical and mental health, as well as demographics, health behaviours and attributes, lifestyle factors, social circumstances and use of health services. ALSWH data are linked with national and state-based administrative health datasets, such as the Medicare Benefits Schedule (MBS) and the Pharmaceutical Benefits Scheme (PBS), as well as hospital admission, perinatal and cancer registry datasets.
In 1996, the cohorts from 1973 to 1978, 1946 to 1951 and 1921 to 1926 were randomly selected from the Medicare database and recruited via mailed surveys (Brown et al., 1998). The three original cohorts were selected to follow women through life stages which are critical to women’s health and wellbeing. Sampling from the population was random within each age group, except that women from rural and remote areas were sampled at twice the rate of women in urban areas. This was done so that the numbers of women living outside major urban areas were large enough to allow statistical comparisons based on location.
In 2012 to 2013, a new cohort of women aged 18 to 23 years (born 1989 to 1995) was recruited using traditional methods (e.g. referral, print and commercial media), social media and social marketing campaigns (Loxton et al., 2015). In the first online survey, participants indicated their consent to participate by completing the survey, consenting to data linkage and providing their personal details. Information was validated by the Australian Government’s Services Australia.
Participants
The cohorts have been compared with Australian Census data of women of the same age and are found to be broadly representative of Australian women of the same age, with some over-representation of tertiary-educated women and some under-representation of women from non-English speaking backgrounds (Dobson et al., 2015; Mishra et al., 2014). This ANROWS report includes data from the three youngest ALSWH cohorts (born 1989 to 1995, 1973 to 1978 and 1946 to 1951). Participants from the 1973 to 1978 and 1946 to 1951 cohorts have been surveyed approximately every three years since 1996, while participants in the 1989 to 1995 cohort have been surveyed annually from 2013 to 2017 and then again in 2019 (Table 1).
Table 1: Schedule of surveys across the three ALSWH cohorts born 1989 to 1995, 1973 to 1978 and 1946 to 1951, detailing year, age range and number of respondents at each survey
Survey
1989 to 1995 cohort
1973 to 1978 cohort
1946 to 1951 cohort
1
2013
Aged 18 to 23
N=17,010
1996
Aged 18 to 23
N=14,247
1996
Aged 45 to 50
N=13,714
2
2014
Aged 19 to 24
N=11,345
2000
Aged 22 to 27
N=9,688
1998
Aged 47 to 52
N=12,338
3
2015
Aged 20 to 25
N=8,961
2003
Aged 25 to 30
N=9,081
2001
Aged 50 to 55
N=11,226
4
2016
Aged 21 to 26
N=7,287
2006
Aged 28 to 33
N=9,145
2004
Aged 53 to 58
N=10,905
5
2017
Aged 22 to 27
N=8,495
2009
Aged 31 to 36
N=8,200
2007
Aged 56 to 61
N=10,638
6
2019
Aged 24 to 30
N=8,346
2012
Aged 34 to 39
N=8,009
2010
Aged 59 to 64
N=10,011
7
2015
Aged 37 to 42
N=7,186
2013
Aged 62 to 67
N=9,151
8
2018
Aged 40 to 45
N=7,121
2016
Aged 65 to 70
N=8,622
9
2021
Aged 43 to 48
in progress
2019 to 2020
Aged 68 to 73
N=7,956
The ALSWH has approval from the Human Research Ethics Committees from the University of Newcastle (H-076-0795, H-2012-0256 and H-2011-0371) and the University of Queensland (2004/HE000224, 2012/HE000950 and 2012/HE000132).
Measures
The measures included in each ALSWH survey are decided on in consultation with the Australian Government Department of Health, which funds data collection for the study, and various stakeholders. All measures are not able to be included in every survey and in all cohorts, as survey length has to be maintained to minimise the burden on participants.[3]
Sexual violence
The current report includes measures of 1) sexual violence experienced during childhood; 2) sexual violence experienced within an intimate relationship (i.e. sexual violence perpetrated by a spouse or partner); and 3) sexual violence where the perpetrator was not specified in the survey question. The schedule of data collection for these measures is shown in Table 2.
Table 2: Collection of sexual violence data across surveys for the ALSWH cohorts born 1989 to 1995, 1973 to 1978 and 1946 to 1951
Born 1989 to 1995
Survey
wave
Survey year
During childhood
By partner
Unspecified perpetrator
1
2013
The measure of sexual violence was included
2
2014
The measure of sexual violence was included
The measure of sexual violence was included
3
2015
The measure of sexual violence was included
The measure of sexual violence was included
4
2016
The measure of sexual violence was included
5
2017
Captured at this survey if not captured at previous surveys
The measure of sexual violence was included
The measure of sexual violence was included
The measure of sexual violence was included
6
2019
Captured at this survey if not captured at previous surveys
The measure of sexual violence was included
The measure of sexual violence was included
The measure of sexual violence was included
Born 1973 to 1978
Survey
wave
Survey year
During childhood
By partner
Unspecified perpetrator
1
1996
2
2000
The measure of sexual violence was included
3
2003
The measure of sexual violence was included
4
2006
The measure of sexual violence was included
5
2009
The measure of sexual violence was included
The measure of sexual violence was included
6
2012
The measure of sexual violence was included
The measure of sexual violence was included
7
2015
The measure of sexual violence was included
The measure of sexual violence was included
The measure of sexual violence was included
8
2018
The measure of sexual violence was included
The measure of sexual violence was included
Born 1946 to 1951
Survey
wave
Survey year
During childhood
By partner
Unspecified perpetrator
1
1996
2
1998
The measure of sexual violence was included
3
2001
The measure of sexual violence was included
4
2004
The measure of sexual violence was included
5
2007
The measure of sexual violence was included
6
2010
The measure of sexual violence was included
7
2013
The measure of sexual violence was included
8
2016
The measure of sexual violence was included
The measure of sexual violence was included
9
2019
The measure of sexual violence was included
* Captured at this survey if not captured at previous surveys.
Shaded cells indicate that the measure of sexual violence was included at that survey.
Sexual violence during childhood
The Adverse Childhood Experiences Scale (Felitti et al., 1998) was used to retrospectively measure childhood abuse. This instrument includes four items that measure sexual violence experienced during childhood (Table 3), with participants asked to indicate those experiences that applied to them, providing a minimum summed score of zero and a maximum summed score of four. A score greater than zero indicates a history of sexual violence during childhood.
Table 3: Childhood sexual violence items from the Adverse Childhood Experiences Scale
While you were growing up during your first 18 years of life, did an adult or person at least 5 years older than you: (mark all that apply)
Touch or fondle you in a sexual way? 
Have you touch their body in a sexual way? 
Attempt oral, anal or vaginal intercourse with you? 
Actually have oral, anal or vaginal intercourse with you? 
Sexual violence perpetrated by a partner
For the 1989 to 1995 and 1973 to 1978 cohorts, women were asked: “This question asks about situations you may have experienced with current or past partners: being forced to take part in unwanted sexual activity”, with response options: “In the last 12 months”, “More than 12 months ago” or “Never”. Note that at Survey 4 of the 1973 to 1978 cohort, the response options were “Only once”, “Several times”, “Once per month”, “Once per week”, “Daily” or “Never.” These response options were collapsed as required to match the categories used in the later survey measures.
Sexual violence perpetrated by an unspecified perpetrator
Women in all cohorts were asked, “Have you experienced any of the following events: being forced to take part in unwanted sexual activity” with response options: “In the last 12 months”, “More than 12 months ago” or “Never”. Note that at Survey 1 of the 1973 to 1978 and 1946 to 1951 cohorts, the question was phrased: “In the last 12 months, have you experienced any of the following events: being forced to take part in unwanted sexual activity” with response options “Yes” and “No”.
Cumulative sexual violence
We defined a composite variable for whether or not women had ever experienced any sexual violence at each time point (yes or no). In models examining the effect of sexual violence, we used the lag of this variable as the exposure, so that the sexual violence exposure preceded the outcome/s used in the analyses.
Domestic violence
Women in all cohorts were asked at all surveys (except Survey 2 and Survey 3 of the 1973 to 1978 and 1946 to 1951 cohorts), “Have you ever been in a violent relationship with a partner/spouse?”, with response options “Yes” and “No”. An affirmative response was considered indicative of a history of domestic violence.
For the 1989 to 1995 and 1973 to 1978 cohorts, women could also have reported a history of domestic violence via the Community Composite Abuse Scale (CCAS) or the Abbreviated Community Composite Abuse Scale (abCCAS), respectively (Loxton et al., 2013). These scales include questions related to four domains of behaviour by a partner or spouse: emotional abuse, physical abuse, harassment and sexual abuse. The following response options were available: “Never”, “Yes – in the last 12 months” and “Yes – more than 12 months ago”. Note that at Survey 4 of the 1973 to 1978 cohort, the response options were “Only once”, “Several times”, “Once per month”, “Once per week”, “Daily” or “Never”. These response options were collapsed to “In the last 12 months” or “Never”. An affirmative response for any item on the CCAS or abCCAS instruments was considered indicative of a history of domestic violence, except for the CCAS item “Became upset ifdinner/housework wasn’t done” and the abCCAS item “Became upset if dinner/housework wasn’t done when they thought it should be”. In a similar manner, a response to “Yes – in the last 12 months” was considered indicative of recent domestic violence (excluding the dinner/housework item).
Physical violence
Women in all cohorts were asked “Have you experienced the following events: being pushed, grabbed, shoved, kicked or hit?”, with response options: “No”, “Yes – in the last 12 months” and “Yes – more than 12 months ago”. An affirmative response was considered indicative of a history of physical violence (in the last 12 months or more than 12 months ago). A response to “Yes – in the last 12 months” was considered indicative of recent physical violence.
Similarly, an affirmative response to any of the items in the physical abuse domain of the CCAS or abCCAS was considered indicative of a history of physical violence by a partner. A response to “Yes – in the last 12 months” for any of the physical violence items was considered indicative of recent physical violence.
All the physical violence items were combined to form a single physical violence item, which includes lifetime physical violence and recent physical violence variants.
Socio-demographic factors
Age
Age was calculated at each survey by obtaining the difference between the survey completion date and the participant’s date of birth. Models that controlled for age treated age as a continuous variable.
Area of residence
Available for each survey, area of residence was based on the Accessibility/Remoteness Index of Australia (ARIA+), which indicates remoteness from service centres (Hugo Centre for Migration and Population Research, 2018). ARIA+ scores were grouped into “Major cities”, “Inner regional” and “Outer regional/remote/very remote”.
Educational status
Educational status was based on the highest qualification reported by the participant. The response options varied across the three cohorts but were broadly similar. Women’s responses were grouped into “Year 12 or below”, “Trade/apprenticeship/certificate/diploma” and “Tertiary qualification”. In Chapter 3, where specified, an alternative categorisation of “Year 12 or below”, “Year 12” and “More than Year 12” was used.
Relationship status
Relationship status was reported by each participant at each survey and was measured consistently across all three cohorts. Women’s responses were grouped into “Partnered” (married or de facto) and “Non-partnered” (separated, divorced, widowed or single).
Ability to manage on available income
Participants were asked at all surveys (except Survey 2 for women born 1973 to 1978), “How do you manage on the income you have available?” Responses were grouped into “Impossible/difficult all the time”, “Difficult some of the time” and “Not too bad/easy”. Further details on this survey item, including internal validation, can be found in the ALSWH Technical Reports (Australian Longitudinal Study on Women’s Health, 2019).
Cultural and linguistic diversity
Two measures were used to identify women from culturally and linguistically diverse (CALD) backgrounds. These measures captured information on country of birth and language. Women were classified as having a CALD background if they indicated that 1) they were born in a country where English was not the national language; 2) they did not speak fluent English; or 3) they usually spoke a language at home which was not English.
Women in all three cohorts were asked about their country of birth. Responses were categorised to indicate countries that are English-speaking versus those that are not. This measure was included in Survey 1, for women born 1973 to 1978 and 1946 to 1951, and Survey 2 for women born 1989 to 1995. At their first survey, all three cohorts were asked if they spoke fluent English and to indicate the language they spoke at home.
Financial outcomes
Full-time employment
Full-time employment was defined as working 35 or more hours per week, as per the Australian Bureau of Statistics definition (Australian Bureau of Statistics, 2021).
Financial stress
Financial stress was measured using the question “Over the last 12 months, how stressed have you felt about the following areas of your life?” for the item “Money”, with the following response options: “Not applicable”, “Not at all stressed”, “Somewhat stressed”, “Moderately stressed”, “Very stressed” and “Extremely stressed”. A dichotomous variable (yes/no) was subsequently derived to indicate high financial stress (very stressed or extremely stressed).
Sexual orientation
Sexual orientation was measured using the question “Which of these most closely describes your sexual orientation?”, with the following response options: “I am exclusively heterosexual”, “I am mainly heterosexual”, “I am bisexual”, “I am mainly homosexual”, “I am exclusively homosexual (lesbian)”, “I don’t know” and “I don’t want to answer”. These responses were then collapsed into three categories: “Exclusively/mainly heterosexual”, “Bisexual” and “Exclusively/mainly lesbian”.
Health behaviours
Smoking status
Smoking status was measured at each survey in each cohort. Women were classified as either “Non-smokers” (including ex-smokers) or “Current smokers”.
Alcohol consumption
Alcohol consumption was measured at each survey in each cohort according to NHMRC guidelines (Pols et al., 1992) and women were classified as either “Non-drinkers”, “Low-risk drinkers”, “Infrequent drinkers”, “Risky drinkers” or “High-risk drinkers”. In Chapter 4, these responses were then dichotomised as “Low-risk drinkers” (non-drinkers, low-risk drinkers and infrequent drinkers) and “High-risk drinkers” (risky drinkers and high-risk drinkers).
Physical activity
Physical activity was measured at each survey in each cohort according to Australian guidelines (Brown et al., 2013) and women were classified as having nil, low, moderate or high physical activity. In Chapter 4, these responses were then dichotomised as “Low physical activity” (nil and low) and “High physical activity” (moderate and high).
Illicit drug use
Women born 1989 to 1995 and 1973 to 1978 were defined as having recent illicit drug use if they indicated that they had used illicit drugs in the last 12 months in response to the questions “Have you tried marijuana/cannabis?”, “Have you tried any other illicit drugs?” or “In the last 12 months how often did you use marijuana/cannabis for recreational use?” Illicit drug use was not measured among women born 1946 to 1951.
Physical health
Self-rated general health
Women in each cohort at each survey were asked “In general, would you say your health is?” with the possible responses: “Excellent”, “Very good”, “Good”, “Fair” or “Poor” (Ware & Sherbourne, 1992). In Chapter 5, these responses were then dichotomised to create an indicator variable for women who reported “Fair” or “Poor” health.
Number of physical conditions
The number of physical conditions was dichotomised as multimorbidity (yes/no), which was defined as two or more chronic conditions. The conditions measured varied by cohort. The list of physical conditions included for each cohort was selected to maximise measurement consistency across the longitudinal surveys and is tailored to the age of the cohort. Women born 1989 to 1995 were treated as having multimorbidity if they had two or more of the following conditions: diabetes, asthma, endometriosis and polycystic ovarian syndrome. Women born 1973 to 1978 were treated as having multimorbidity if they had two or more of the following conditions: diabetes, heart disease, non-gestational hypertension, asthma, cancer (excluding skin cancer) and endometriosis. Women born 1946 to 1951 were treated as having multimorbidity if they had two or more of the following conditions: diabetes, heart disease, non-gestational hypertension, stroke, thrombosis, asthma,osteoporosis, cancer (excluding skin cancer) and arthritis.
Bodily pain
Bodily pain was measured using the question “How much bodily pain have you had during the past four weeks?”, with response options on a six-point scale from “None” to “Very severe”, and the question “During the past four weeks, how much did pain interfere with your normal work (including both work outside the home and housework)?”, with response options on a five-point scale from “Not at all” to “Extremely” (Ware & Sherbourne, 1992). Women who responded to the first question with “Severe” or “Very severe” and women who responded to the second question with “Quite a bit” or “Extremely” were classified as having “High bodily pain”. Women who selected other response options were classified as having “Low bodily pain”.
Sexually transmitted infections
Women were classified as having had a recent sexually transmitted infection (STI) if they reported having recently had any of the following STIs: chlamydia, genital herpes, genital warts, HIV or AIDS, hepatitis B or C, gonorrhoea or other unspecified STI. There was some variation between cohorts and surveys as to which STI options could be selected.
Mental health
Depression
Women were classified as having recently experienced depression if they indicated that they had been diagnosed with or treated for depression in the last 12 months (for women born 1989 to 1995) or in the last three years (for women born 1973 to 1978 and 1946 to 1951). The different time intervals align with the timing of survey deployment within each cohort.
Anxiety
Women were classified as having recently experienced anxiety if they indicated that they had been diagnosed with or treated for anxiety in the last 12 months (for women born 1989 to 1995) or in the last three years (for women born 1973 to 1978 and 1946 to 1951).
Perceived stress
Perceived stress was measured in all three groups of women at each survey using the question “Over the last 12 months, how stressed have you felt about the following areas of your life?” for 10 to 12 domains (depending on the cohort and survey), such as “Own health”, “Work/employment” and “Relationships with partner/spouse”. Responses were recorded on a five-point scale from “Not stressed at all” to “Extremely stressed”. The mean of the multi-item summed score for perceived stress was calculated and then dichotomised as either “None/minimal” (score ≤1) or “Moderate/high” (score >1 and ≤4; Harris et al., 2013).
Psychological distress
Psychological distress was measured among women born 1989 to 1995 using the Kessler Psychological Distress Scale (K10; Kessler et al., 2002). Women were asked 10 questions about their psychological distress over the last four weeks such as “How often did you feel depressed?” and “How often did you feel tired for no good reason?” Responses were recorded on a five-point scale from “None of the time” to “All of the time”. These responses were summed to generate an overall score between 10 and 50. Total scores were then dichotomised as “Low/moderate” (score <22) or “High/very high” (score ≥22; Australian Bureau of Statistics, 2012). Psychological distress was not measured longitudinally among women born 1973 to 1978 and 1946 to 1951.
Satisfaction with general practitioner services
Data about general practitioner services and satisfaction (Fitzgerald, 2022) was analysed for women born 1973 to 1978. Women were asked five questions about their satisfaction with general practitioner services, including items such as “The doctor’s explanation of your problem and treatment” and “The doctor’s interest in how you felt about having the tests, treatment or the advice given”. Responses were recorded on a five-point scale from “Poor” to “Excellent”. The average score was calculated for women who answered at least three of the five items and this value was subtracted from six to give the final score. Higher scores indicate higher satisfaction. Scores were then dichotomised, with the bottom 20 per cent of general practitioner satisfaction scores at each survey treated as “Dissatisfied” and “Not dissatisfied” otherwise.
Costs of health services
Costs of health services were analysed in Chapter 6 using MBS and PBS data. Costs were aggregated according to financial year (1 July to 30 June). Costs presented are the benefit paid by government (if any). MBS services between 1 July 1996 and 30 June 2020 were analysed. Complete data on drugs available below the co-payment threshold first became available on 1 April 2012 (Australian Government Department of Health, 2019). Consequently, PBS services between 1 July 2012 and 30 June 2020 were analysed.
All values were presented in Australian dollars and were unadjusted for inflation. Private medication scripts were not included in the PBS datasets analysed. Average costs presented were among women who had at least one service of that type. For example, the average cost of psychoactive medications in the 2019 to 2020 financial year was the average of the costs of psychoactive medications among women who had at least one psychoactive medication in the 2019 to 2020 financial year (i.e. women with zero cost were excluded from the calculation of the average).
Throughout Chapter 6, mean values were presented rather than median values to simplify the interpretation. However, it should be noted that the distribution of annual costs in the MBS and PBS was right-skewed and so the mean was not always similar to the median. The impact is negligible for the overall interpretation of our findings, as similar conclusions would have been made if using means or medians (i.e. is there an effect of sexual violence on healthcare costs).
Social support
Social support was measured using the Medical Outcomes Study social support survey (Sherbourne & Stewart, 1991), which has the question stem “How often is each of the following kind[s] of support available to you if you need it?” and then items such as “Someone to help you if you are confined to bed” and “Someone to give you good advice about a crisis”, with five Likert-scale response options ranging from “None of the time” to “All of the time”. Responses to these items were used to calculate subscale scores for tangible or physical assistance, affection and social interaction, and emotional support and guidance.
Improvement in mental health
In Chapter 7, we examined the association between use of mental health services and reported improvements in mental health. An improvement in mental health over time was defined according to the recommendation for a minimal important difference of half a standard deviation (Norman et al., 2003). Using our data, half a standard deviation corresponded to four units on the K10 scale (1989 to 1995 cohort) and 10 units on the SF-36 MHI-5 scale (1973 to 1978 and 1946 to 1951 cohorts).
Mental health consultations
Participants were asked “Have you consulted the following services for your own health in the last 12 months?”, which included an item for “A counsellor or other mental health worker”. There were some slight variations in the wording of this question between surveys.
Analysis strategy
Descriptive statistics (counts or percentages) were presented, often using figures to illustrate groups. The Poisson approximation to log-binomial regression models was used in Chapters 2, 3, 4, 5 and 7 to estimate risk ratios with corresponding 95 per cent confidence intervals (Zou, 2004). The models were constructed using the outcome and exposure of interest for each model and a set of pre-specified sociodemographic covariates.
Each model (unless otherwise stated) was controlled for whether the participant was from a CALD background, age (as a continuous variable), area of residence, highest qualification, relationship status, ability to manage on available income (as a surrogate measure of socioeconomic status) and the effect of time (time in years since first survey for each cohort, as a continuous variable).
The longitudinal models presented in Chapter 6 were generalised linear models with a gamma distribution and a logarithmic link function that accounted for correlated observations within the same individual by treating participant ID as a random effect. The effect estimates presented in the same chapter were not adjusted for any covariates.
All analyses were conducted in Stata 15. Confidence intervals were established using standard methods provided by modelling procedures in Stata.
Results
Please note that causation should not be inferred for associations found in the results presented below.
Chapter 1:
Prevalence of sexual violence
Lifetime sexual violence
More than half (51%) of women born in 1989 to 1995 indicated that they had experienced sexual violence in their lifetime by the time they were aged 24 to 30.
One third (34%) of women born in 1973 to 1978 reported that they had experienced sexual violence in their lifetime by the time they were aged 40 to 45.
One quarter (26%) of women born in 1946 to 1951 reported that they had experienced sexual violence in their lifetime by the time they were aged 68 to 73.
Figure 1: Prevalence of any sexual violence (including sexual violence during childhood) over time
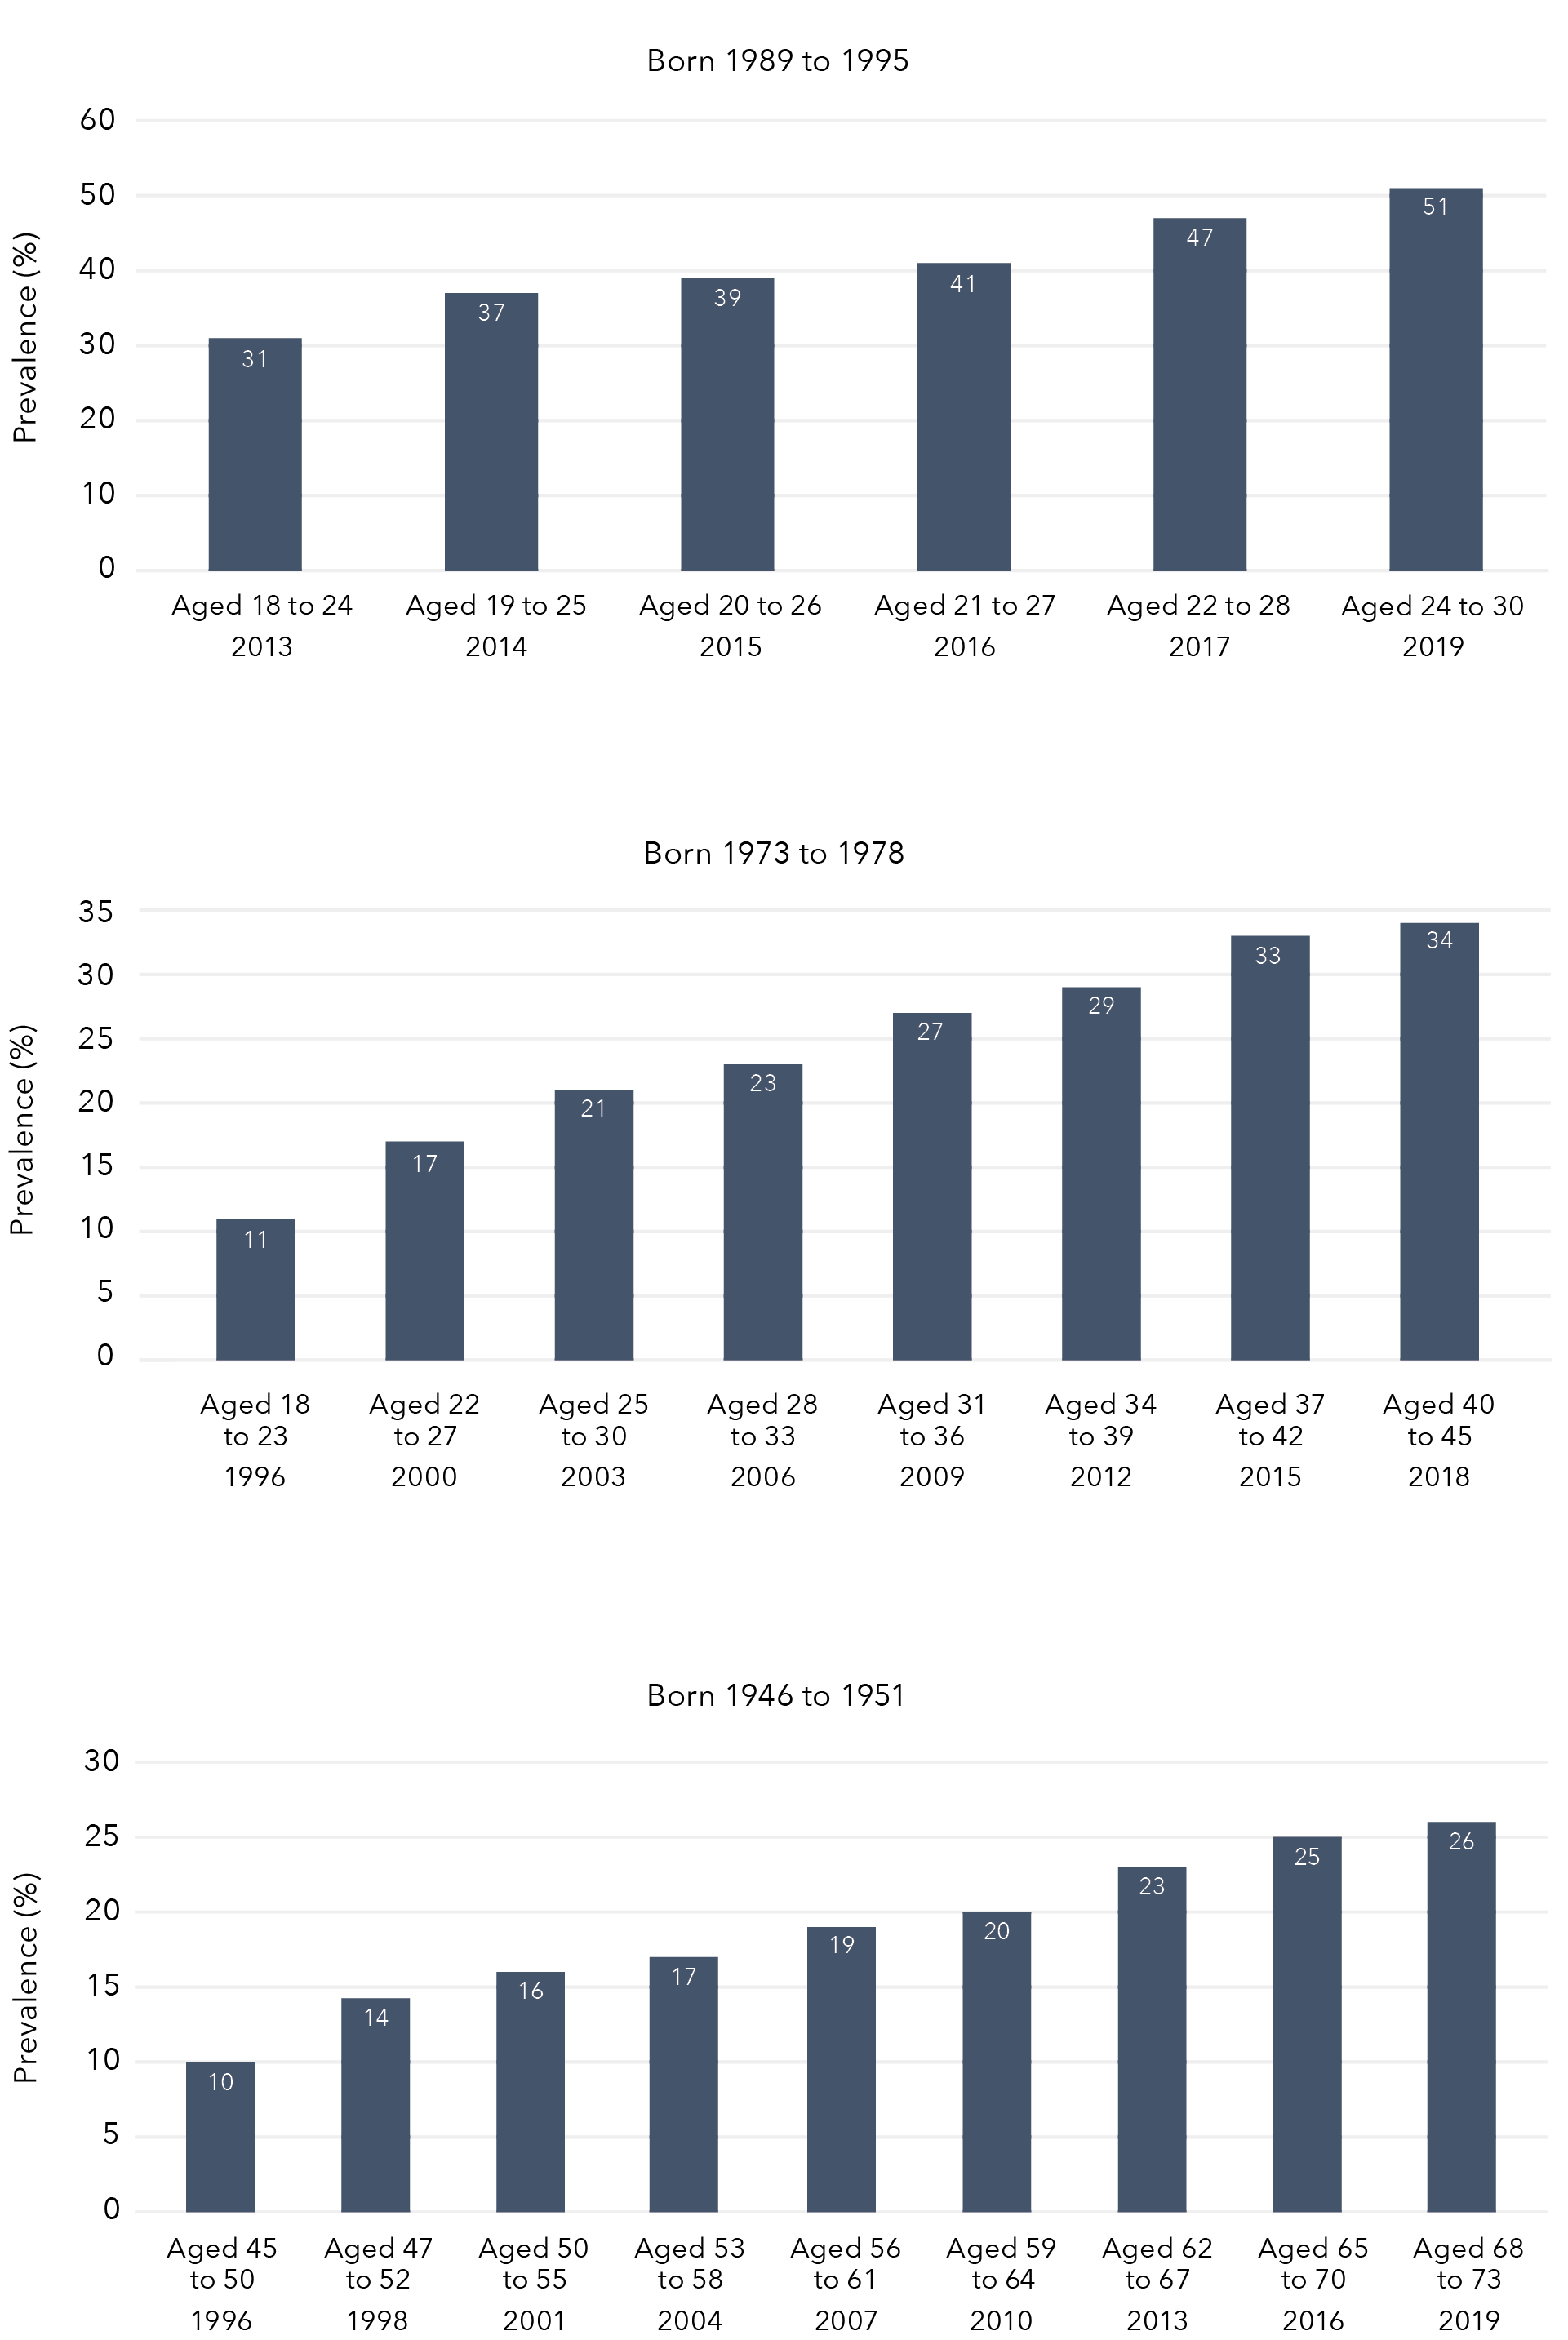
Data table for figure 1
Born 1989 to 1995
Year
Prevalence
Aged 18 to 24 2013
31%
Aged 19 to 25 2014
37%
Aged 20 to 26 2015
39%
Aged 21 to 27 2016
41%
Aged 22 to 28 2017
47%
Aged 24 to 30 2019
51%
Born 1973 to 1978
Year
Prevalence
Aged 18 to 23 1996
11%
Aged 22 to 27 2000
17%
Aged 25 to 30 2003
21%
Aged 28 to 33 2006
23%
Aged 31 to 36 2009
27%
Aged 34 to 39 2012
29%
Aged 37 to 42 2015
33%
Aged 40 to 45 2018
34%
Born 1946 to 1951
Year
Prevalence
Aged 45 to 50 1996
10%
Aged 47 to 52 1998
14%
Aged 50 to 55 2001
16%
Aged 53 to 58 2004
17%
Aged 56 to 61 2007
19%
Aged 59 to 64 2010
20%
Aged 62 to 67 2013
23%
Aged 65 to 70 2016
25%
Aged 68 to 73 2019
26%
Sexual violence during childhood
Across the three cohorts, 13 per cent of women reported experiencing sexual violence during childhood perpetrated by an adult or person at least five years older:
- One in eight (12%) women reported being touched or fondled in a sexual way.
- Six per cent reported touching someone else’s body in a sexual way.
- Four per cent reported that someone attempted to have intercourse with them as a child.
- Three per cent reported that someone had intercourse with them as a child.
One in eight (12%) women born in 1989 to 1995 reported sexual violence during their childhood. Approximately 15 per cent of women born in 1973 to 1978 reported sexual violence during childhood. One in seven (14%) women born in 1946 to 1951 indicated that they had experienced childhood sexual violence. Results for particular acts of childhood sexual violence by cohort are summarised in Table 4. The most common form of childhood sexual violence across all cohorts was being touched or fondled in a sexual way, with oral, anal or vaginal intercourse being the least common.
Table 4: Sexual violence during childhood among Australian women born in 1989 to 1995 (N=10,816), 1973 to 1978 (N=7,186) and 1946 to 1951 (N=8,622)
Childhood sexual violence
Women born 1989 to 1995
N
Women born 1989 to 1995
% (95% CI)
Women born 1973 to 1978
N
Women born 1973 to 1978
% (95% CI)
Women born 1946 to 1951
N
Women born 1946 to 1951
% (95% CI)
Any childhood sexual violence
1,312
12.1 (11.5, 12.7)
1,070
14.9 (14.1, 15.7)
1,206
14.0 (13.3, 14.7)
Did an adult or person at least 5 years older ever touch or fondle you in a sexual way?
1,182
10.9 (10.3, 11.5)
993
13.8 (13.0, 14.6)
1,098
12.7 (12.0, 13.4)
Did an adult or person at least 5 years older ever have you touch their body in a sexual way?
626
5.8 (5.3, 6.2)
505
7.0 (6.4, 7.6)
435
5.1 (4.6, 5.5)
Did an adult or person at least 5 years older attempt oral, anal or vaginal intercourse with you?
499
4.6 (4.2, 5.0)
330
4.6 (4.1, 5.1)
340
3.9 (3.5, 4.4)
Did an adult or person at least 5 years older actually have oral, anal or vaginal intercourse with you?
439
4.1 (3.7, 4.4)
244
3.4 (3.0, 3.8)
233
2.7 (2.4, 3.0)
Sexual violence by a partner
1989 to 1995 cohort
When aged 18 to 24 years in 2013, 15 per cent of women reported that they had experienced sexual violence by a partner (Figure 2). Six years later, in 2019, this had increased to 33 per cent of women who were then aged 24 to 30.
Figure 2: Lifetime prevalence of sexual violence by a partner among Australian women born in 1989 to 1995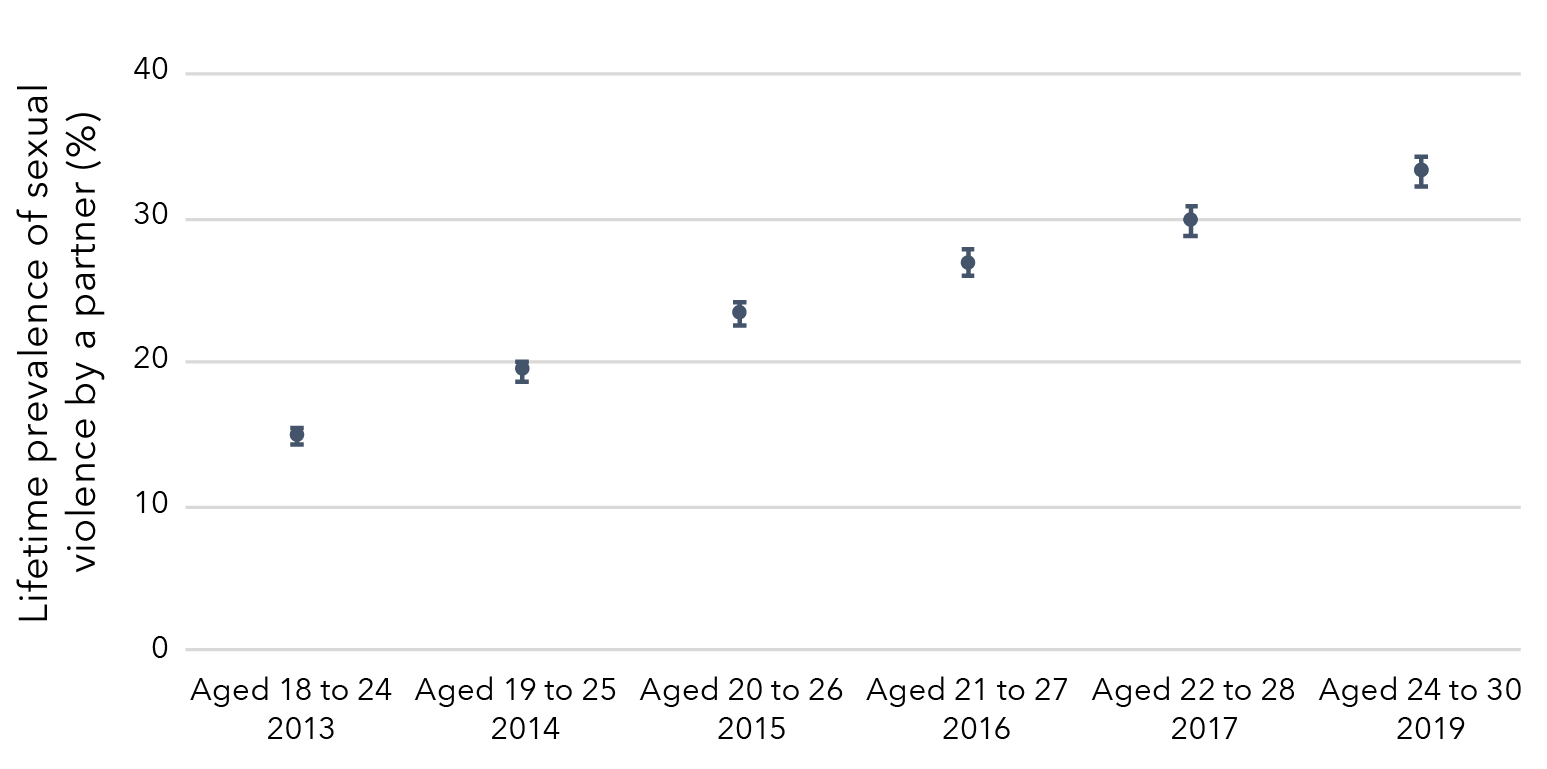
Data table for figure 2
Survey Cohort Prevalence Lower limit Upper limit Aged 18 to 24
(2013) Born 1989 to 1995 14.80% 14.26% 15.33% Aged 19 to 25
(2014) Born 1989 to 1995 19.37% 18.64% 20.09% Aged 20 to 26
(2015) Born 1989 to 1995 23.32% 22.45% 24.20% Aged 21 to 27
(2016) Born 1989 to 1995 26.81% 25.90% 27.73% Aged 22 to 28
(2017) Born 1989 to 1995 29.82% 28.84% 30.79% Aged 24 to 30
(2019) Born 1989 to 1995 33.29% 32.27% 34.30%
1973 to 1978 cohort
The lifetime prevalence of sexual violence by a partner among women born in 1973 to 1978 increased from 1 per cent when women were aged 28 to 33 in 2006 to 14 per cent when aged 40 to 45 in 2018 (Figure 3).
Figure 3: Lifetime prevalence of sexual violence by a partner among Australian women born in 1973 to 1978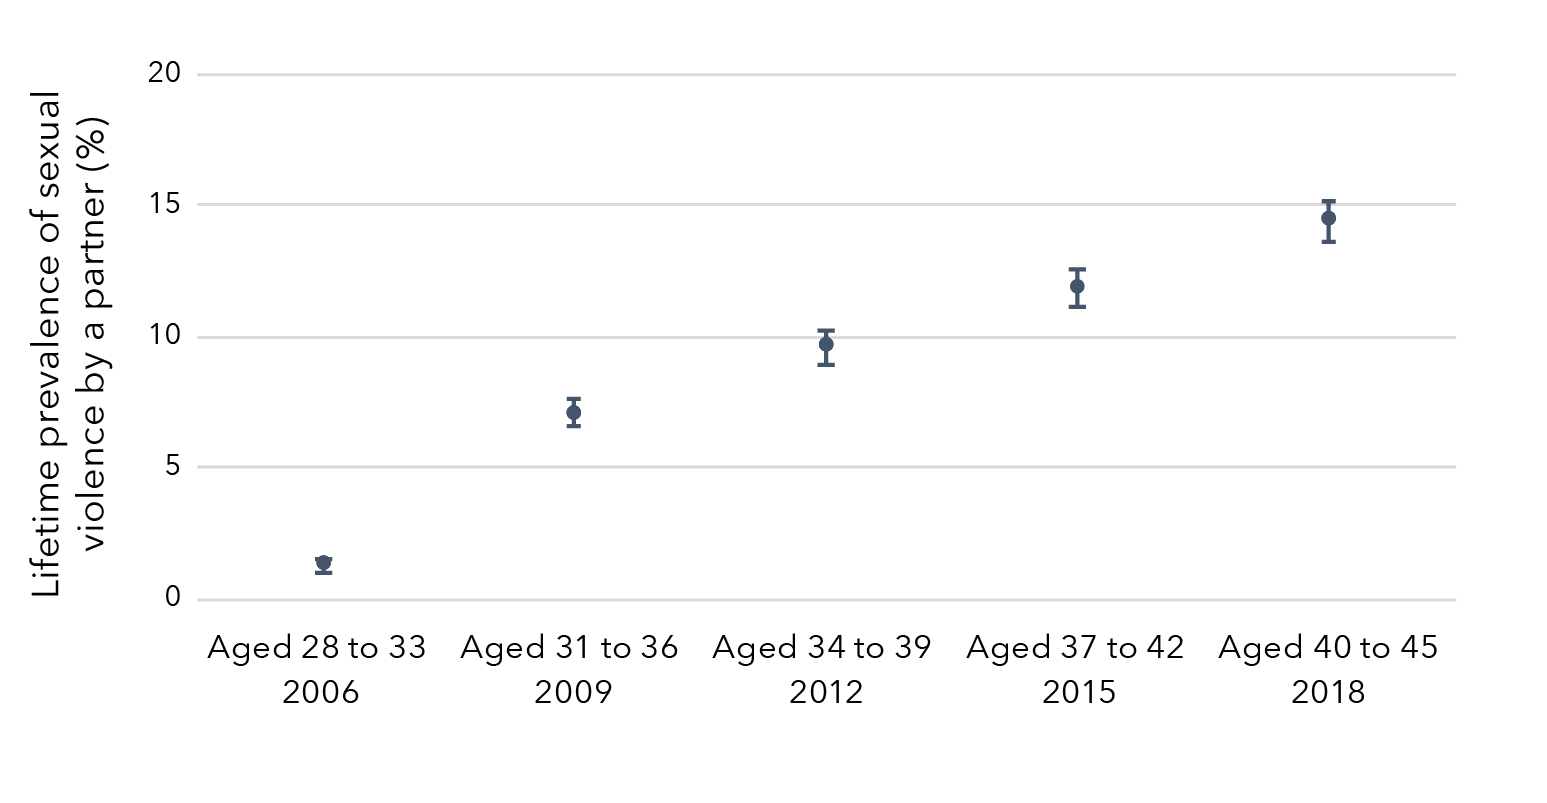
Data table for figure 3
Survey Cohort Prevalence Lower limit Upper limit Aged 28 to 33
(2006) Born 1973 to 1978 1.29% 1.06% 1.52% Aged 31 to 36
(2009) Born 1973 to 1978 7.11% 6.55% 7.67% Aged 34 to 39
(2012) Born 1973 to 1978 9.61% 8.97% 10.26% Aged 37 to 42
(2015) Born 1973 to 1978 11.90% 11.15% 12.65% Aged 40 to 45
(2018) Born 1973 to 1978 14.44% 13.62% 15.25%
Sexual violence during adulthood [4]
1989 to 1995 cohort
Approximately one in five women (18%) aged 18 to 24 in 2013 had experienced sexual violence in adulthood (Figure 4). This prevalence increased over time to 39 per cent in 2019 when women were aged 24 to 30.
Figure 4: Prevalence of sexual violence experienced during adulthood among women born in 1989 to 1995
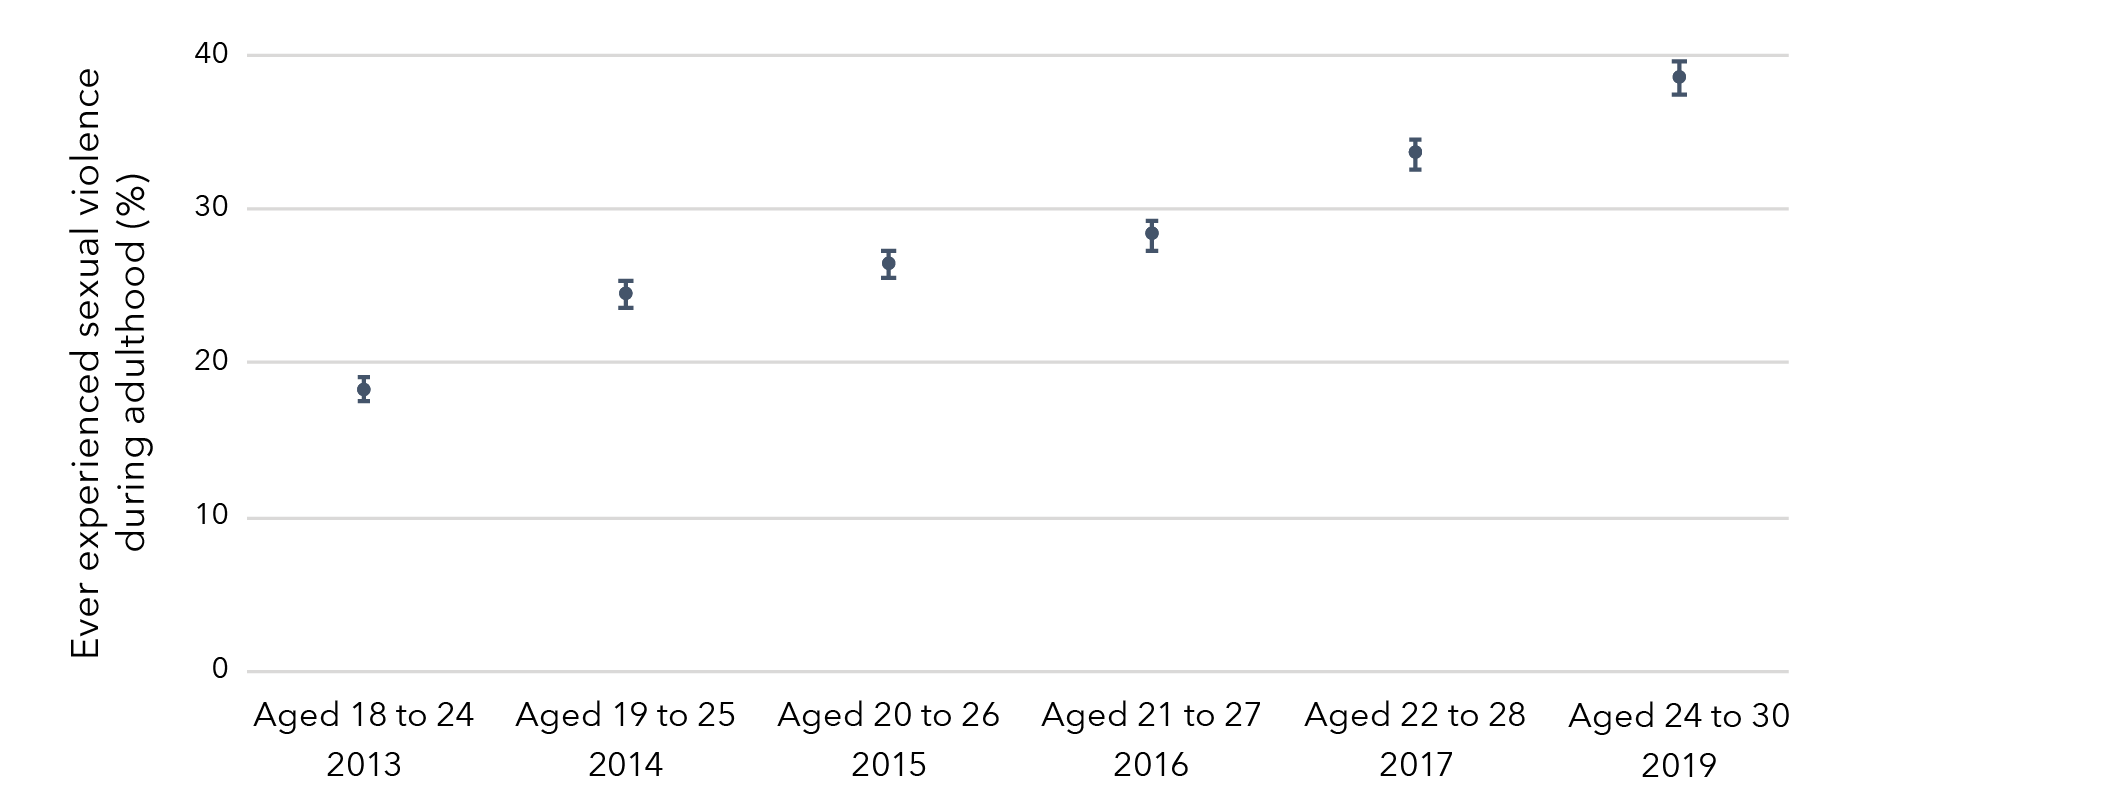
Data table for figure 4
Survey
Cohort Prevalence Lower limit Upper limit Aged 18 to 24
(2013) Born 1989 to 1995 18.32% 17.59% 19.05% Aged 19 to 25
(2014) Born 1989 to 1995 24.43% 23.55% 25.31% Aged 20 to 26
(2015) Born 1989 to 1995 26.40% 25.49% 27.32% Aged 21 to 27
(2016) Born 1989 to 1995 28.36% 27.38% 29.33% Aged 22 to 28
(2017) Born 1989 to 1995 33.55% 32.54% 34.55% Aged 24 to 30
(2019) Born 1989 to 1995 38.51% 37.41% 39.60%
1973 to 1978 cohort
The prevalence of sexual violence experienced during adulthood among women born in 1973 to 1978 increased over time from 2 per cent when aged 18 to 23 in 1996 to 18 per cent when aged 40 to 45 in 2018 (Figure 5).
Figure 5: Prevalence of sexual violence experienced during adulthood among women born in 1973 to 1978
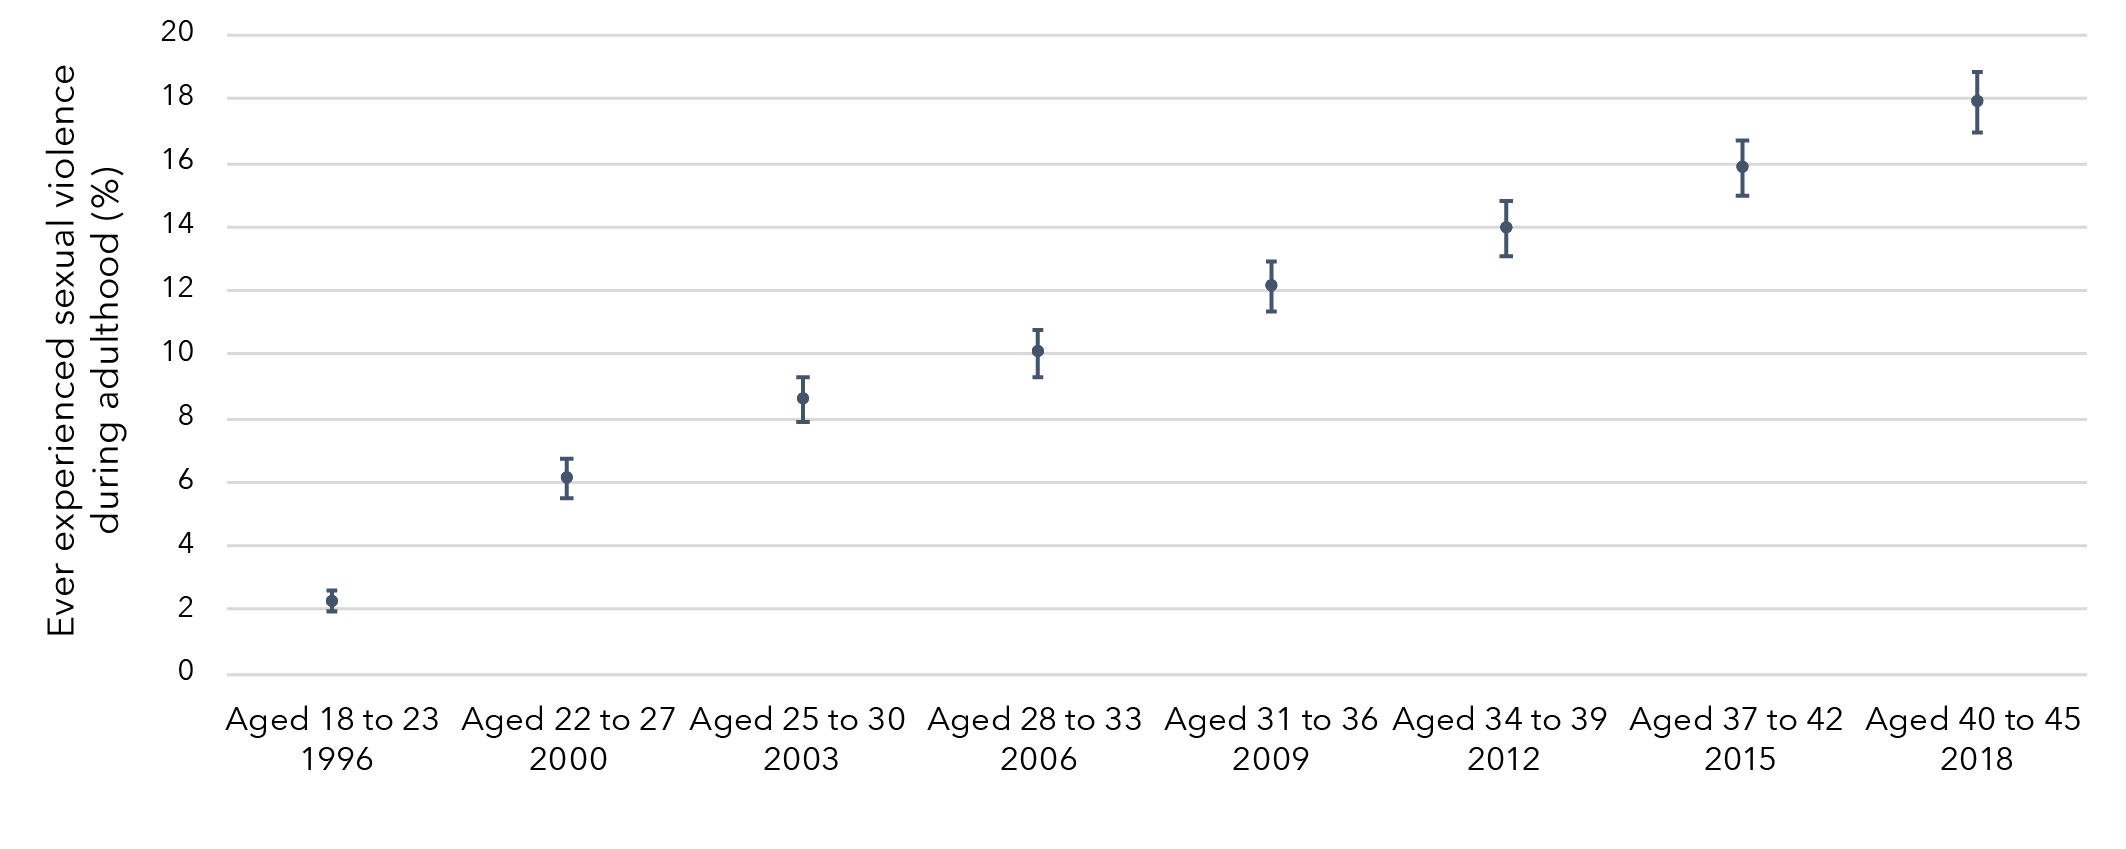
Data table for figure 5:
Survey Cohort Prevalence Lower limit Upper limit Aged 18 to 23
(1996) Born 1973 to 1978 2.28% 1.94% 2.63% Aged 22 to 27
(2000) Born 1973 to 1978 6.14% 5.54% 6.74% Aged 25 to 30
(2003) Born 1973 to 1978 8.58% 7.87% 9.28% Aged 28 to 33
(2006) Born 1973 to 1978 10.06% 9.32% 10.80% Aged 31 to 36
(2009) Born 1973 to 1978 12.14% 11.33% 12.94% Aged 34 to 39
(2012) Born 1973 to 1978 13.95% 13.11% 14.79% Aged 37 to 42
(2015) Born 1973 to 1978 15.82% 14.98% 16.67% Aged 40 to 45
(2018) Born 1973 to 1978 17.90% 16.94% 18.85%
1946 to 1951 cohort
The prevalence of sexual violence experienced during adulthood among women born in 1946 to 1951 increased over time from 1 per cent when aged 45 to 50 in 1996 to 12 per cent when aged 68 to 73 in 2019 (Figure 6).
Figure 6: Prevalence of sexual violence experienced during adulthood among women born in 1946 to 1951
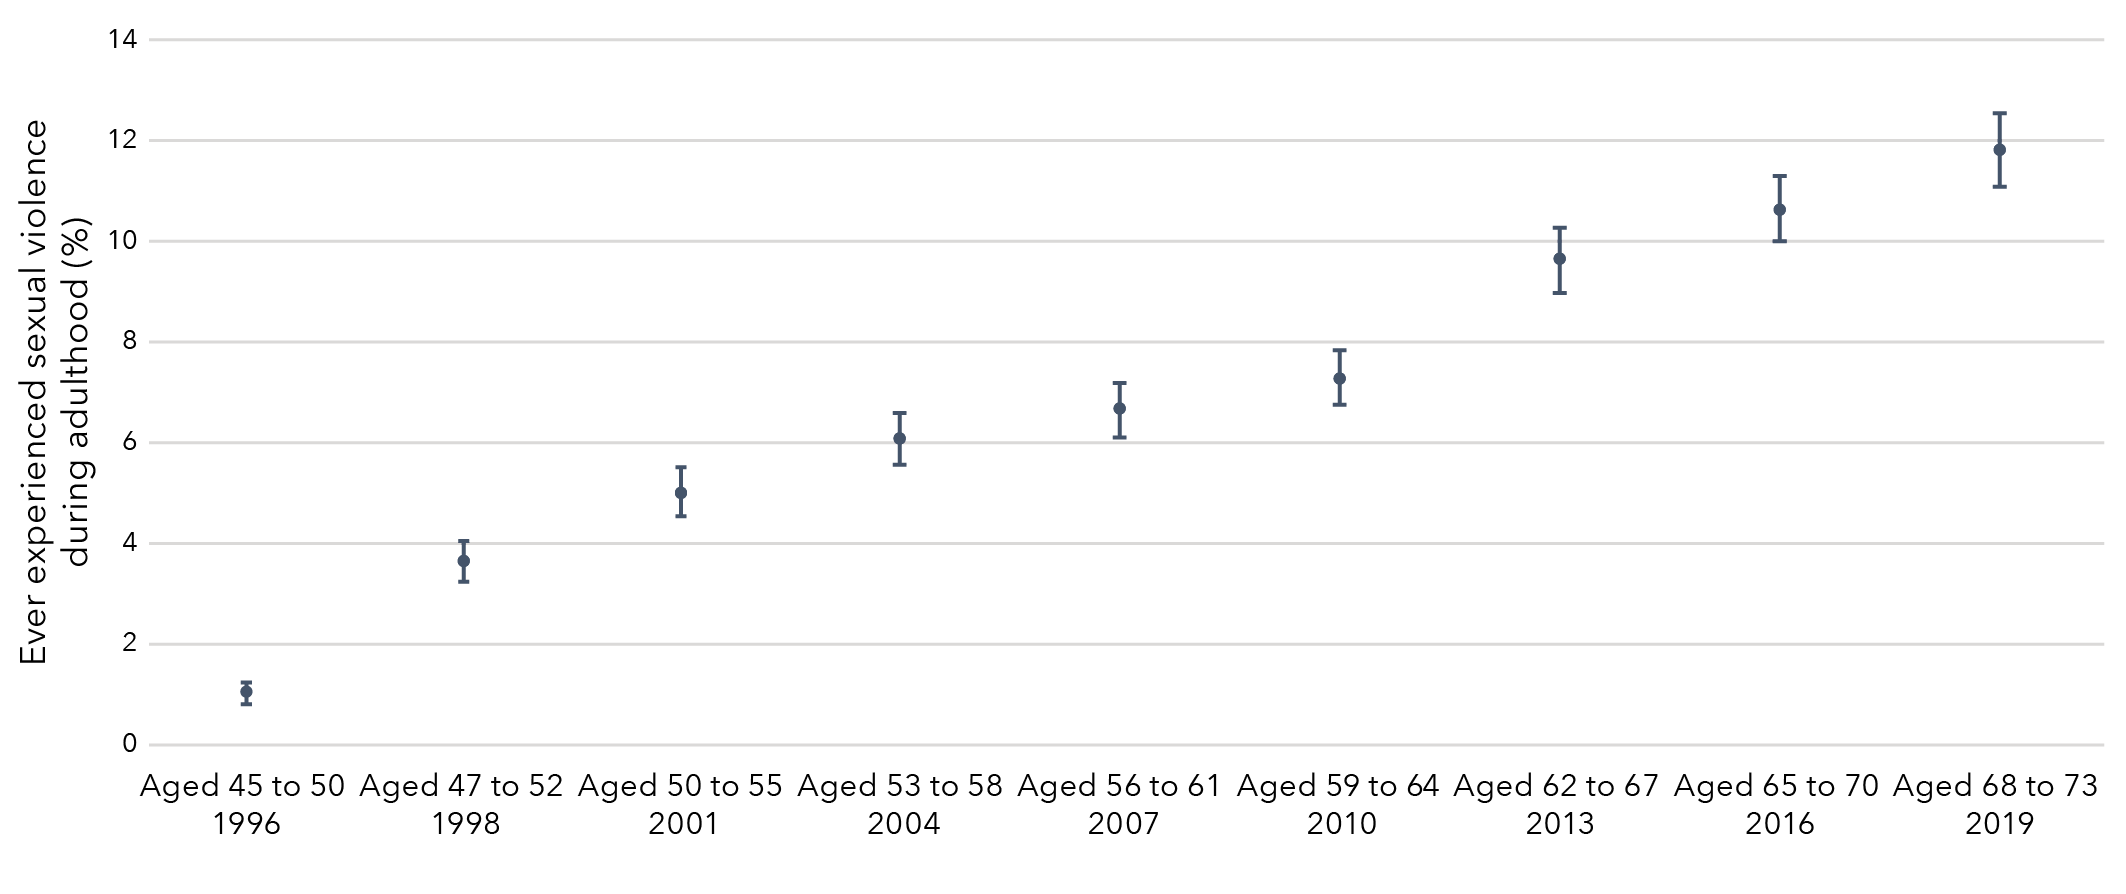
Data table for figure 6:
Survey Cohort Prevalence Lower limit Upper limit Aged 45 to 50
(1996) Born 1946 to 1951 1.06% 0.84% 1.27% Aged 47 to 52
(1998) Born 1946 to 1951 3.65% 3.24% 4.05% Aged 50 to 55
(2001) Born 1946 to 1951 5.04% 4.56% 5.51% Aged 53 to 58
(2004) Born 1946 to 1951 6.09% 5.57% 6.61% Aged 56 to 61
(2007) Born 1946 to 1951 6.69% 6.15% 7.23% Aged 59 to 64
(2010) Born 1946 to 1951 7.31% 6.75% 7.87% Aged 62 to 67
(2013) Born 1946 to 1951 9.66% 9.01% 10.30% Aged 65 to 70
(2016) Born 1946 to 1951 10.65% 10.00% 11.30% Aged 68 to 73
(2019) Born 1946 to 1951 11.84% 11.10% 12.57%
Recent sexual violence
Recent sexual violence is defined as sexual violence that occurred in the 12 months prior to the survey.
1989 to 1995 cohort
The prevalence of recent sexual violence among women born in 1989 to 1995 varied from 4 per cent to 6 per cent over the study period (Figure 7).
Figure 7: Prevalence of recent sexual violence among women born in 1989 to 1995
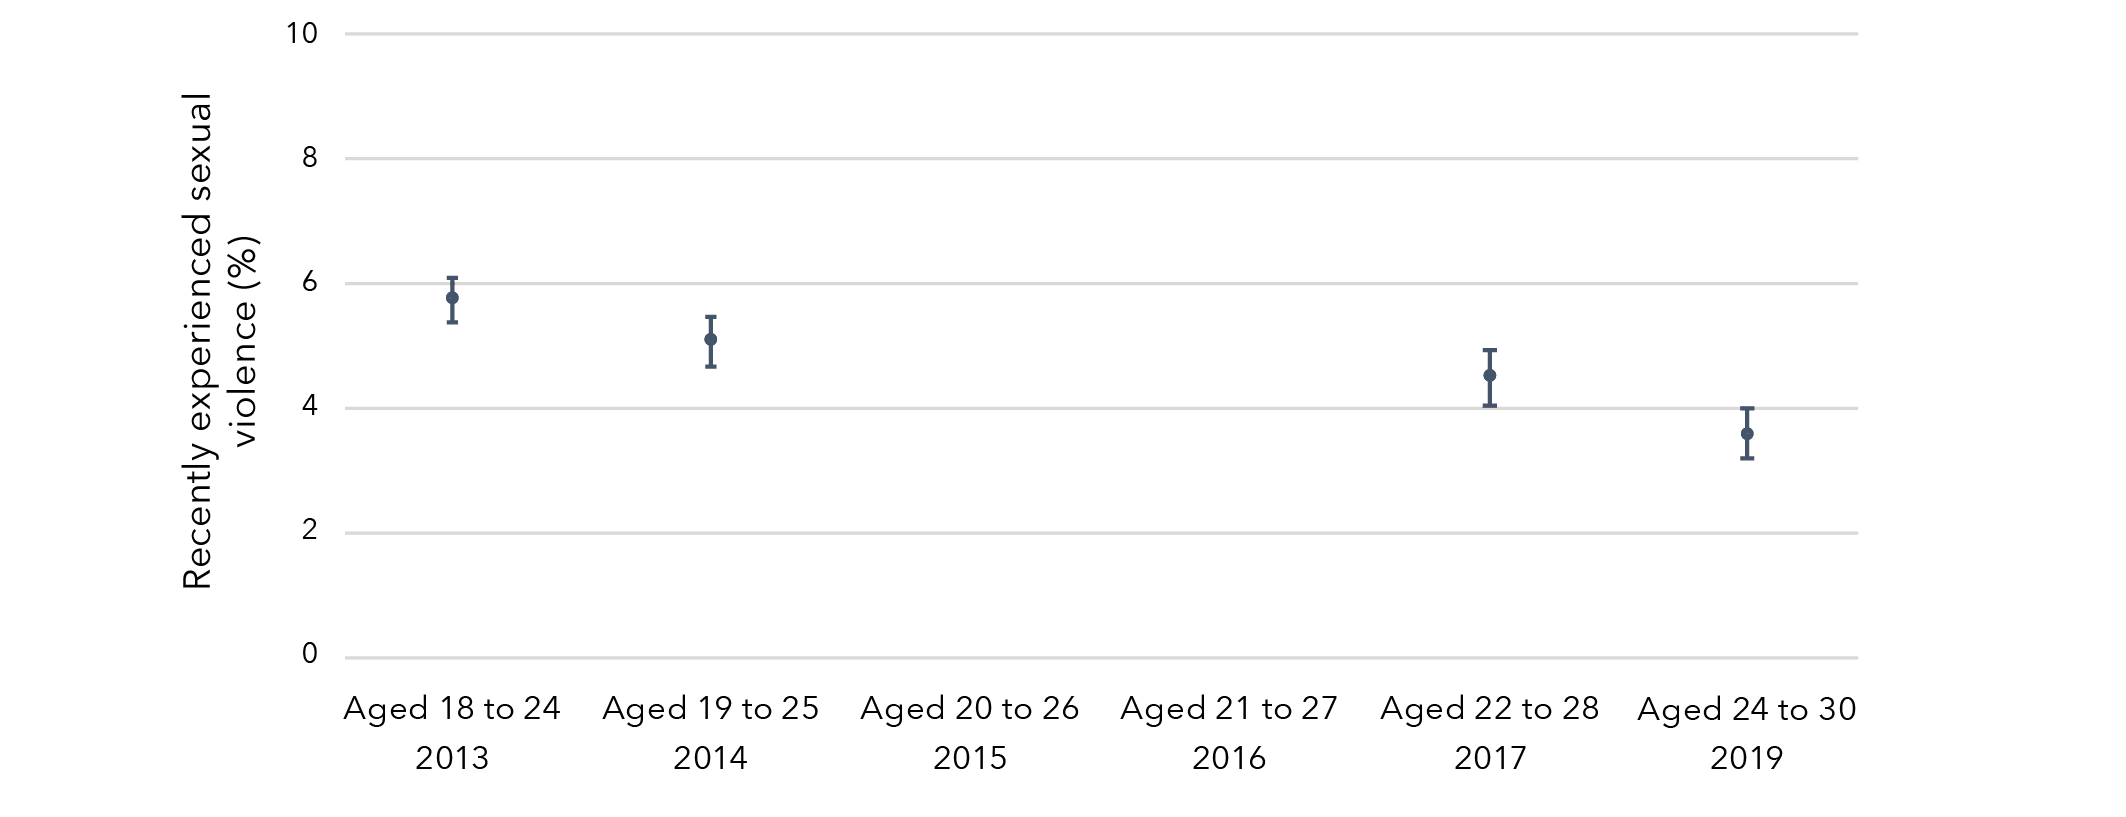
Note: Consistently measured recent sexual violence data were not available in 2015 and 2016 (Surveys 3 and 4).
Data table for figure 7:
Survey Cohort Prevalence Lower limit Upper limit Aged 18 to 24
(2013) Born 1989 to 1995 5.74% 5.39% 6.09% Aged 19 to 25
(2014) Born 1989 to 1995 5.07% 4.67% 5.47% Aged 20 to 26
(2015) Born 1989 to 1995 No data No data No data Aged 21 to 27
(2016) Born 1989 to 1995 No data No data No data Aged 22 to 28
(2017) Born 1989 to 1995 4.50% 4.06% 4.94% Aged 24 to 30
(2019) Born 1989 to 1995 3.58% 3.18% 3.98%
1973 to 1978 cohort
The prevalence of recent sexual violence among women born in 1973 to 1978 varied slightly over time, from 4 per cent when aged 18 to 23 in 1996 to 1 per cent when aged 22 to 27 in 2000, remaining relatively constant thereafter (Figure 8).
Figure 8: Prevalence of recent sexual violence among women born in 1973 to 1978
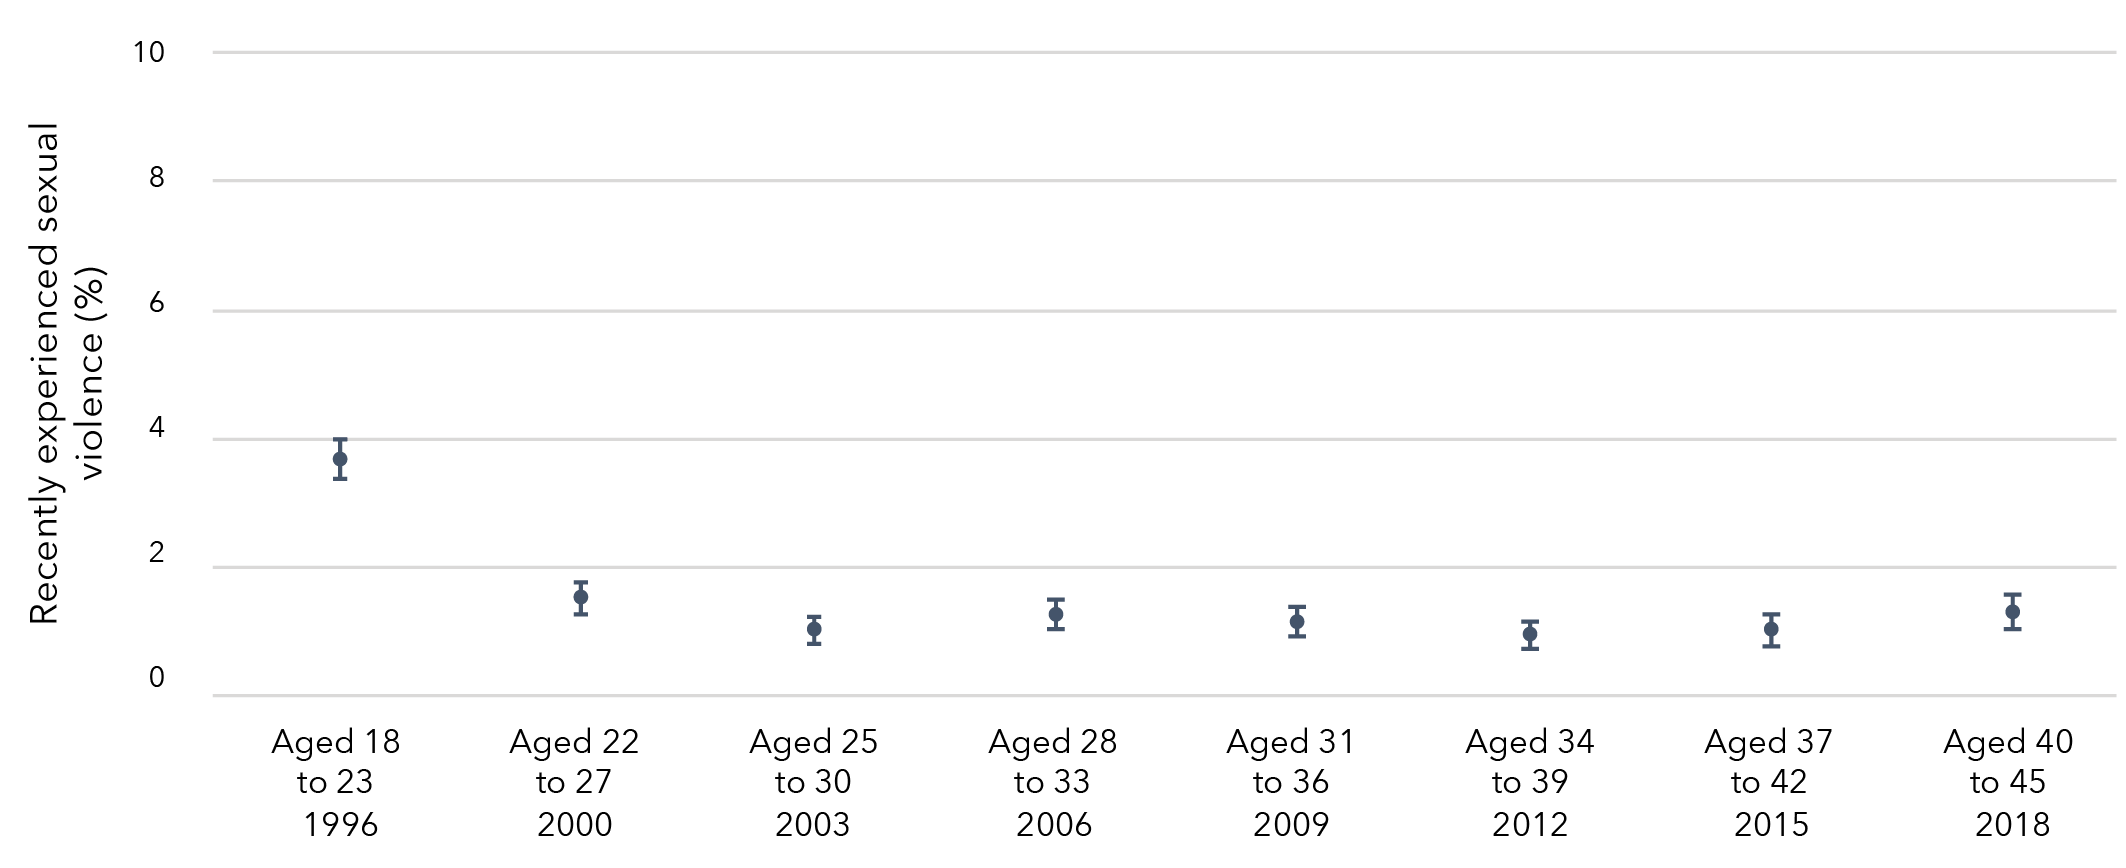
Data table for figure 8:
Survey Cohort Prevalence Lower limit Upper limit Aged 18 to 23
(1996) Born 1973 to 1978 3.68% 3.37% 3.99% Aged 22 to 27
(2000) Born 1973 to 1978 1.53% 1.28% 1.77% Aged 25 to 30
(2003) Born 1973 to 1978 1.04% 0.83% 1.24% Aged 28 to 33
(2006) Born 1973 to 1978 1.27% 1.04% 1.50% Aged 31 to 36
(2009) Born 1973 to 1978 1.16% 0.93% 1.39% Aged 34 to 39
(2012) Born 1973 to 1978 0.95% 0.74% 1.16% Aged 37 to 42
(2015) Born 1973 to 1978 1.03% 0.80% 1.26% Aged 40 to 45
(2018) Born 1973 to 1978 1.31% 1.04% 1.57%
1946 to 1951 cohort
The prevalence of recent sexual violence among women born in 1946 to 1951 was reasonably consistent, with less than 2 per cent of women in this cohort reporting recent sexual violence over the study period (Figure 9).
Figure 9: Prevalence of recent sexual violence among women born in 1946 to 1951
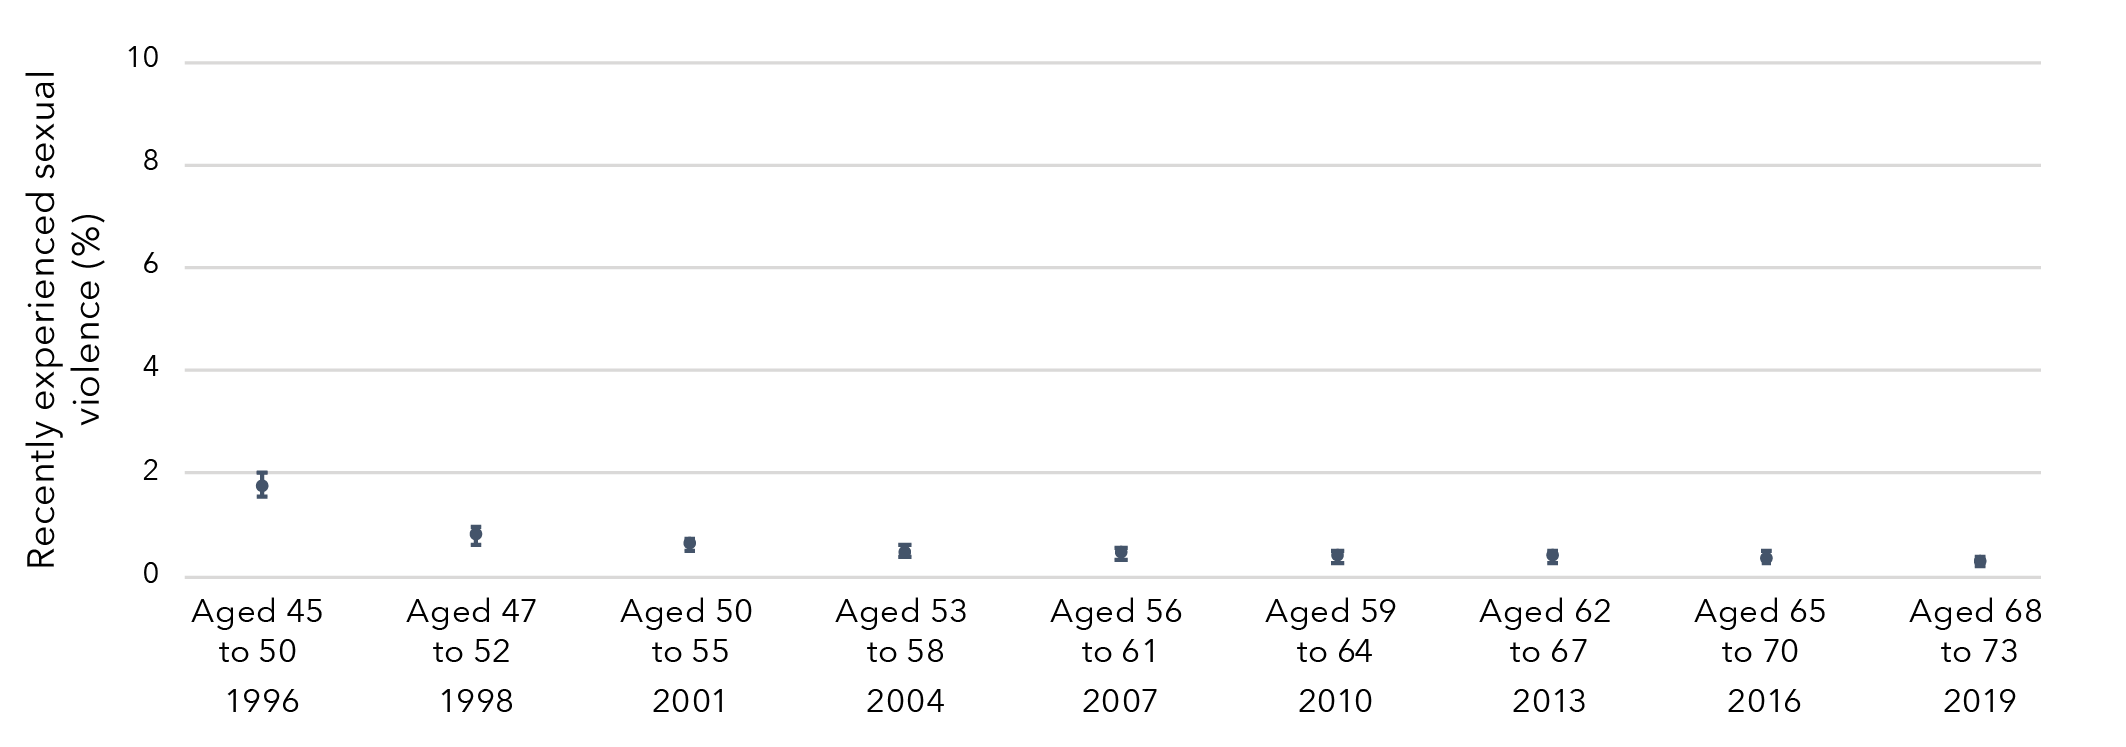
Data table for figure 9:
Survey Cohort Prevalence Lower limit Upper limit Aged 45 to 50
(1996) Born 1946 to 1951 1.75% 1.53% 1.97% Aged 47 to 52
(1998) Born 1946 to 1951 0.75% 0.60% 0.91% Aged 50 to 55
(2001) Born 1946 to 1951 0.58% 0.44% 0.72% Aged 53 to 58
(2004) Born 1946 to 1951 0.44% 0.32% 0.56% Aged 56 to 61
(2007) Born 1946 to 1951 0.41% 0.29% 0.54% Aged 59 to 64
(2010) Born 1946 to 1951 0.35% 0.23% 0.47% Aged 62 to 67
(2013) Born 1946 to 1951 0.35% 0.23% 0.47% Aged 65 to 70
(2016) Born 1946 to 1951 0.34% 0.21% 0.46% Aged 68 to 73
(2019) Born 1946 to 1951 0.25% 0.14% 0.36%
Priority populations
Sexual identification
Three in four (76%) women aged 24 to 30 who identified as bisexual reported that they had experienced sexual violence in their lifetime (Table 5). Around one in two women aged 24 to 30 who identified as mainly or exclusively heterosexual (48%) and those who identified as mainly or exclusively lesbian (55%) reported that they had experienced sexual violence in their lifetime.
Three in five (60%) women aged 40 to 45 who identified as bisexual reported that they had experienced sexual violence in their lifetime, however caution should be used in interpreting this result due to the low frequency of women who identified as bisexual in this age group. One in three (34%) women aged 40 to 45 who identified as mainly or exclusively heterosexual and two in five (42%) of those who identified as mainly or exclusively lesbian reported that they had experienced sexual violence in their lifetime.
One in four (26%) women aged 68 to 73 who identified as mainly or exclusively heterosexual and one in two (49%) of those who identified as mainly or exclusively lesbian reported that they had experienced sexual violence in their lifetime. Very few women in this age group identified as bisexual.
Cultural and linguistic diversity
There were few differences in the prevalence of sexual violence between women from CALD backgrounds and those who were not from CALD backgrounds (Table 5).[5]
Disability or illness
Three in four (73%) women aged 24 to 30 with disability or illness reported that they had experienced sexual violence, compared to one in two (51%) women without disability or illness (Table 5). Among women aged 40 to 45, 55 per cent of women with disability or illness reported that they had experienced sexual violence compared to 34 per cent of women without disability or illness. Among women aged 68 to 73, 34 per cent of those with disability or illness reported that they had experienced sexual violence compared to 26 per cent of women without disability or illness.
Area of residence
There were few differences in the prevalence of sexual violence by area of residence (major cities, inner regional areas and outer regional, remote or very remote areas; Table 5).
Table 5: Prevalence of any sexual violence among Australian women aged 24 to 30, 40 to 45 and 68 to 73 at most recent survey, by priority populations
Sexual identification
Women born 1989 to 1995
Aged 24 to 30 in 2019
N a
Women born 1989 to 1995
Aged 24 to 30 in 2019
Count
Women born 1989 to 1995
Aged 24 to 30 in 2019
% (95% CI)
Exclusively/mainly heterosexual
6,264
3,019
48.2 (46.4, 50.0)
Bisexual
714
544
76.2 (72.6, 79.8)
Exclusively/mainly lesbian
158
87
55.1 (44.6, 65.5)
Women born 1973 to 1978
Aged 40 to 45 in 2018
N
Women born 1973 to 1978
Aged 40 to 45 in 2018
Count
Women born 1973 to 1978
Aged 40 to 45 in 2018
% (95% CI)
Exclusively/mainly heterosexual
6,689
2,265
33.9 (31.9, 35.8)
Bisexual
53
32
60.4 (43.4, 77.3)
Exclusively/mainly lesbian
102
43
42.2 (27.4, 56.9)
Women born 1946 to 1951
Aged 68 to 73 in 2019
N
Women born 1946 to 1951
Aged 68 to 73 in 2019
Count
Women born 1946 to 1951
Aged 68 to 73 in 2019
% (95% CI)
Exclusively/mainly heterosexual
7,028
1,856
26.4 (24.4, 28.4)
Bisexual
9
5
55.6 (12.0, 99.1)
Exclusively/mainly lesbian
83
41
49.4 (34.1, 64.7)
Cultural and linguistic diversity
Women born 1989 to 1995
Aged 24 to 30 in 2019
N
Women born 1989 to 1995
Aged 24 to 30 in 2019
Count
Women born 1989 to 1995
Aged 24 to 30 in 2019
% (95% CI)
Culturally and linguistically diverse
355
173
48.7 (41.3, 56.2)
Not culturally and linguistically diverse
7,975
4,116
51.6 (50.1, 53.1)
Women born 1973 to 1978
Aged 40 to 45 in 2018
N
Women born 1973 to 1978
Aged 40 to 45 in 2018
Count
Women born 1973 to 1978
Aged 40 to 45 in 2018
% (95% CI)
Culturally and linguistically diverse
518
153
29.5 (22.3, 36.8)
Not culturally and linguistically diverse
6,590
2,263
34.3 (32.4, 36.3)
Women born 1946 to 1951
Aged 68 to 73 in 2019
N
Women born 1946 to 1951
Aged 68 to 73 in 2019
Count
Women born 1946 to 1951
Aged 68 to 73 in 2019
% (95% CI)
Culturally and linguistically diverse
675
152
22.5 (15.9, 29.2)
Not culturally and linguistically diverse
7,264
1,938
26.7 (24.7, 28.6)
Disability or illness status
Women born 1989 to 1995
Aged 24 to 30 in 2019
N
Women born 1989 to 1995
Aged 24 to 30 in 2019
Count
Women born 1989 to 1995
Aged 24 to 30 in 2019
% (95% CI)
Disability or illness
216
157
72.7 (65.7, 79.7)
No disability or illness
8,081
4,117
50.9 (49.4, 52.5)
Women born 1973 to 1978
Aged 40 to 45 in 2018
N
Women born 1973 to 1978
Aged 40 to 45 in 2018
Count
Women born 1973 to 1978
Aged 40 to 45 in 2018
% (95% CI)
Disability or illness
162
89
54.9 (44.6, 65.3)
No disability or illness
6,661
2,245
33.7 (31.7, 35.7)
Women born 1946 to 1951
Aged 68 to 73 in 2019
N
Women born 1946 to 1951
Aged 68 to 73 in 2019
Count
Women born 1946 to 1951
Aged 68 to 73 in 2019
% (95% CI)
Disability or illness
338
114
33.7 (25.0, 42.4)
No disability or illness
7,556
1,964
26.0 (24.1, 27.9)
Area of residence
Women born 1989 to 1995
Aged 24 to 30 in 2019
N
Women born 1989 to 1995
Aged 24 to 30 in 2019
Count
Women born 1989 to 1995
Aged 24 to 30 in 2019
% (95% CI)
Major cities
6,033
3,079
51.0 (49.3, 52.8)
Inner regional
1,362
710
52.1 (48.5, 55.8)
Outer regional, remote or very remote
645
362
56.1 (51.0, 61.2)
Women born 1973 to 1978
Aged 40 to 45 in 2018
N
Women born 1973 to 1978
Aged 40 to 45 in 2018
Count
Women born 1973 to 1978
Aged 40 to 45 in 2018
% (95% CI)
Major cities
3,877
1,271
32.8 (30.2, 35.4)
Inner regional
1,870
684
36.6 (33.0, 40.2)
Outer regional, remote or very remote
971
344
35.4 (30.4, 40.5)
Women born 1946 to 1951
Aged 68 to 73 in 2019
N
Women born 1946 to 1951
Aged 68 to 73 in 2019
Count
Women born 1946 to 1951
Aged 68 to 73 in 2019
% (95% CI)
Major cities
3,118
791
25.4 (22.3, 28.4)
Inner regional
3,254
880
27.0 (24.1, 30.0)
Outer regional, remote or very remote
1,549
409
26.4 (22.1, 30.7)
Notes: a N = number of women in total sample (i.e. denominator).
b Count = number of women reporting sexual violence (i.e. numerator).
Prevalence of sexual violence
Findings from the Australian Longitudinal Study on Women’s Health
Reported having experienced sexual violence in their lifetime
- 51% of women born 1989 to 1995 (aged 24 to 30 in 2019)
- 34% of women born 1973 to 1978 (aged 40 to 45 in 2018)
- 26% of women born 1946 to 1951 (aged 68 to 73 in 2019)
Reported having experienced sexual violence in childhood
- 12% of women born 1989 to 1995 (aged 24 to 30 in 2019)
- 15% of women born 1973 to 1978 (aged 40 to 45 in 2018)
- 14% of women born 1946 to 1951(aged 68 to 73 in 2019)
Reported having experienced sexual violence by a partner
- 33% of women born 1989 to 1995 (aged 24 to 30 in 2019)
- 14% of women born 1973 to 1978 (aged 40 to 45 in 2018)
Prevalence of sexual violence: Priority populations
Findings from the Australian Longitudinal Study on Women’s Health
Women who identified as bisexual or exclusively/mainly lesbian were more likely to have reported sexual violence than those who identified as exclusively/mainly heterosexual.
Women born 1989 to 1995 (aged 24 to 30 in 2019)
- 48% of women who identified as exclusively/mainly heterosexual.
- 55% of women who identified as exclusively/mainly lesbian.
- 76% of women who identified as exclusively/mainly bisexual.
Women born 1973 to 1978 (aged 40 to 45 in 2018)
- 34% of women who identified as exclusively/mainly heterosexual.
- 42% of women who identified as exclusively/mainly lesbian.
- 60% of women who identified as exclusively/mainly bisexual.
Women born 1946 to 1951 (aged 68 to 73 in 2019)
- 26% of women who identified as exclusively/mainly heterosexual.
- 49% of women who identified as exclusively/mainly lesbian.
Women who had disability or illness were more likely to have reported experiencing sexual violence than those who did not have disability or illness.
Women born 1989 to 1995 (aged 24 to 30 in 2019)
- 51% of women not living with disability or illness.
- 73% of women living with disability or illness.
Women born 1973 to 1978 (aged 40 to 45 in 2018)
- 34% of women not living with disability or illness.
- 55% of women living with disability or illness.
Women born 1946 to 1951 (aged 68 to 73 in 2019)
- 26% of women not living with disability or illness.
- 34% of women living with disability or illness.
There were very few differences in the prevalence of sexual violence between women who lived in:
- Major cities.
- Inner regional areas.
- Outer regional/remote/very remote areas.
Chapter 2: Sexual violence during childhood as a risk factor for further violence
Sexual violence during childhood as a risk factor for further violence
Women born in 1989 to 1995 and 1973 to 1978 were approximately 50 per cent more likely to have experienced recent violence if they had experienced sexual violence during childhood, compared to women who had not experienced sexual violence during childhood, after adjusting for confounding variables (Figure 10).
Figure 10: Effect estimates of sexual violence during childhood on risk of recent violence (sexual, domestic or physical)
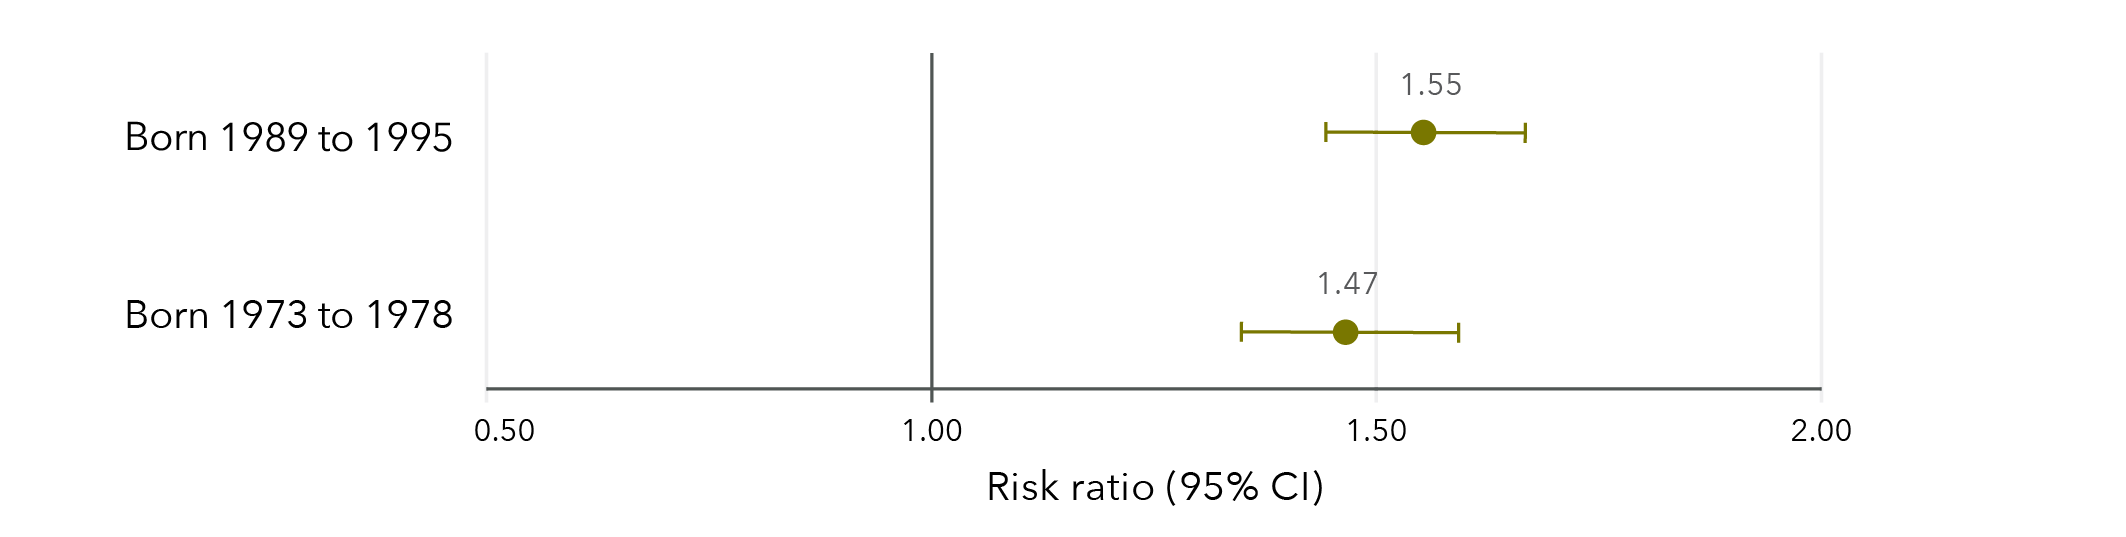
Note: Longitudinal models in Figure 10 were controlled for CALD status, age, highest qualification, area of residence, relationship status and ability to manage on available income. Data from women born 1946 to 1951 were not analysed due to low frequencies.
Data table for figure 10:
Risk ratio Lower limit Upper limit Born 1989 to 1995 1.55 1.44 1.67 Born 1973 to 1978 1.47 1.35 1.60
Almost a quarter (23%) of women aged 24 to 30 in 2019 who had experienced sexual violence during childhood had also experienced recent violence (sexual, domestic or physical). In comparison, 15 per cent of women who had not experienced sexual violence during childhood had experienced recent violence. Among women aged 40 to 45 in 2018, almost one in five (19%) who had experienced sexual violence during childhood had also experienced recent violence (sexual, domestic or physical), compared to 13 per cent of women who had not experienced sexual violence during childhood.
Among women born in 1989 to 1995 and 1973 to 1978, experiences of recent violence mainly included domestic violence and physical violence. Sexual violence was less common. Among women aged 24 to 30 in 2019 who experienced recent violence, 70 per cent experienced recent domestic violence, 63 per cent experienced recent physical violence and 21 per cent experienced recent sexual violence. Among women aged 40 to 45 in 2018 who experienced recent violence, 85 per cent experienced recent domestic violence, 46 per cent experienced recent physical violence and 9 per cent experienced recent sexual violence.
Sexual violence during childhood as a risk factor for further sexual violence
Women who had experienced sexual violence during childhood were twice as likely to report recent sexual violence compared to women who had not experienced sexual violence during childhood, after adjusting for confounding variables (Figure 11).
Figure 11: Effect estimates of sexual violence during childhood on risk of recent sexual violence in adulthood
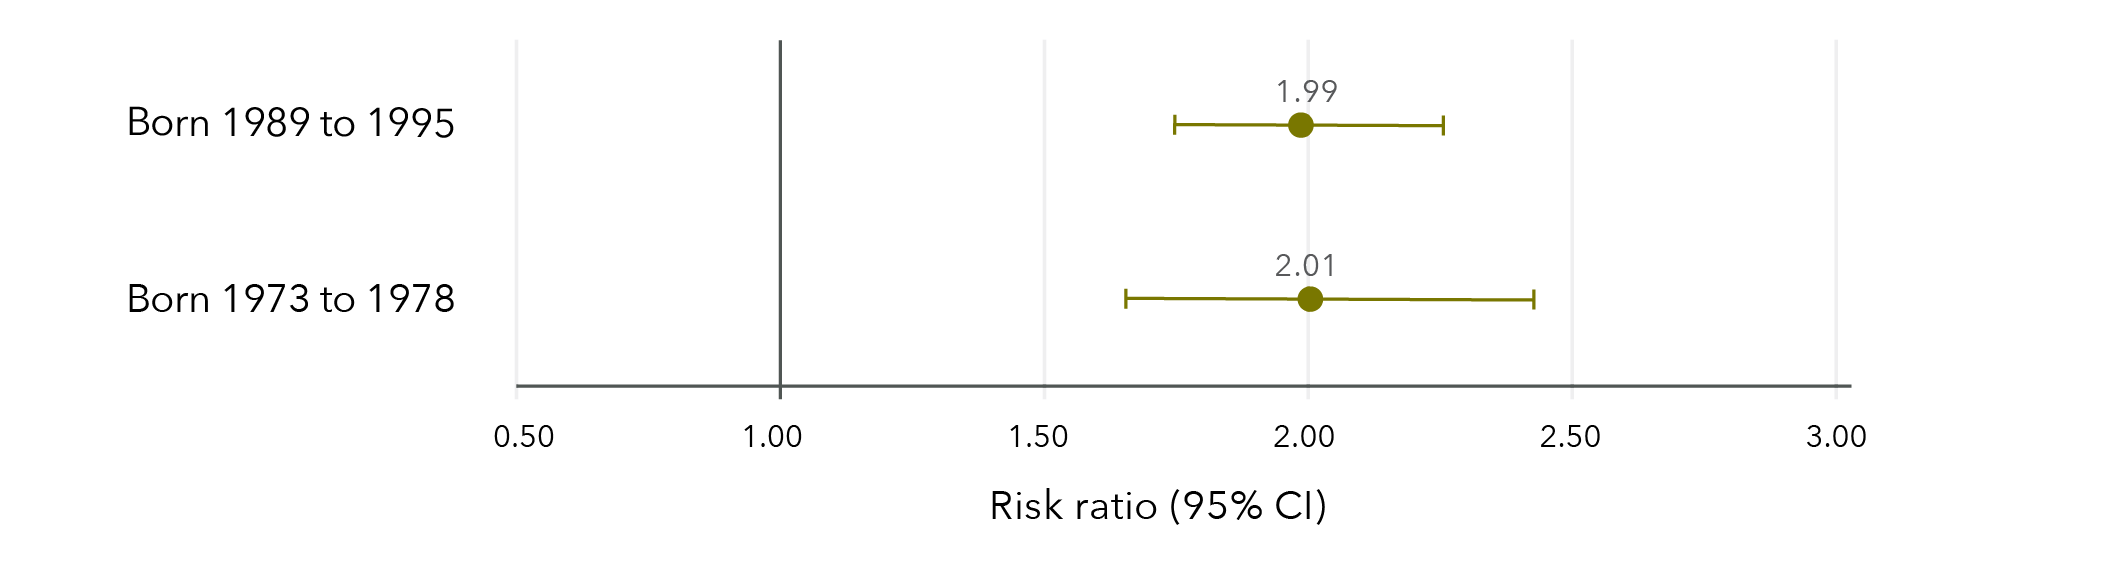
Note: Longitudinal models in Figure 11 were controlled for CALD status, age, highest qualification, area of residence, relationship status and ability to manage on available income. Data from women born 1946 to 1951 were not able to be analysed due to insufficient cell sizes.
Data table for Figure 11
Risk ratio Lower limit Upper limit Born 1989 to 1995 1.99 1.75 2.26 Born 1973 to 1978 2.01 1.66 2.43
Among women aged 24 to 30 in 2019, 6 per cent who had experienced sexual violence during childhood reported recent sexual violence compared to 3 per cent of women who had not experienced sexual violence during childhood.
Similarly, among women aged 40 to 45 in 2018, 2 per cent who had experienced sexual violence during childhood reported recent sexual violence compared to 1 per cent of women who had not experienced sexual violence during childhood.
Sexual violence during childhood as a risk factor for recent domestic violence
Women who had experienced sexual violence during childhood were 33 to 59 per cent more likely to report recent domestic violence than women who had not experienced sexual violence during childhood, after controlling for confounding variables (Figure 12).
Figure 12: Effect estimates of sexual violence during childhood on risk of recent domestic violence
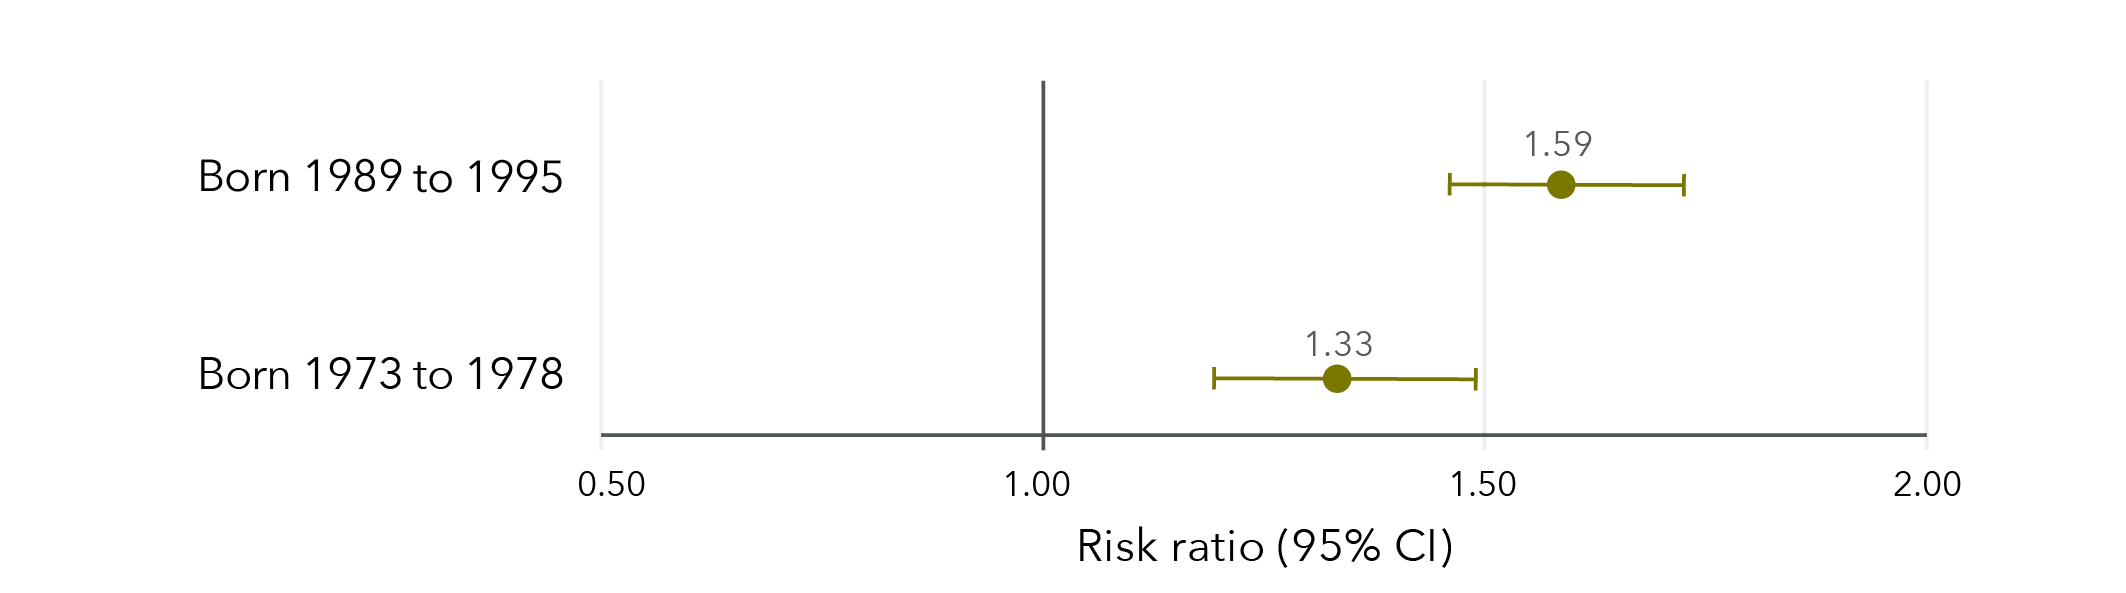
Note: Longitudinal models in Figure 12 were controlled for CALD status, age, highest qualification, area of residence, relationship status and ability to manage on available income. Data from women born 1946 to 1951 were not able to be analysed as recent domestic violence was not measured in this cohort.
Data table for figure 12:
Risk ratio Lower limit Upper limit Born 1989 to 1995 1.59 1.46 1.72 Born 1973 to 1978 1.33 1.19 1.49
Among women aged 24 to 30 in 2019, 16 per cent who had experienced sexual violence during childhood reported recent domestic violence, compared to 10 per cent of women who had not experienced sexual violence during childhood. Women aged 24 to 30 who reported recent domestic violence were most likely to have reported emotional abuse (79%), followed by physical violence (44%), harassment (31%) and sexual violence (18%).
Similarly, 15 per cent of women aged 40 to 45 in 2018 who had experienced sexual violence during childhood reported recent domestic violence, compared to 11 per cent of those who had not experienced sexual violence during childhood.
Women aged 40 to 45 who reported recent domestic violence were most likely to have reported emotional abuse (91%), followed by physical violence (31%), harassment (25%) and sexual violence (6%).
Sexual violence during childhood as a risk factor for recent physical violence
Women born in 1989 to 1995 and 1973 to 1978 were approximately 60 per cent more likely to have reported recent physical violence if they had experienced sexual violence during childhood compared to women who had not experienced sexual violence during childhood, after adjusting for confounding variables (Figure 13).
Figure 13: Effect estimates of sexual violence during childhood on risk of recent physical violence
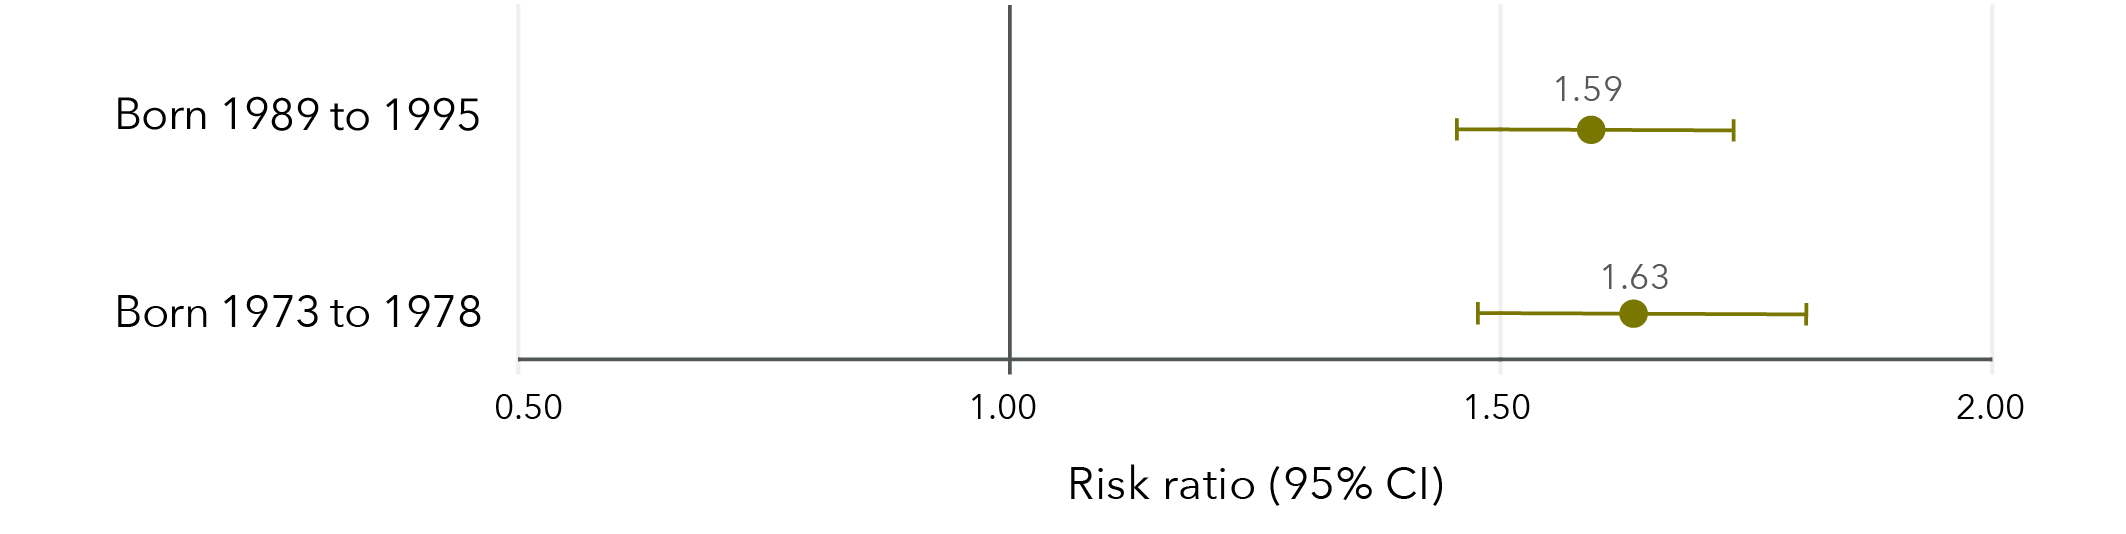
Note: Longitudinal models in Figure 13 were controlled for CALD status, age, highest qualification, area of residence, relationship status and ability to manage on available income. Data from women born 1946 to 1951 were not able to be analysed as recent physical violence by a partner was not measured and recent physical violence by an unspecified person had very low frequencies.
Data table for figure 13:
Risk ratio Lower limit Upper limit Born 1989 to 1995 1.59 1.46 1.74 Born 1973 to 1978 1.63 1.48 1.81
Approximately 16 per cent of women aged 24 to 30 in 2019 who experienced sexual violence during childhood reported recent physical violence, compared to 9 per cent of women who had not experienced sexual violence during childhood. Among women aged 40 to 45 in 2018, 10 per cent of women who experienced sexual violence during childhood reported recent physical violence compared to 5 per cent of women who had not experienced sexual violence during childhood.
Sexual violence in childhood as a risk factor for other violence
Findings from the Australian Longitudinal Study on Women’s Health
Women born 1989 to 1995 (aged 24 to 30 in 2019) and 1973 to 1978 (aged 40 to 45 in 2018) who had experienced sexual violence during childhood were 50% more likely to have reported recent violence* compared to those who had not experienced sexual violence during childhood.
Women who had experienced sexual violence during childhood were:
- 2x more likely to have reported recent sexual violence* compared to those who had not experienced sexual violence during childhood compared to those who had not experienced sexual violence during childhood.
- 33 to 59% more likely to have reported recent domestic violence* compared to those who had not experienced sexual violence during childhood.
Women born 1989 to 1995 (aged 24 to 30 in 2019) and 1973 to 1978 (aged 40 to 45 in 2018) who had experienced sexual violence during childhood were 60% more likely have reported recent physical violence* compared to those who had not experienced sexual violence during childhood.
* Risk ratios varied for women born 1989 to 1995, 1973 to 1978, and 1946 to 1951.
Chapter 3: Lifetime sexual violence and economic factors
Association between sexual violence and education
Women born in 1989 to 1995 and 1973 to 1978 were 46 to 63 per cent more likely to have not completed Year 12 if they had ever experienced sexual violence compared to those who had not experienced sexual violence (Figure 14). Women born in 1989 to 1995 were also 34 per cent less likely to have attained a qualification beyond Year 12 if they had ever experienced sexual violence compared to those who had not experienced sexual violence. However, women born in 1946 to 1951 who had experienced sexual violence were 33 per cent more likely to have attained a qualification beyond Year 12 than those who had not experienced sexual violence.
Figure 14: Effect estimates of any sexual violence on education
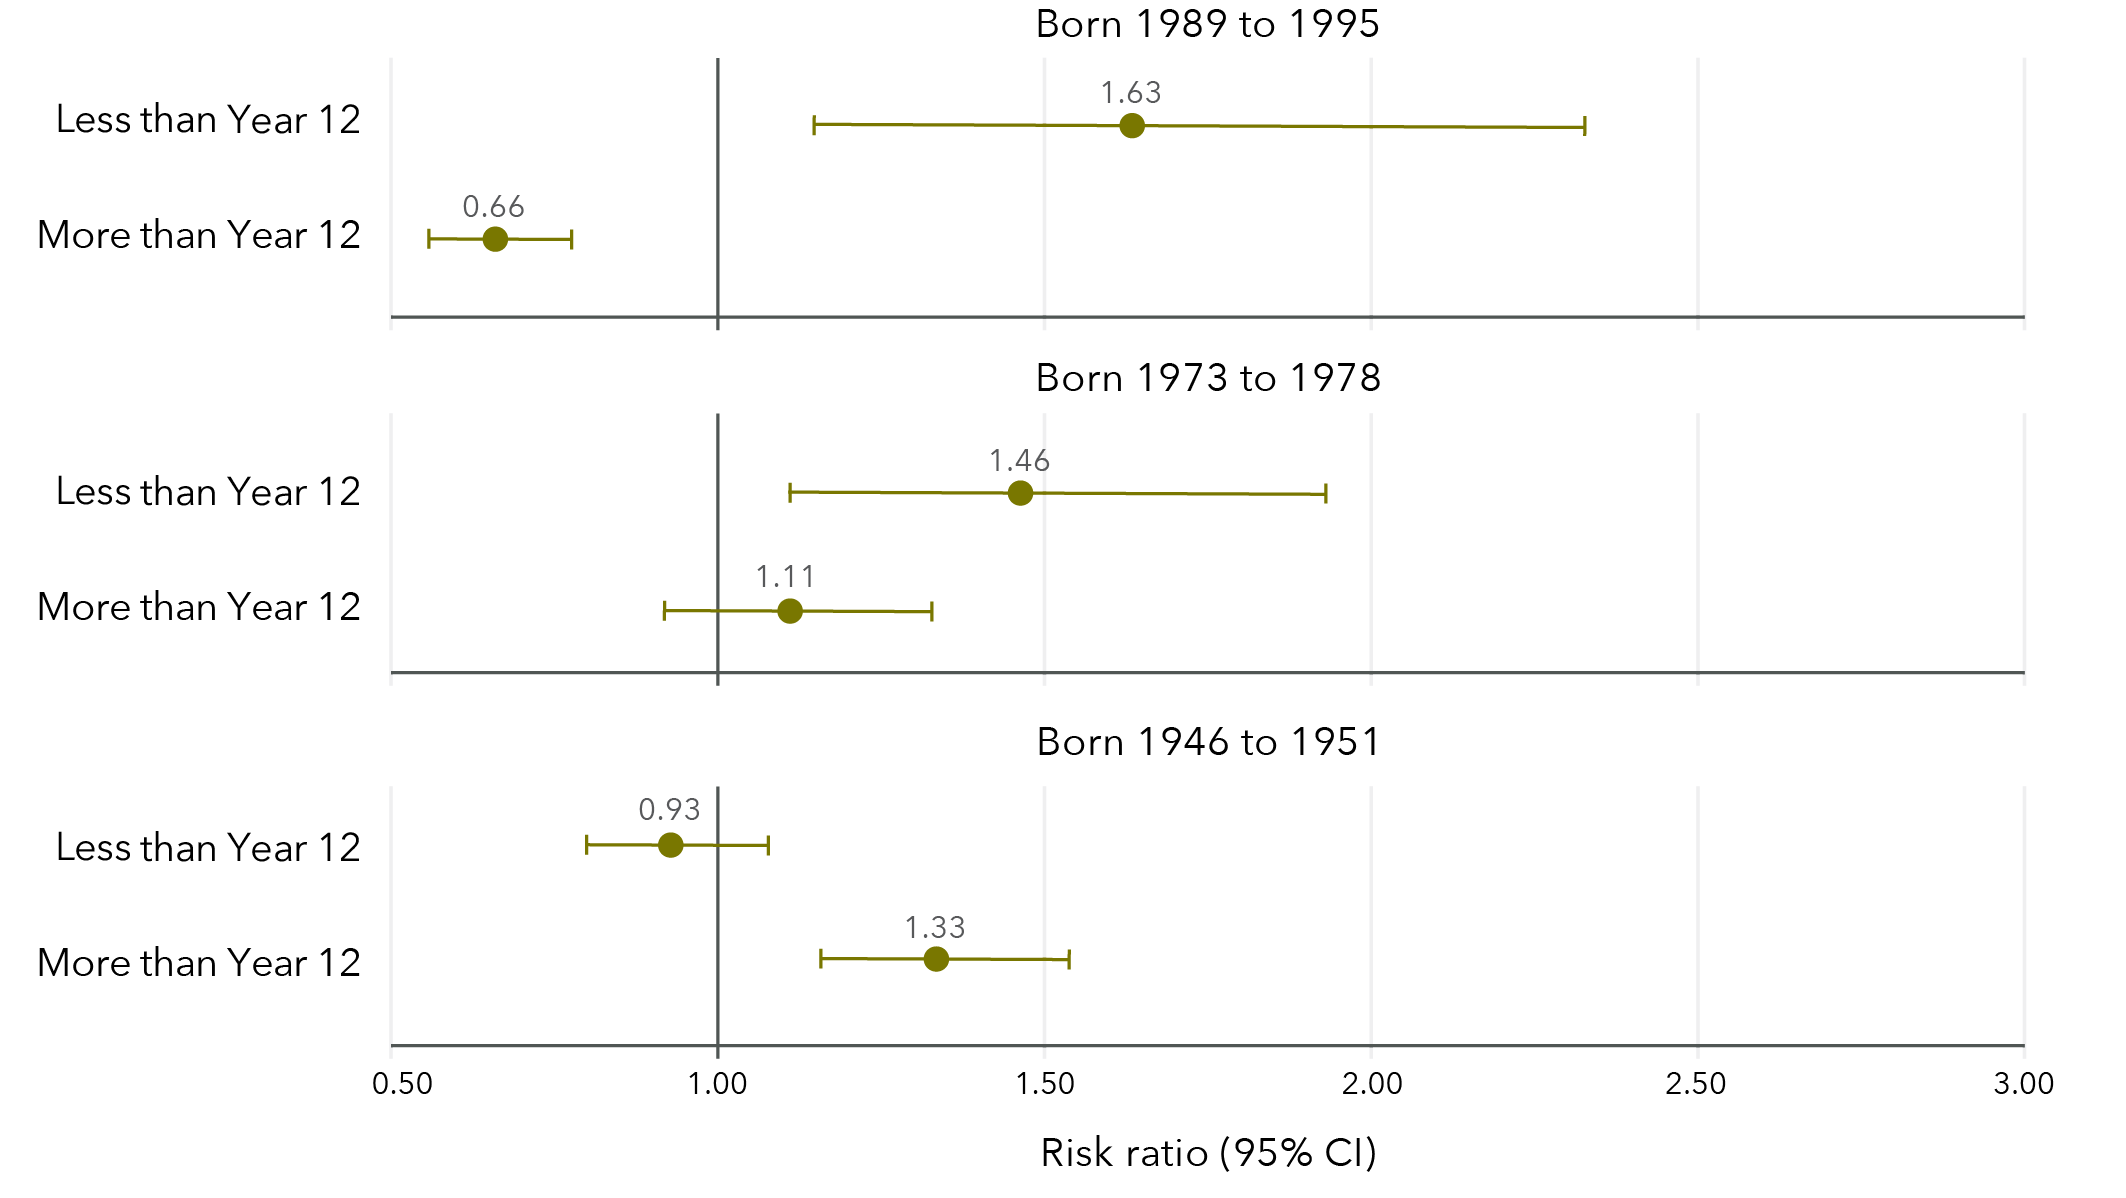
Note: Reference category is “Completed Year 12 only”. Cross-sectional models in Figure 14 were unadjusted. Caution must be used when interpreting effect estimates due to lack of information on when sexual violence occurred and when the decision not to attain higher qualifications occurred. These effects are complex and causation should not be inferred.
Data table for figure 14:
Born 1989 to 1995
Risk ratio Lower limit Upper limit Less than Year 12 1.63 1.15 2.33 More than Year 12 0.66 0.56 0.78
Born 1973 to 1978
Risk ratio Lower limit Upper limit Less than Year 12 1.46 1.11 1.93 More than Year 12 1.11 0.92 1.33
Born 1946 to 1951
Risk ratio Lower limit Upper limit Less than Year 12 0.93 0.80 1.08 More than Year 12 1.33 1.16 1.54
Among women aged 24 to 30 in 2019 to 2020, 3 per cent had not completed Year 12, 9 per cent had completed Year 12 only and 84 per cent had attained qualifications beyond Year 12. Similarly, among women aged 40 to 45 in 2018, 6 per cent had not completed Year 12, 8 per cent had completed Year 12 only and 81 per cent had attained qualifications beyond Year 12. In contrast, among women aged 68 to 73 in 2019, 32 per cent had not completed Year 12, 17 per cent had completed Year 12 only and 45 per cent had attained qualifications beyond Year 12.
Association between sexual violence and full-time employment
Women born 1989 to 1995 were 7 per cent less likely to be in full-time employment if they had experienced sexual violence, compared to those who had not experienced sexual violence (Figure 15). Conversely, women born 1946 to 1951 were 8 per cent more likely to be in full-time employment if they had experienced sexual violence compared to women who had not experienced sexual violence. There was no evidence for an effect among women born 1973 to 1978.
Figure 15: Effect estimates of any sexual violence on full-time employment
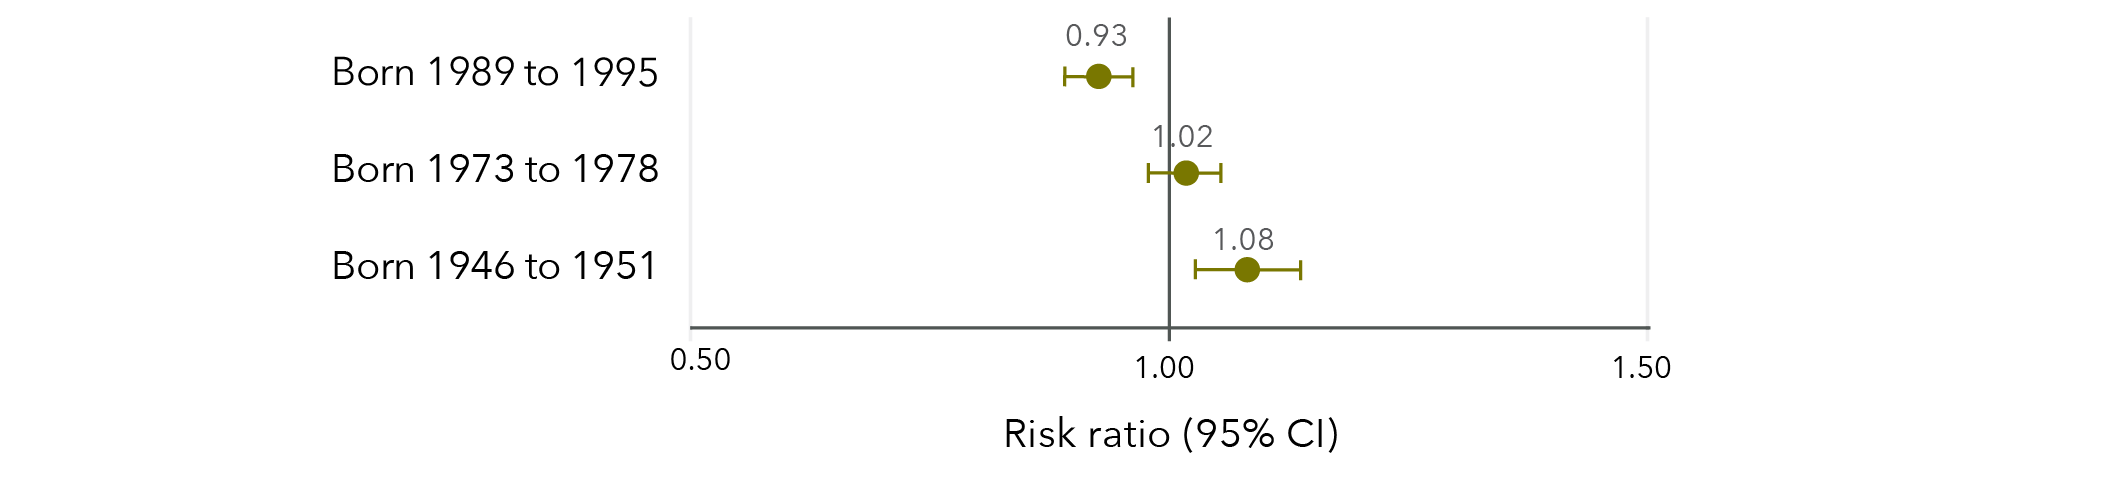
Note: Longitudinal models in Figure 15 were controlled for CALD status, age, highest qualification, area of residence and relationship status.
Data table for figure 15:
Risk ratio Lower limit Upper limit Born 1989 to 1995 0.93 0.89 0.96 Born 1973 to 1978 1.02 0.98 1.05 Born 1946 to 1951 1.08 1.03 1.14
Overall, the prevalence of full-time employment increased over time among women born in 1989 to 1995 (Figure 16). Women who had experienced sexual violence had lower prevalence of full-time employment than those who had not experienced sexual violence and this discrepancy increased over time.
Figure 16: Prevalence of full-time employment among women born in 1989 to 1995, according to whether sexual violence had been experienced
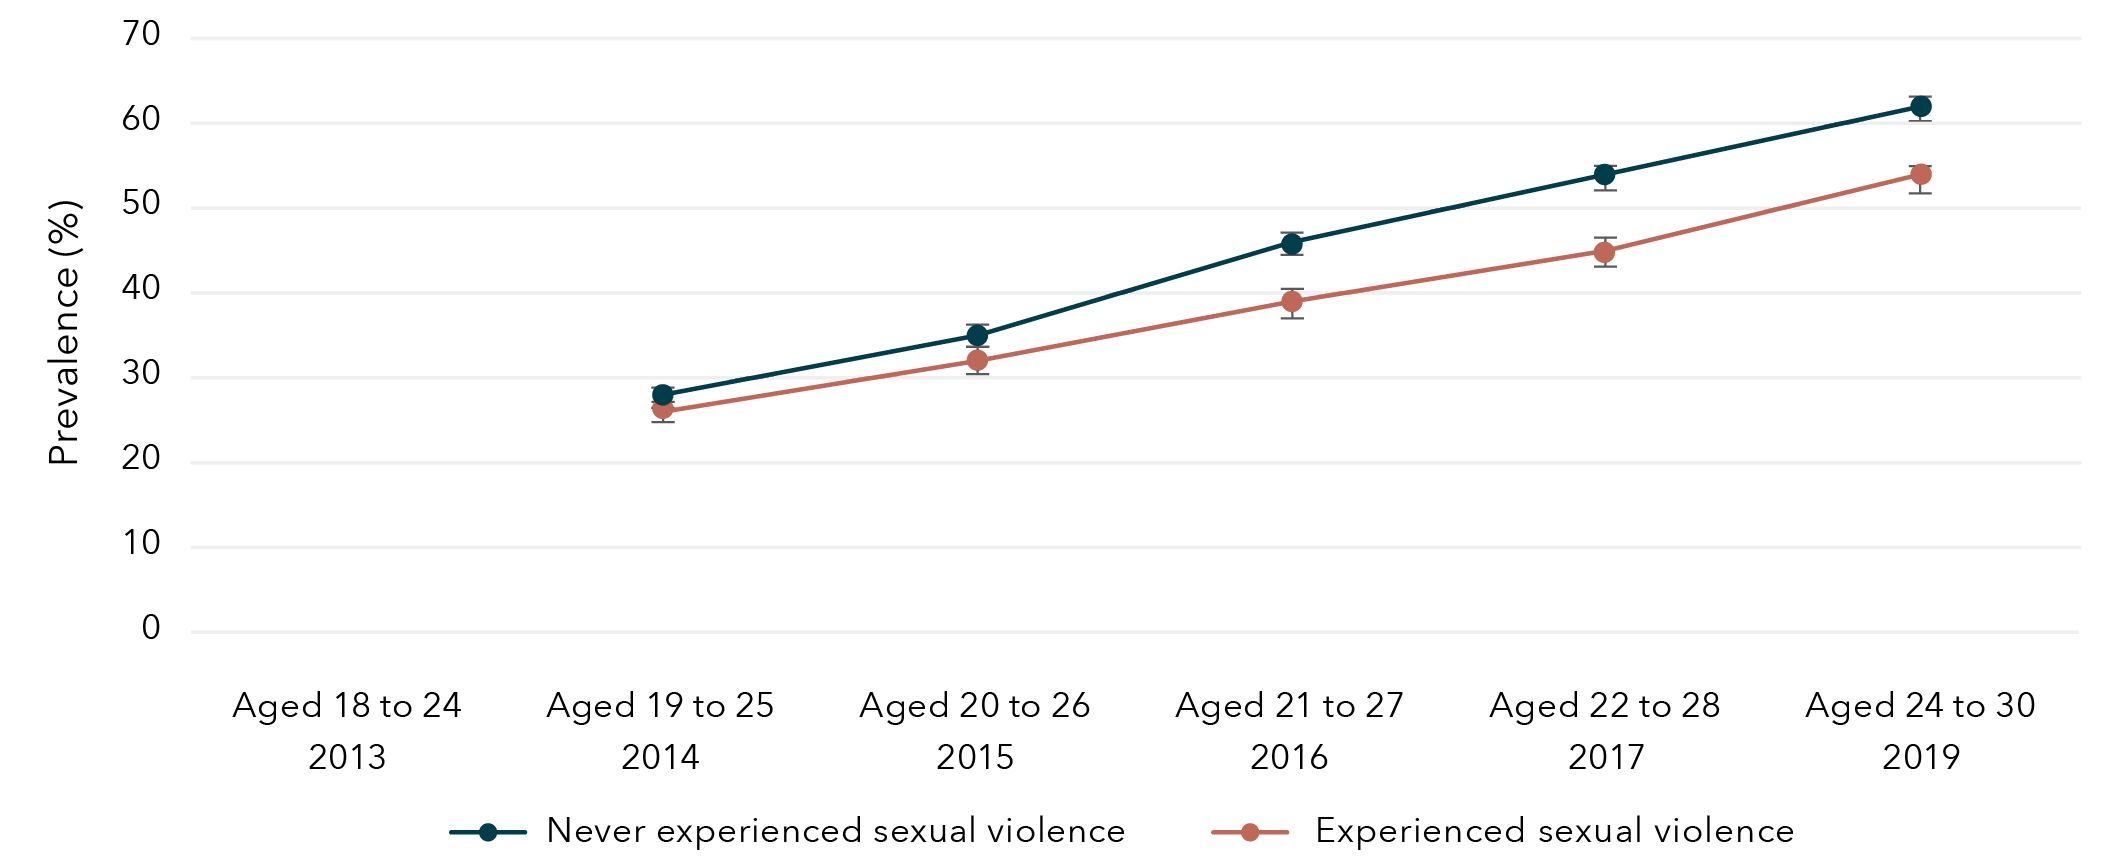
Note: Employment was not measured among women born 1989 to 1995 in 2013.
Data table for figure 16:
Age and year
Experience with sexual violence Prevalence Lower bound Upper bound Aged 18 to 24
2013 Never experienced sexual violence No data No data No data Aged 19 to 25
2014 Never experienced sexual violence 28% 27% 29% Aged 20 to 26
2015 Never experienced sexual violence 35% 34% 36% Aged 21 to 27
2016 Never experienced sexual violence 46% 45% 47% Aged 22 to 28
2017 Never experienced sexual violence 54% 53% 55% Aged 24 to 30
2019 Never experienced sexual violence 62% 61% 64% Aged 18 to 24
2013 Experienced sexual violence No data No data No data Aged 19 to 25
2014 Experienced sexual violence 26% 25% 28% Aged 20 to 26
2015 Experienced sexual violence 32% 30% 34% Aged 21 to 27
2016 Experienced sexual violence 39% 37% 41% Aged 22 to 28
2017 Experienced sexual violence 45% 43% 47% Aged 24 to 30
2019 Experienced sexual violence 54% 52% 55%
The prevalence of full-time employment among women born in 1973 to 1978 gradually decreased from age 22 to 27 until age 34 to 39 and then increased again as women entered their 40s (Figure 17). The full-time employment trend was similar for women who had and had not experienced sexual violence.
Figure 17: Prevalence of full-time employment among women born in 1973 to 1978, according to whether they experienced sexual violence
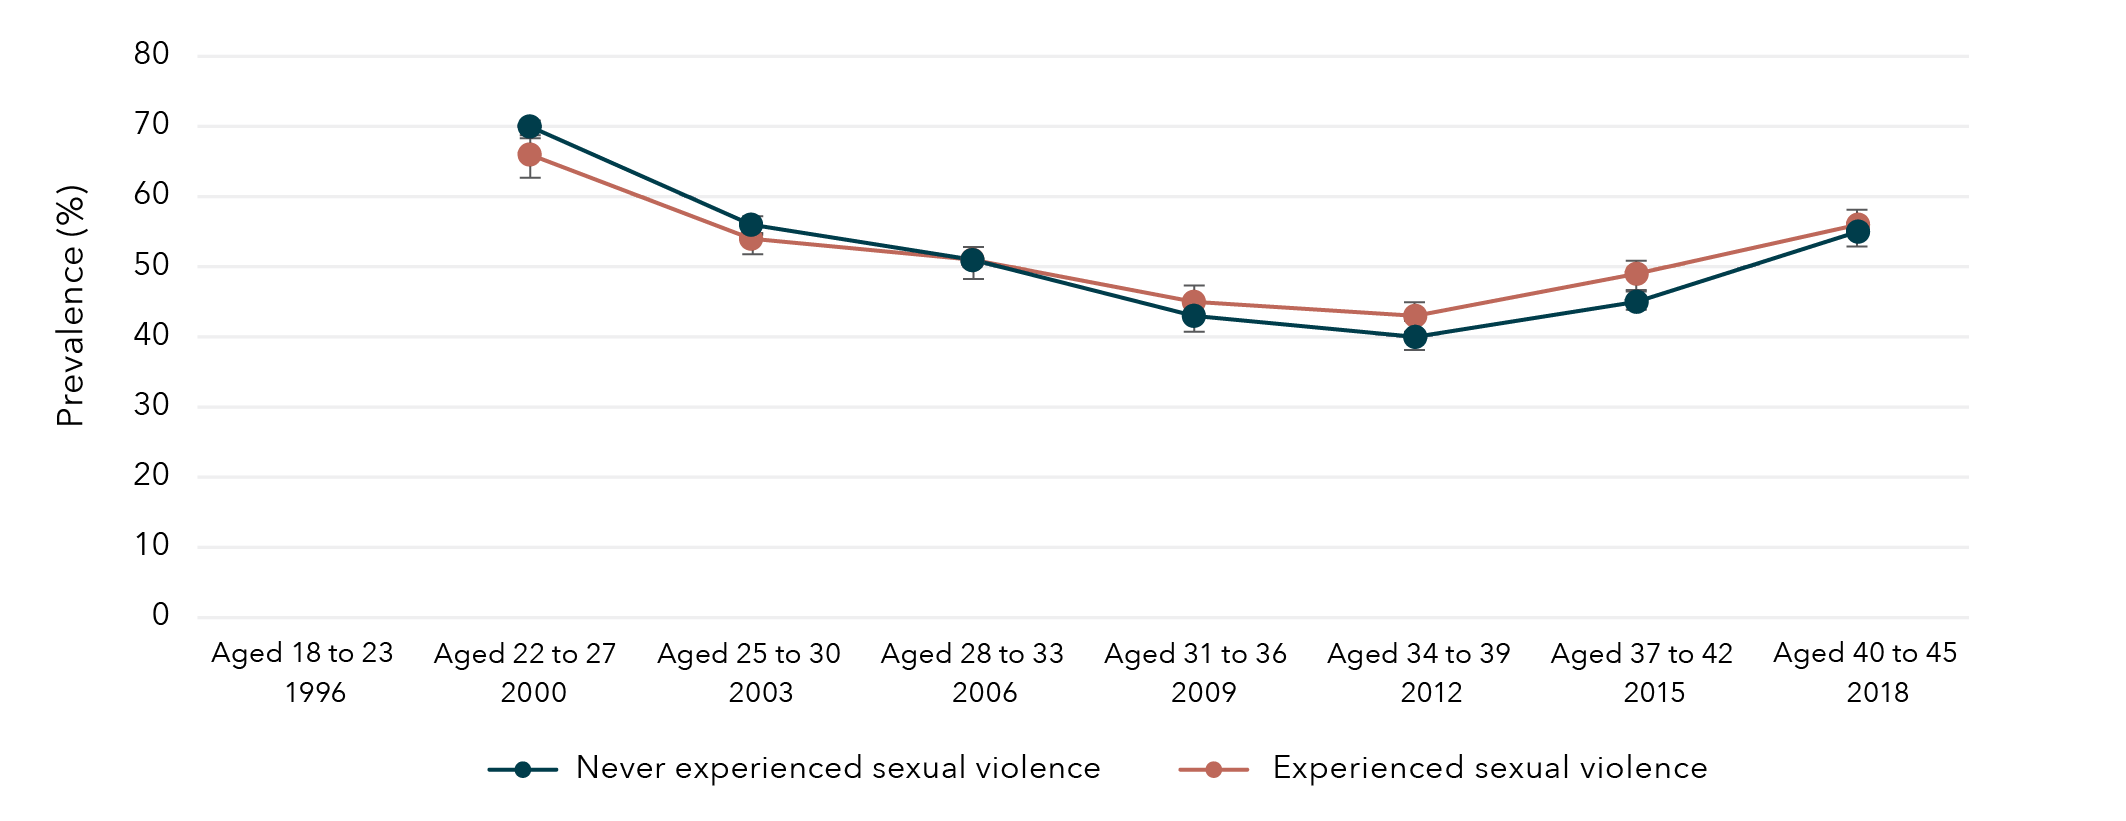
Note: Employment was not measured among women born 1973 to 1978 in 1996.
Data table for figure 17:
Age and year Experience with sexual violence Prevalence Lower bound Upper bound Aged 18 to 23
1996 Never experienced sexual violence No data No data No data Aged 22 to 27
2000 Never experienced sexual violence 70% 69% 71% Aged 25 to 30
2003 Never experienced sexual violence 56% 55% 57% Aged 28 to 33
2006 Never experienced sexual violence 51% 50% 53% Aged 31 to 36
2009 Never experienced sexual violence 43% 41% 44% Aged 34 to 39
2012 Never experienced sexual violence 40% 38% 41% Aged 37 to 42
2015 Never experienced sexual violence 45% 44% 47% Aged 40 to 45
2018 Never experienced sexual violence 55% 53% 56% Aged 18 to 23
1996 Experienced sexual violence No data No data No data Aged 22 to 27
2000 Experienced sexual violence 66% 63% 69% Aged 25 to 30
2003 Experienced sexual violence 54% 52% 57% Aged 28 to 33
2006 Experienced sexual violence 51% 48% 53% Aged 31 to 36
2009 Experienced sexual violence 45% 43% 47% Aged 34 to 39
2012 Experienced sexual violence 43% 40% 45% Aged 37 to 42
2015 Experienced sexual violence 49% 47% 51% Aged 40 to 45
2018 Experienced sexual violence 56% 54% 58%
Overall, the prevalence of full-time employment among women born in 1946 to 1951 decreased after 2004, when the women were aged 53 to 58 (Figure 18). Women who had experienced sexual violence had slightly higher prevalence of full-time employment than those who had not experienced sexual violence.
Figure 18: Prevalence of full-time employment among women born in 1946 to 1951, according to whether sexual violence had been experienced
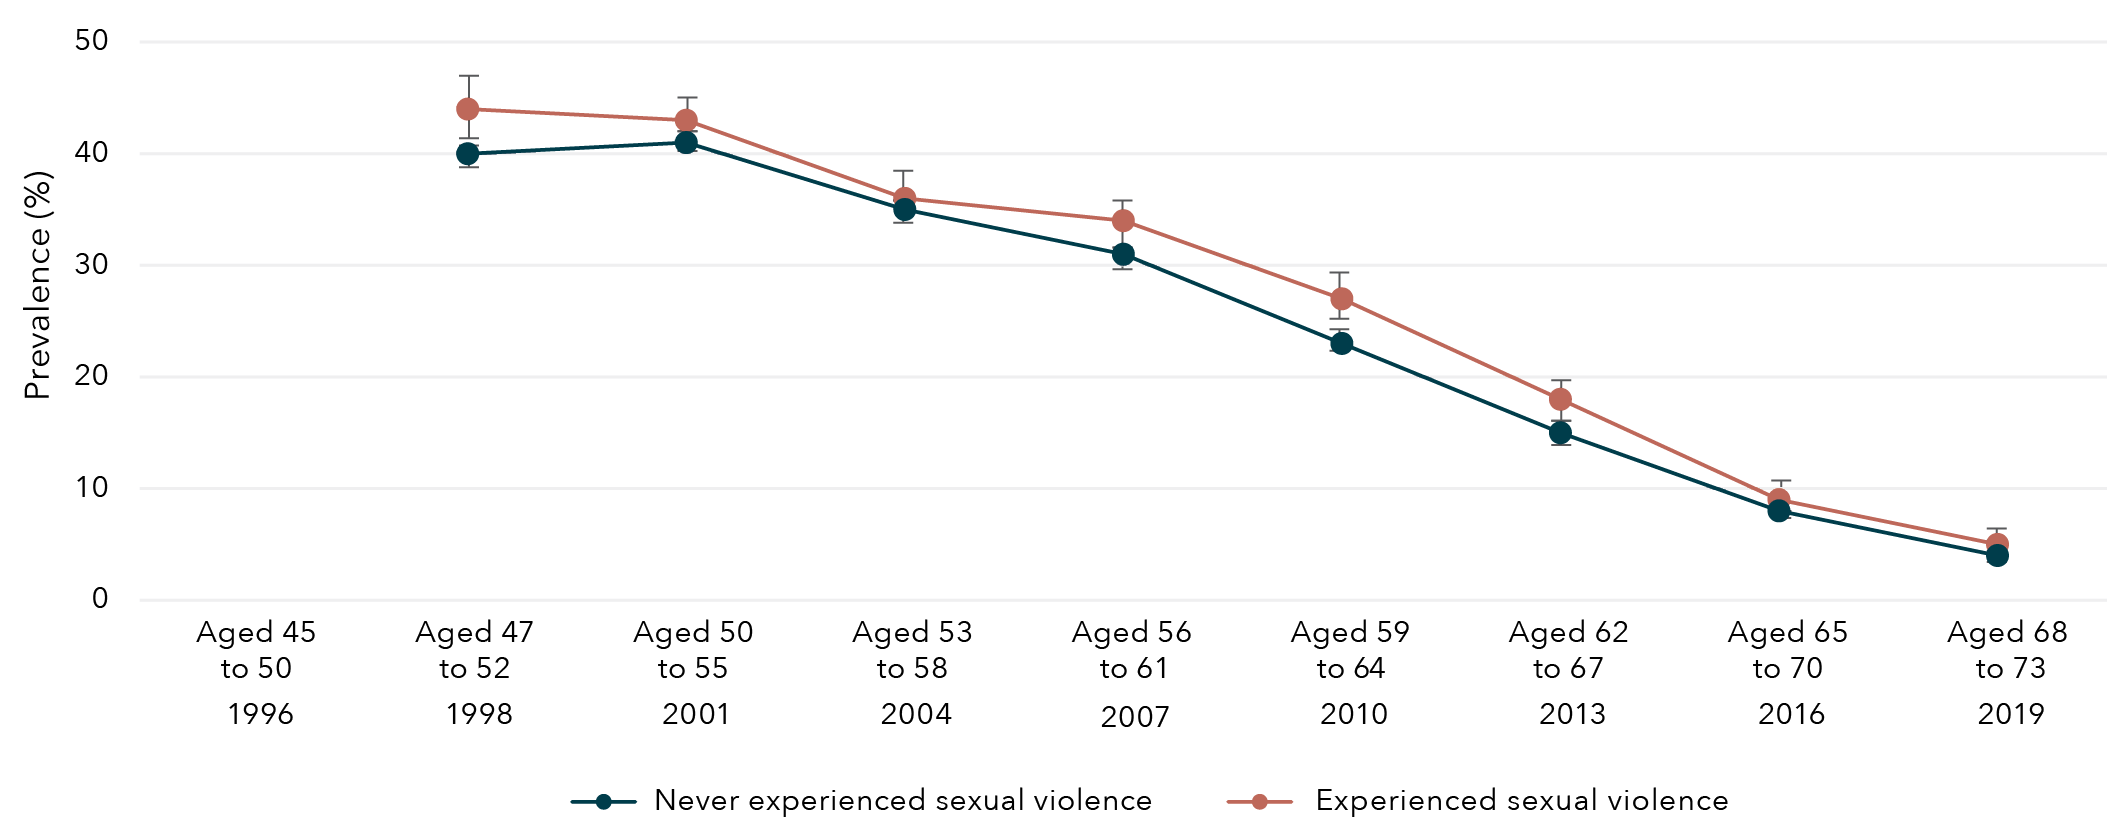
Note: Employment was not measured among women born 1946 to 1951 in 1996.
Data table for figure 18:
Age and year Experience with sexual violence Prevalence Lower bound Upper bound Aged 45 to 50
1996 Never experienced sexual violence No data No data No data Aged 47 to 52
1998 Never experienced sexual violence 40% 39% 41% Aged 50 to 55
2001 Never experienced sexual violence 41% 40% 42% Aged 53 to 58
2004 Never experienced sexual violence 35% 34% 36% Aged 56 to 61
2007 Never experienced sexual violence 31% 30% 32% Aged 59 to 64
2010 Never experienced sexual violence 23% 22% 24% Aged 62 to 67
2013 Never experienced sexual violence 15% 14% 15% Aged 65 to 70
2016 Never experienced sexual violence 8% 7% 8% Aged 68 to 73
2019 Never experienced sexual violence 4% 4% 5% Aged 45 to 50
1996 Experienced sexual violence No data No data No data Aged 47 to 52
1998 Experienced sexual violence 44% 41% 47% Aged 50 to 55
2001 Experienced sexual violence 43% 40% 45% Aged 53 to 58
2004 Experienced sexual violence 36% 34% 39% Aged 56 to 61
2007 Experienced sexual violence 34% 31% 36% Aged 59 to 64
2010 Experienced sexual violence 27% 25% 29% Aged 62 to 67
2013 Experienced sexual violence 18% 16% 19% Aged 65 to 70
2016 Experienced sexual violence 9% 8% 10% Aged 68 to 73
2019 Experienced sexual violence 5% 4% 6%
Association between sexual violence and financial stress
Women born in 1989 to 1995, 1973 to 1978 and 1946 to 1951 who had experienced sexual violence were approximately 40 per cent more likely to report high financial stress compared to those who had not experienced sexual violence (Figure 19).
Figure 19: Effect estimates of any sexual violence on high financial stress
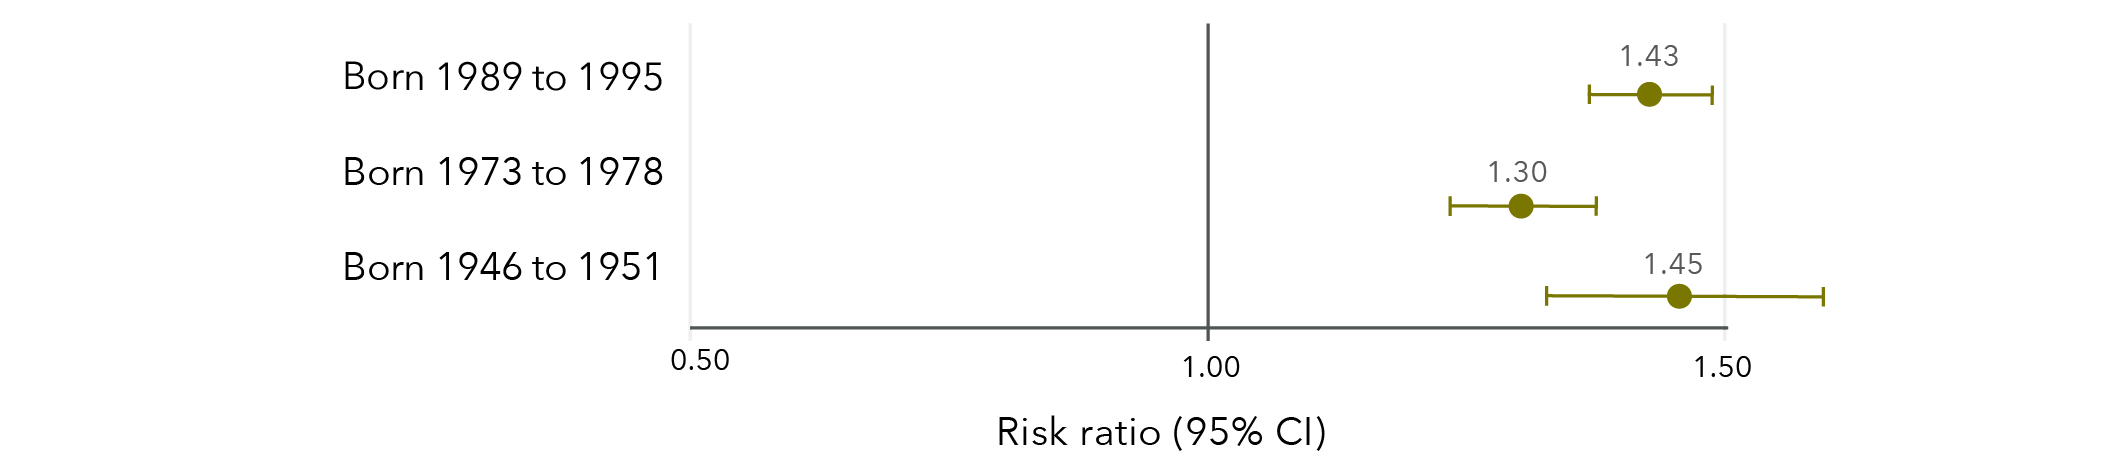
Note: Longitudinal models in Figure 19 were controlled for CALD status, age, highest qualification, area of residence and relationship status.
Data table for figure 19:
Risk ratio Lower limit Upper limit Born 1989 to 1995 1.43 1.37 1.49 Born 1973 to 1978 1.30 1.23 1.37 Born 1946 to 1951 1.45 1.33 1.59
There was a gradual decrease over time in the prevalence of high financial stress among women born 1989 to 1995 (Figure 20), 1973 to 1978 (Figure 21) and 1946 to 1951 (Figure 22). Among all three cohorts of women, high financial stress was more prevalent over time among women who had experienced sexual violence than those who had not experienced sexual violence.
Figure 20: Prevalence of high financial stress among women born in 1989 to 1995, according to whether sexual violence had been experienced
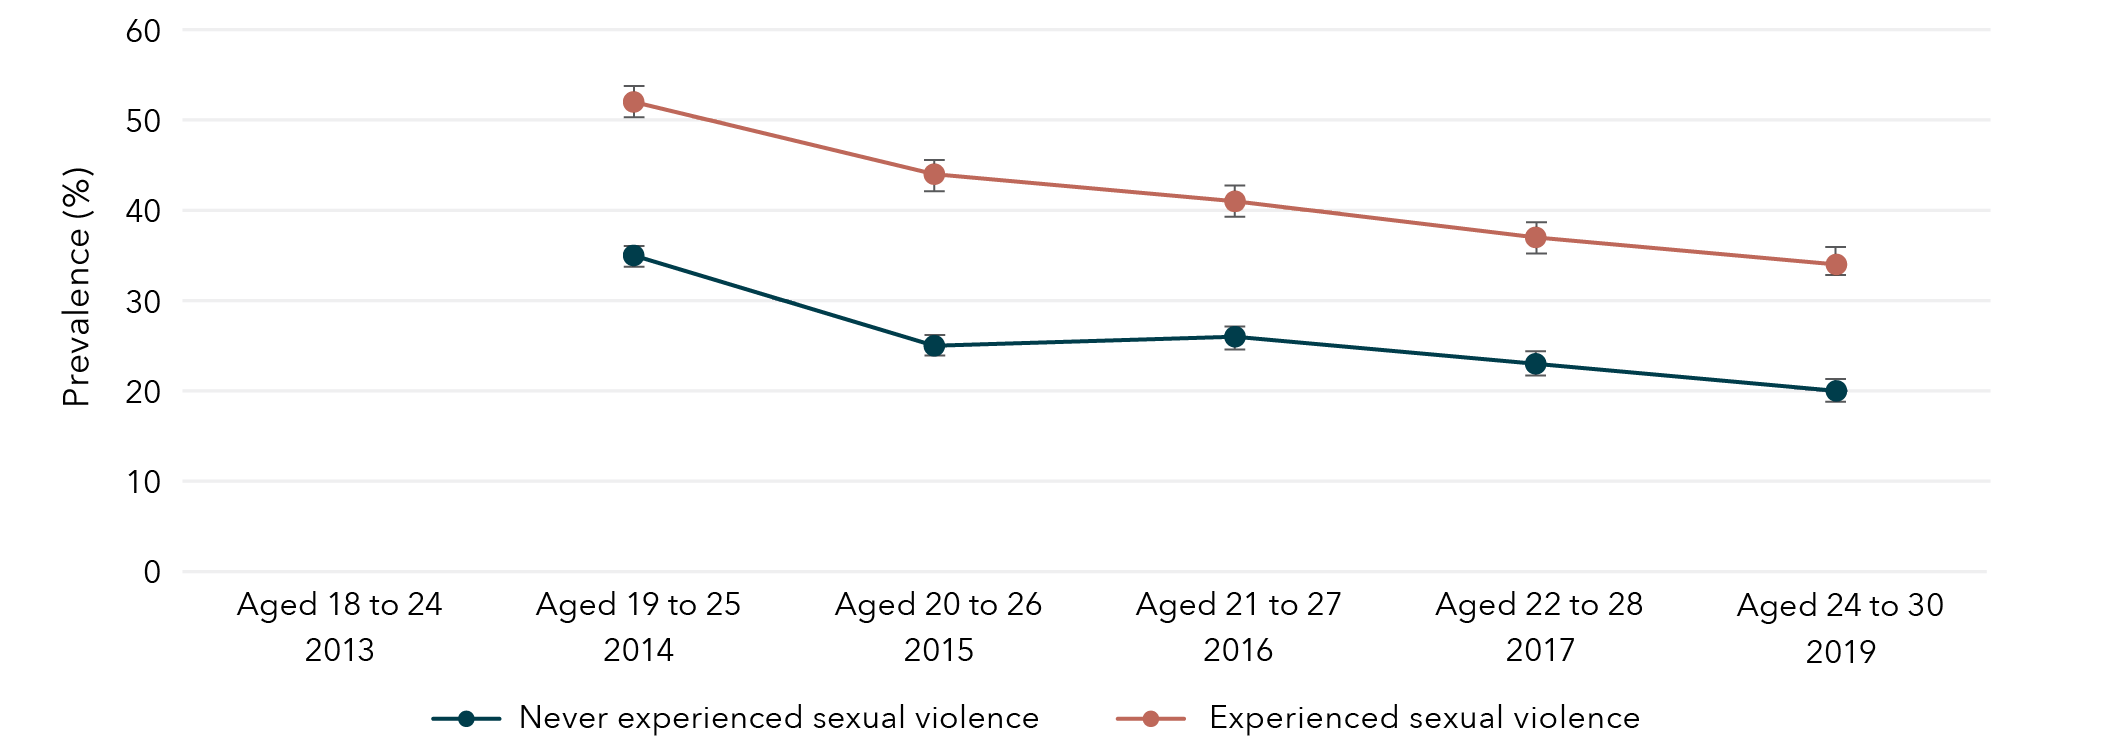
Note: Financial stress was not measured among women born 1989 to 1995 in 2013.
Data table for figure 20:
Age and year Experience with sexual violence Prevalence Lower bound Upper bound Aged 18 to 24
2013 Never experienced sexual violence No data No data No data Aged 19 to 25
2014 Never experienced sexual violence 35% 34% 36% Aged 20 to 26
2015 Never experienced sexual violence 25% 24% 26% Aged 21 to 27
2016 Never experienced sexual violence 26% 24% 27% Aged 22 to 28
2017 Never experienced sexual violence 23% 22% 24% Aged 24 to 30
2019 Never experienced sexual violence 20% 19% 21% Aged 18 to 24
2013 Experienced sexual violence No data No data No data Aged 19 to 25
2014 Experienced sexual violence 52% 51% 54% Aged 20 to 26
2015 Experienced sexual violence 44% 42% 45% Aged 21 to 27
2016 Experienced sexual violence 41% 39% 42% Aged 22 to 28
2017 Experienced sexual violence 37% 35% 38% Aged 24 to 30
2019 Experienced sexual violence 34% 33% 36%
Figure 21: Prevalence of high financial stress among women born in 1973 to 1978, according to whether sexual violence had been experienced
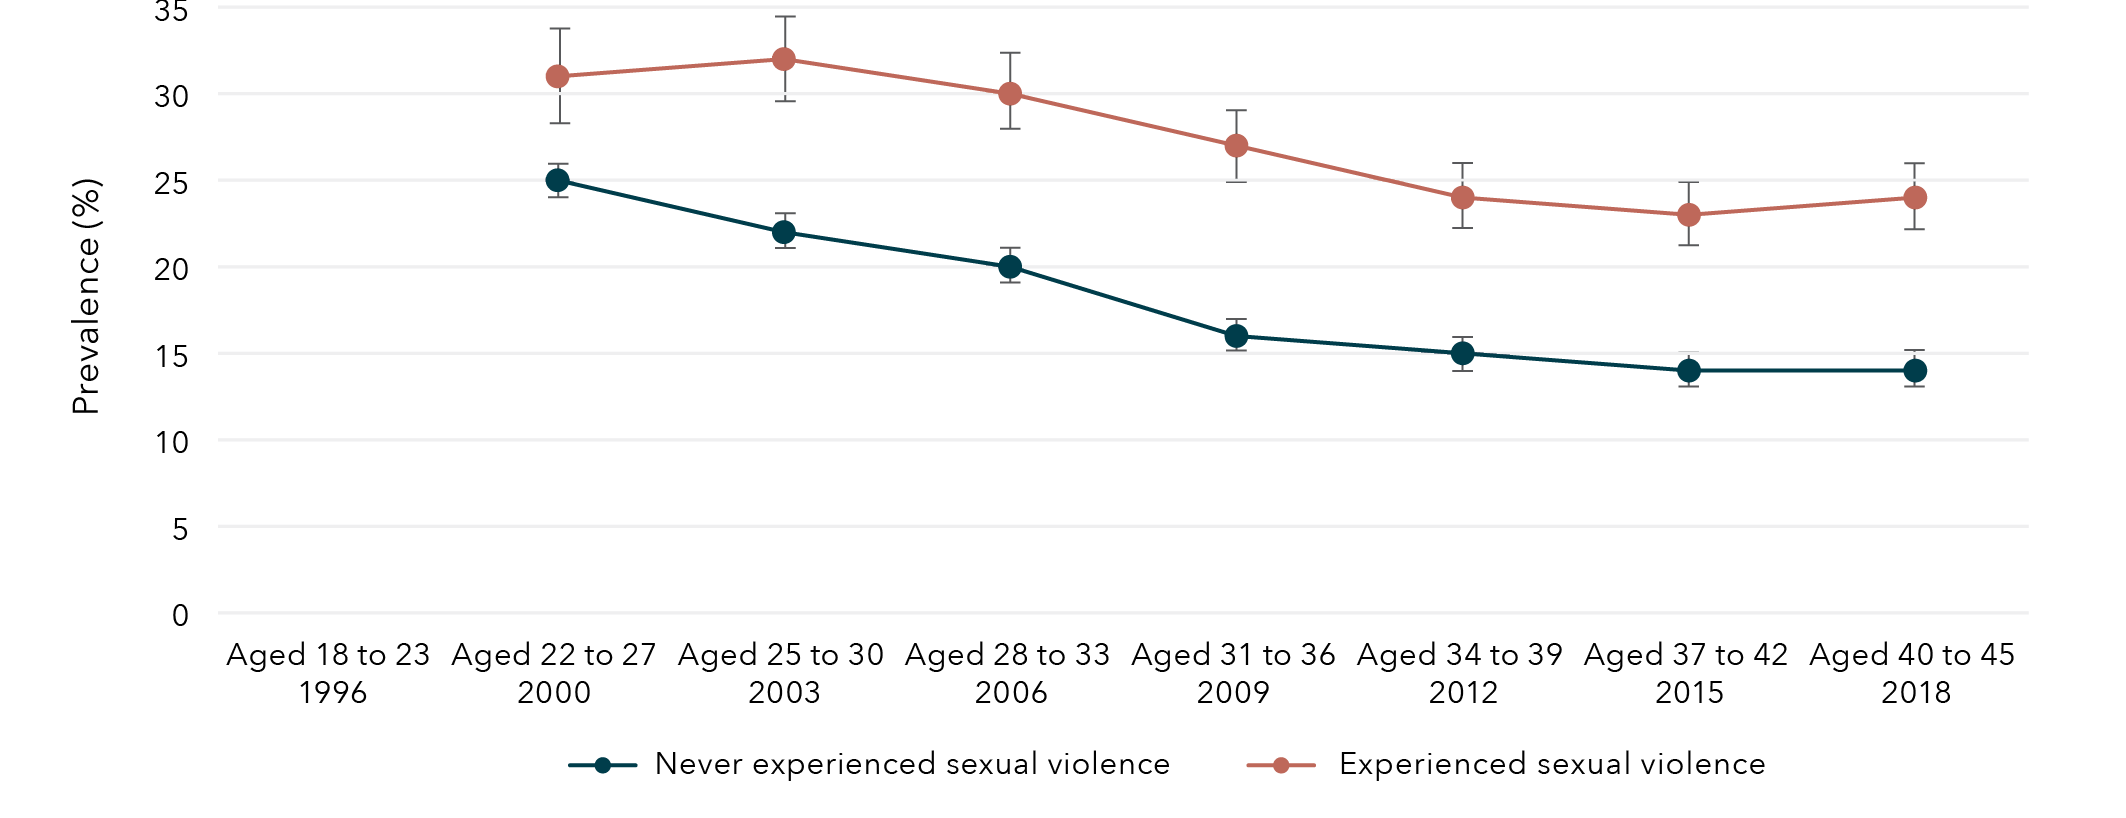
Note: Financial stress was not measured among women born 1973 to 1978 in 1996.
Data table for figure 21:
Age and year Experience with sexual violence Prevalence Lower bound Upper bound Aged 18 to 23
1996 Never experienced sexual violence No data No data No data Aged 22 to 27
2000 Never experienced sexual violence 25% 24% 26% Aged 25 to 30
2003 Never experienced sexual violence 22% 22% 23% Aged 28 to 33
2006 Never experienced sexual violence 20% 19% 21% Aged 31 to 36
2009 Never experienced sexual violence 16% 15% 17% Aged 34 to 39
2012 Never experienced sexual violence 15% 14% 15% Aged 37 to 42
2015 Never experienced sexual violence 14% 13% 15% Aged 40 to 45
2018 Never experienced sexual violence 14% 13% 15% Aged 18 to 23
1996 Experienced sexual violence No data No data No data Aged 22 to 27
2000 Experienced sexual violence 31% 28% 34% Aged 25 to 30
2003 Experienced sexual violence 32% 30% 34% Aged 28 to 33
2006 Experienced sexual violence 30% 28% 32% Aged 31 to 36
2009 Experienced sexual violence 27% 25% 29% Aged 34 to 39
2012 Experienced sexual violence 24% 22% 26% Aged 37 to 42
2015 Experienced sexual violence 23% 22% 25% Aged 40 to 45
2018 Experienced sexual violence 24% 22% 26%
Figure 22: Prevalence of high financial stress among women born in 1946 to 1951, according to whether sexual violence had been experienced
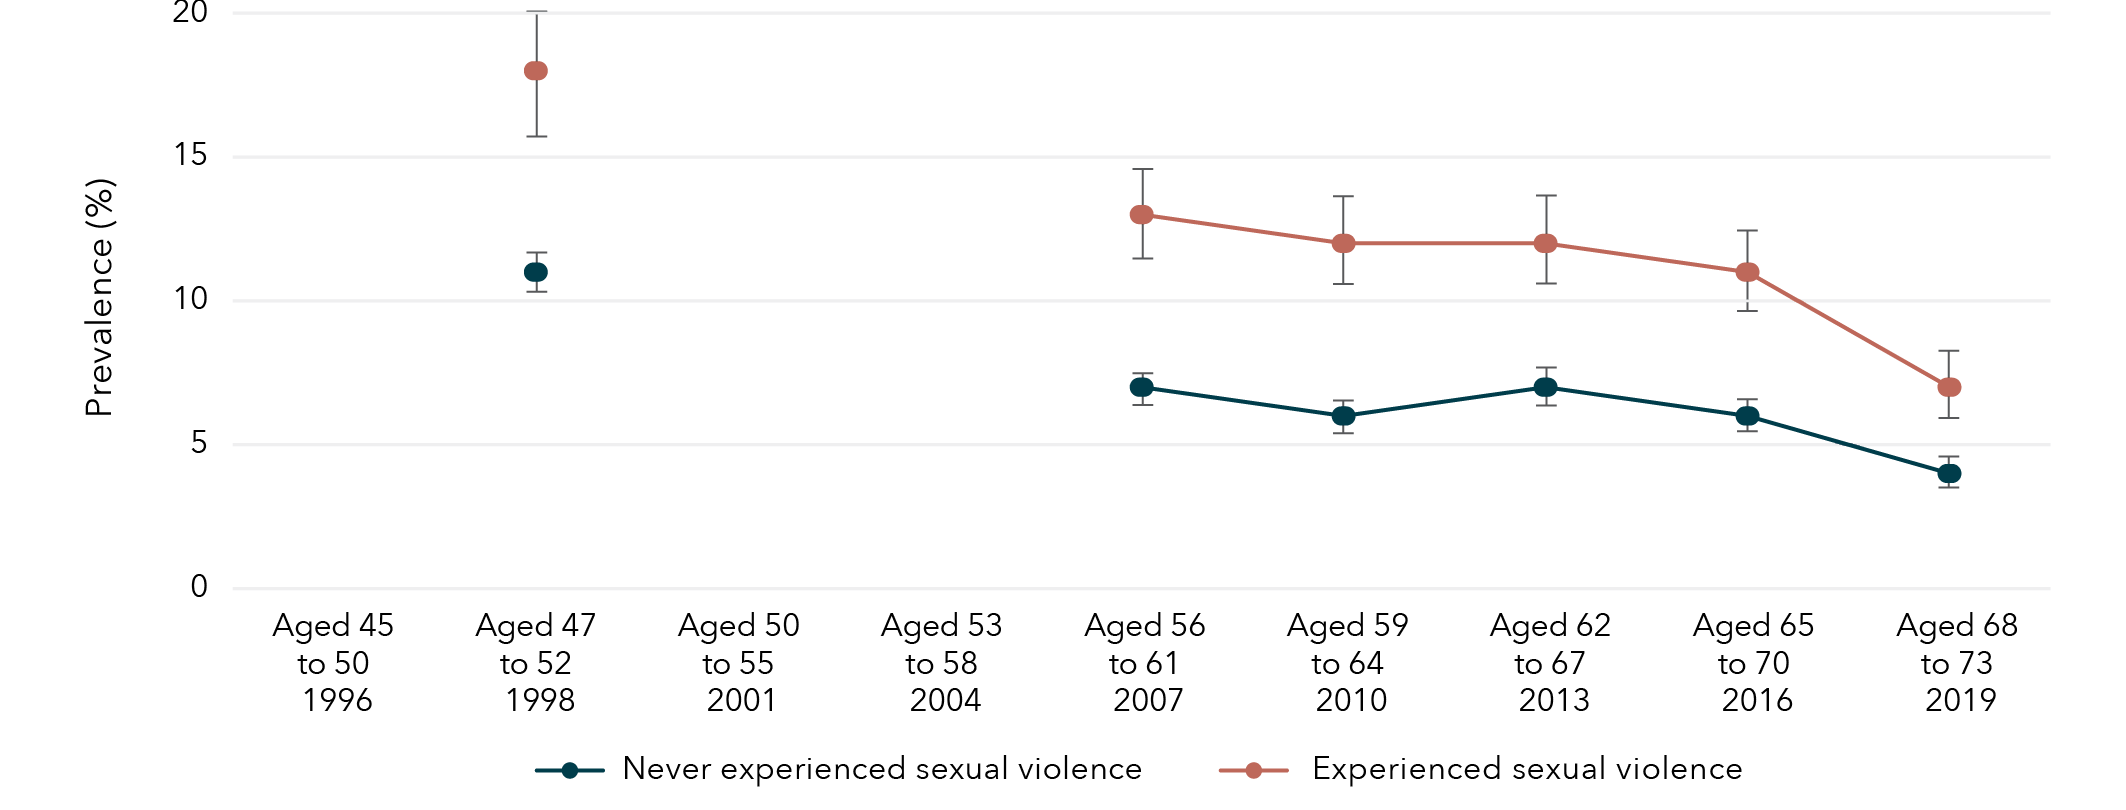
Note: Financial stress was not measured among women born 1946 to 1951 in 1996, 2001 and 2004.
Data table for figure 22:
Age and year Experience with sexual violence Prevalence Lower bound Upper bound Aged 45 to 50
1996 Never experienced sexual violence No data No data No data Aged 47 to 52
1998 Never experienced sexual violence 11% 11% 12% Aged 50 to 55
2001 Never experienced sexual violence No data No data No data Aged 53 to 58
2004 Never experienced sexual violence No data No data No data Aged 56 to 61
2007 Never experienced sexual violence 7% 6% 7% Aged 59 to 64
2010 Never experienced sexual violence 6% 6% 7% Aged 62 to 67
2013 Never experienced sexual violence 7% 6% 8% Aged 65 to 70
2016 Never experienced sexual violence 6% 5% 6% Aged 68 to 73
2019 Never experienced sexual violence 4% 3% 4% Aged 45 to 50
1996 Experienced sexual violence No data No data No data Aged 47 to 52
1998 Experienced sexual violence 18% 16% 20% Aged 50 to 55
2001 Experienced sexual violence No data No data No data Aged 53 to 58
2004 Experienced sexual violence No data No data No data Aged 56 to 61
2007 Experienced sexual violence 13% 11% 14% Aged 59 to 64
2010 Experienced sexual violence 12% 10% 13% Aged 62 to 67
2013 Experienced sexual violence 12% 10% 13% Aged 65 to 70
2016 Experienced sexual violence 11% 10% 13% Aged 68 to 73
2019 Experienced sexual violence 7% 6% 8%
Lifetime sexual violence and economic factors
Findings from the Australian Longitudinal Study on Women’s Health
Women who had experienced sexual violence were
more likely to have not completed year 12
than those who had not experienced sexual violence.
Women born 1989 to 1995 (aged 24 to 30 in 2019) who had experienced sexual violence were 63% more likely to have not completed year 12 than those who had not experienced sexual violence.
Women born 1973 to 1978 (aged 40 to 45 in 2018) who had experienced sexual violence were 46% more likely to have not completed year 12 than those who had not experienced sexual violence.
Experiences of sexual violence were associated with obtaining education beyond year 12,
however, this relationship differed by age group:
- Women born 1989 to 1995 (aged 24 to 30 in 2019) who had experienced sexual violence were 34% less likely to have obtained a qualification beyond Year 12 than those who had not experienced sexual violence.
- Women born 1946 to 1951 (aged 68 to 73 in 2019) who had experienced sexual violence were 33% more likely to have obtained a qualification beyond Year 12 than those who had not experienced sexual violence.
Across all cohorts, women who had experienced sexual violence were 30 to 45% more likely to report high financial stress* compared to those who had not experienced sexual violence.
* Risk ratios varied for women born 1989 to 1995, 1973 to 1978, and 1946 to 1951.
Chapter 4: Sexual violence and health behaviours
Sexual violence and smoking
The prevalence of current smokers among women aged 24 to 30, 40 to 45 and 68 to 73 was 13 per cent, 10 per cent and 4 per cent respectively. Women born in 1989 to 1995 and 1973 to 1978 who had experienced sexual violence were 60 per cent and 26 per cent more likely to be current smokers, respectively, compared to women who had not experienced sexual violence (Figure 23). There was little evidence of an association between sexual violence and current smoking among women born 1946 to 1951.
Figure 23: Effect estimates for association between sexual violence and current smoking

Note: Longitudinal models in Figure 23 were controlled for CALD status, age, highest qualification, area of residence, relationship status and the ability to manage on available income.
Data table for figure 23:
Risk ratio Lower limit Upper limit Born 1989 to 1995 1.60 1.52 1.66 Born 1973 to 1978 1.26 1.18 1.32 Born 1946 to 1951 1.07 0.97 1.14
Sexual violence and alcohol consumption
The prevalence of high-risk alcohol consumption among women aged 24 to 30, 40 to 45 and 68 to 73 was 3 per cent, 7 per cent and 4 per cent, respectively. Women were 16 to 73 per cent more likely to engage in high-risk alcohol consumption if they had experienced sexual violence compared to women who had not experienced sexual violence (Figure 24).
Figure 24: Effect estimates for association between sexual violence and high-risk alcohol consumption
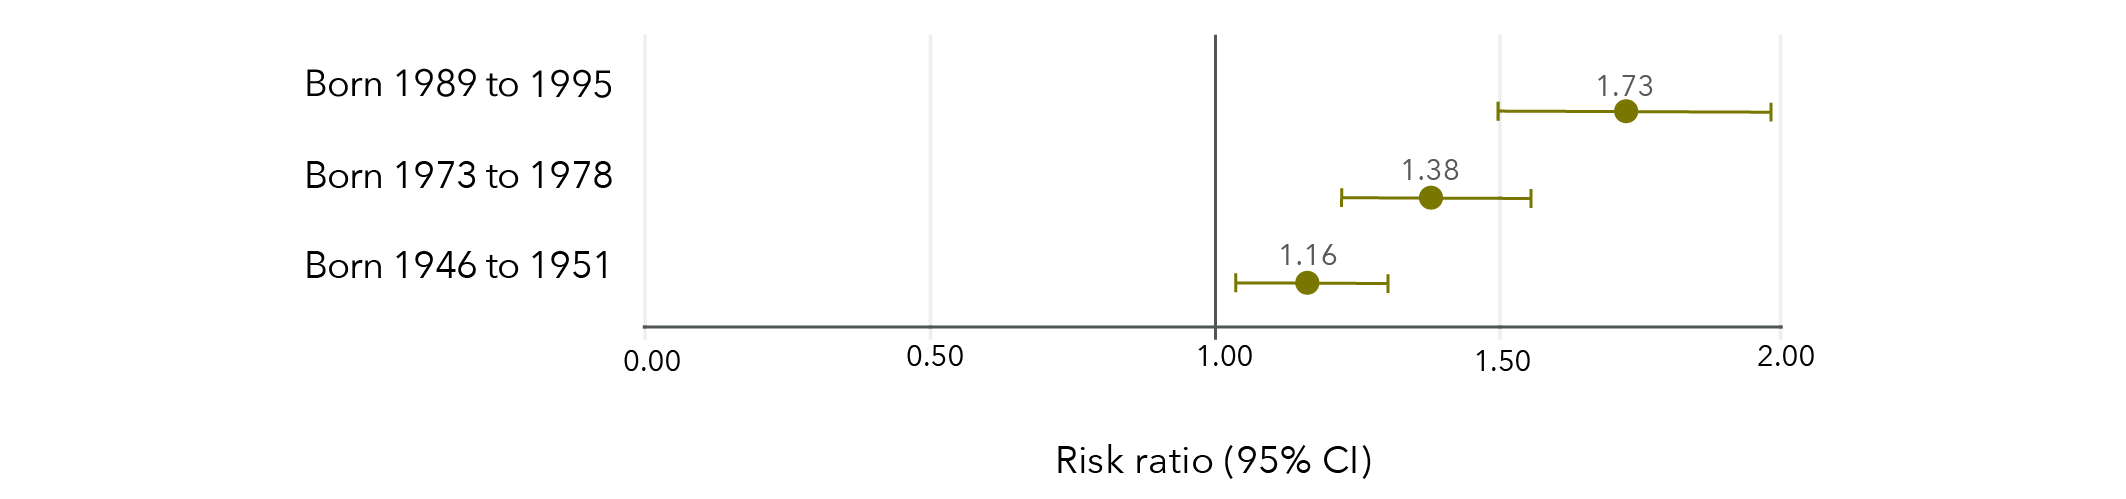
Note: Longitudinal models in Figure 24 were controlled for CALD status, age, highest qualification, area of residence, relationship status and the ability to manage on available income.
Data table for figure 24:
Risk ratio Lower limit Upper limit Born 1989 to 1995 1.73 1.50 1.98 Born 1973 to 1978 1.38 1.21 1.54 Born 1946 to 1951 1.16 1.05 1.34
Sexual violence and illicit drug use
The prevalence of illicit drug use in the last 12 months among women aged 24 to 30 and 40 to 45 was 34 per cent and 8 per cent, respectively. Women born 1989 to 1995 and 1973 to 1978 who had experienced sexual violence were approximately 30 per cent more likely to have recently used illicit drugs than women who had not experienced sexual violence (Figure 25).
Figure 25: Effect estimates for association between sexual violence and recent illicit drug use
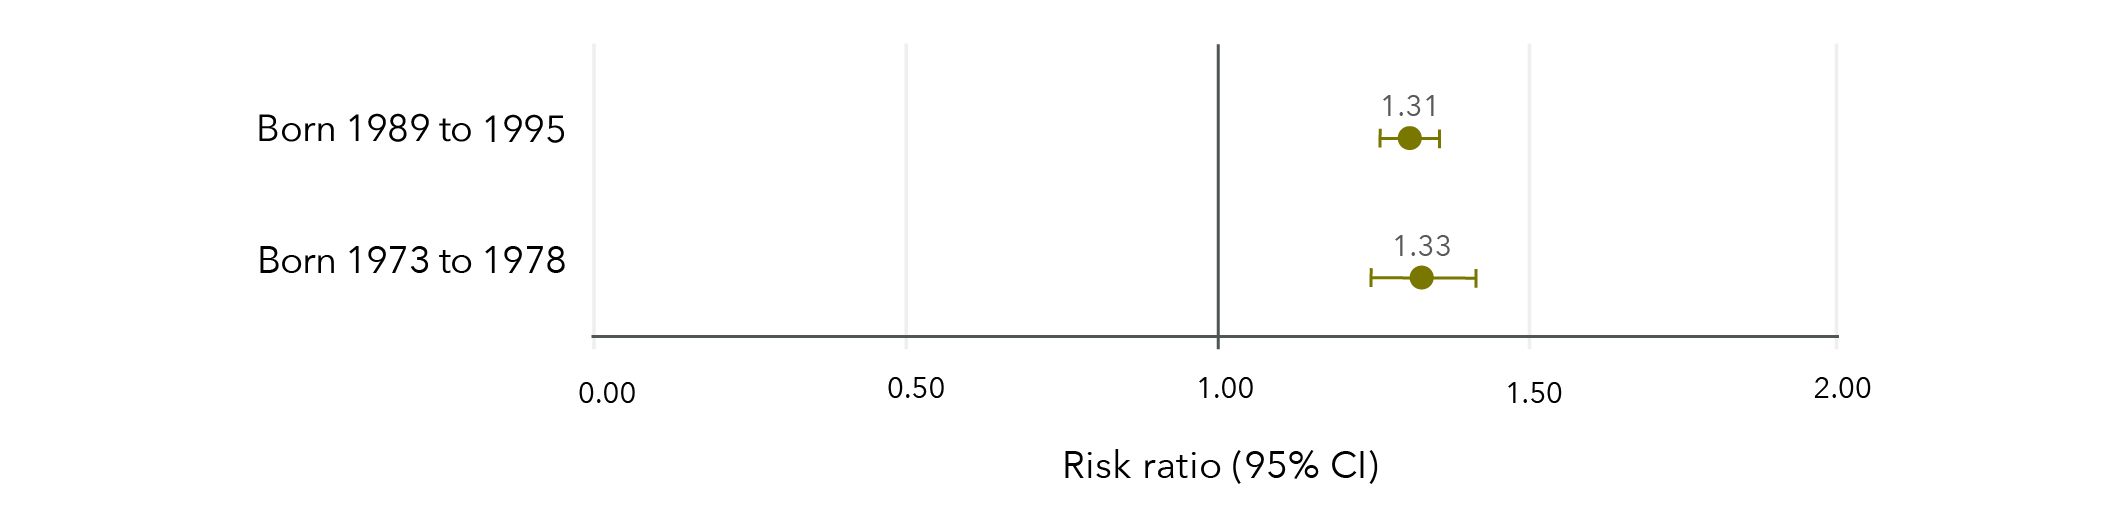
Note: Longitudinal models in Figure 25 were controlled for CALD status, age, highest qualification, area of residence, relationship status and the ability to manage on available income.
Data table for figure 25:
Risk ratio Lower limit Upper limit Born 1989 to 1995 1.31 1.27 1.35 Born 1973 to 1978 1.33 1.24 1.42
Sexual violence and physical activity
The prevalence of high levels of physical activity among women aged 24 to 30, 40 to 45 and 68 to 73 was 64 per cent, 50 per cent and 55 per cent, respectively. Women born in 1989 to 1995 and 1973 to 1978 were approximately 3 per cent less likely to report high levels of physical activity if they had experienced sexual violence compared to women who had not experienced sexual violence (Figure 26). There was no evidence of an association between experiencing sexual violence and physical activity among women born 1946 to 1951.
Figure 26: Effect estimates for association between sexual violence and high levels of physical activity
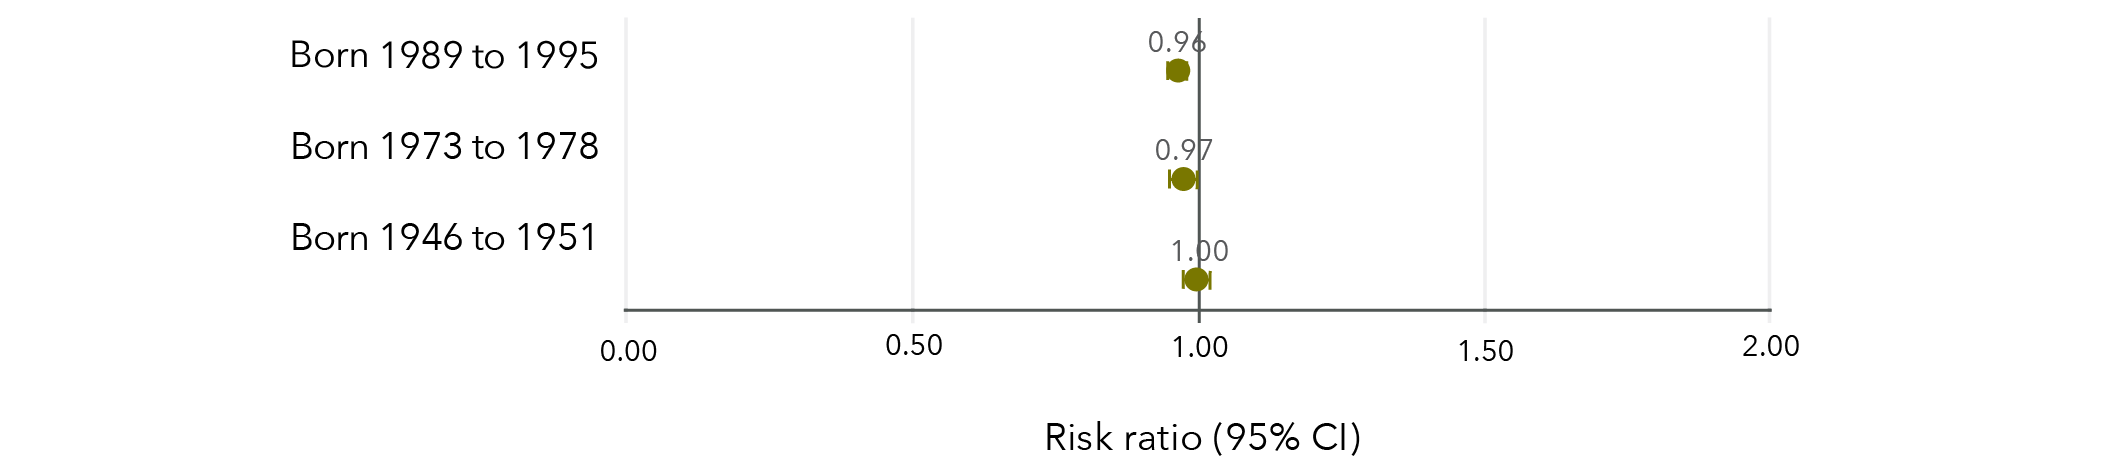
Note: Longitudinal models in Figure 26 were controlled for CALD status, age, highest qualification, area of residence, relationship status and the ability to manage on available income.
Data table for figure 26:
Risk ratio Lower limit Upper limit Born 1989 to 1995 0.96 0.95 0.97 Born 1973 to 1978 0.97 0.95 0.99 Born 1946 to 1951 1.00 0.98 1.02
Sexual violence and obesity
In each cohort, around one in four women were obese (BMI ≥30 kg/m 2), with 21 per cent of women aged 24 to 30, 29 per cent of women aged 40 to 45 and 25 per cent of women aged 68 to 73 classified as obese. Women born 1989 to 1995 and 1973 to 1978 were approximately 15 per cent more likely to be obese if they had experienced sexual violence compared to those who had not experienced sexual violence (Figure 27).
Figure 27: Effect estimates of the association between experiencing sexual violence and obesity
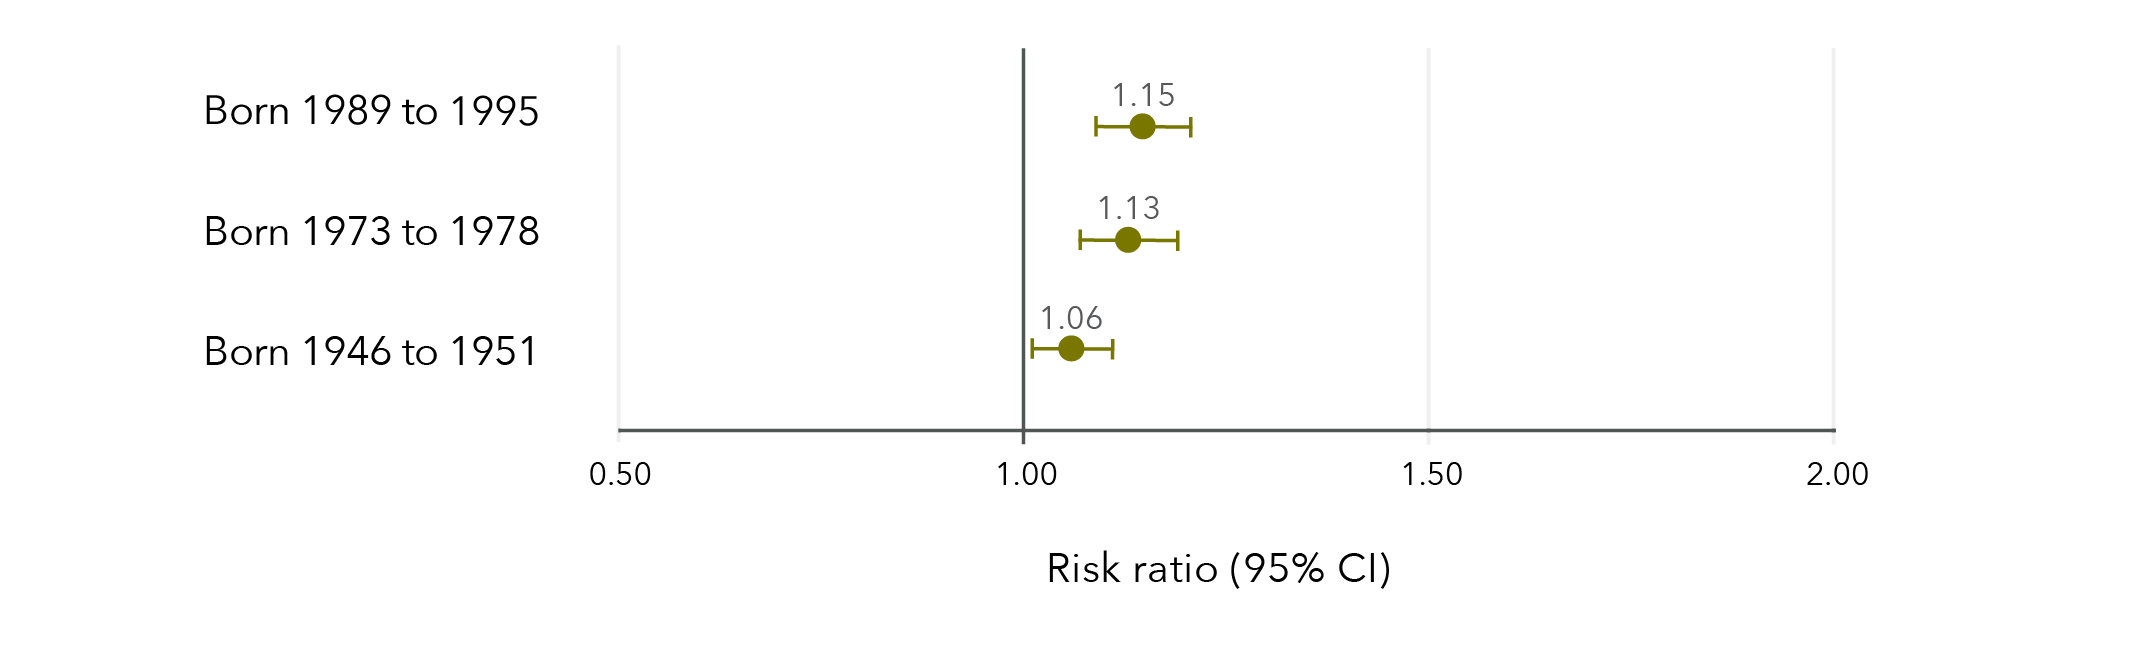
Note: Longitudinal models in Figure 27 were controlled for CALD status, age, highest qualification, area of residence, relationship status and ability to manage on available income.
Data table for figure 27:
Risk ratio Lower limit Upper limit Born 1989 to 1995 1.15 1.09 1.21 Born 1973 to 1978 1.13 1.07 1.19 Born 1946 to 1951 1.06 1.01 1.11
Sexual violence and health screening
Cervical cancer screening
Women aged 40 to 45 were the most likely to have had cervical screening in the previous two years (68%), followed by women aged 24 to 30 (57%) and those aged 68 to 73 (43%).
Women born in 1989 to 1995 who had experienced sexual violence were slightly more likely to have had a cervical cancer screening test in the last two years than those who had not experienced sexual violence (Figure 28). Conversely, women born 1946 to 1951 were slightly less likely to have had cervical cancer screening in the previous two years if they had experienced sexual violence compared to those who had not experienced sexual violence. There was no evidence of an effect among women born 1973 to 1978.
Figure 28: Effect estimates of the association between experiencing sexual violence and adherence to cervical cancer screening guidelines
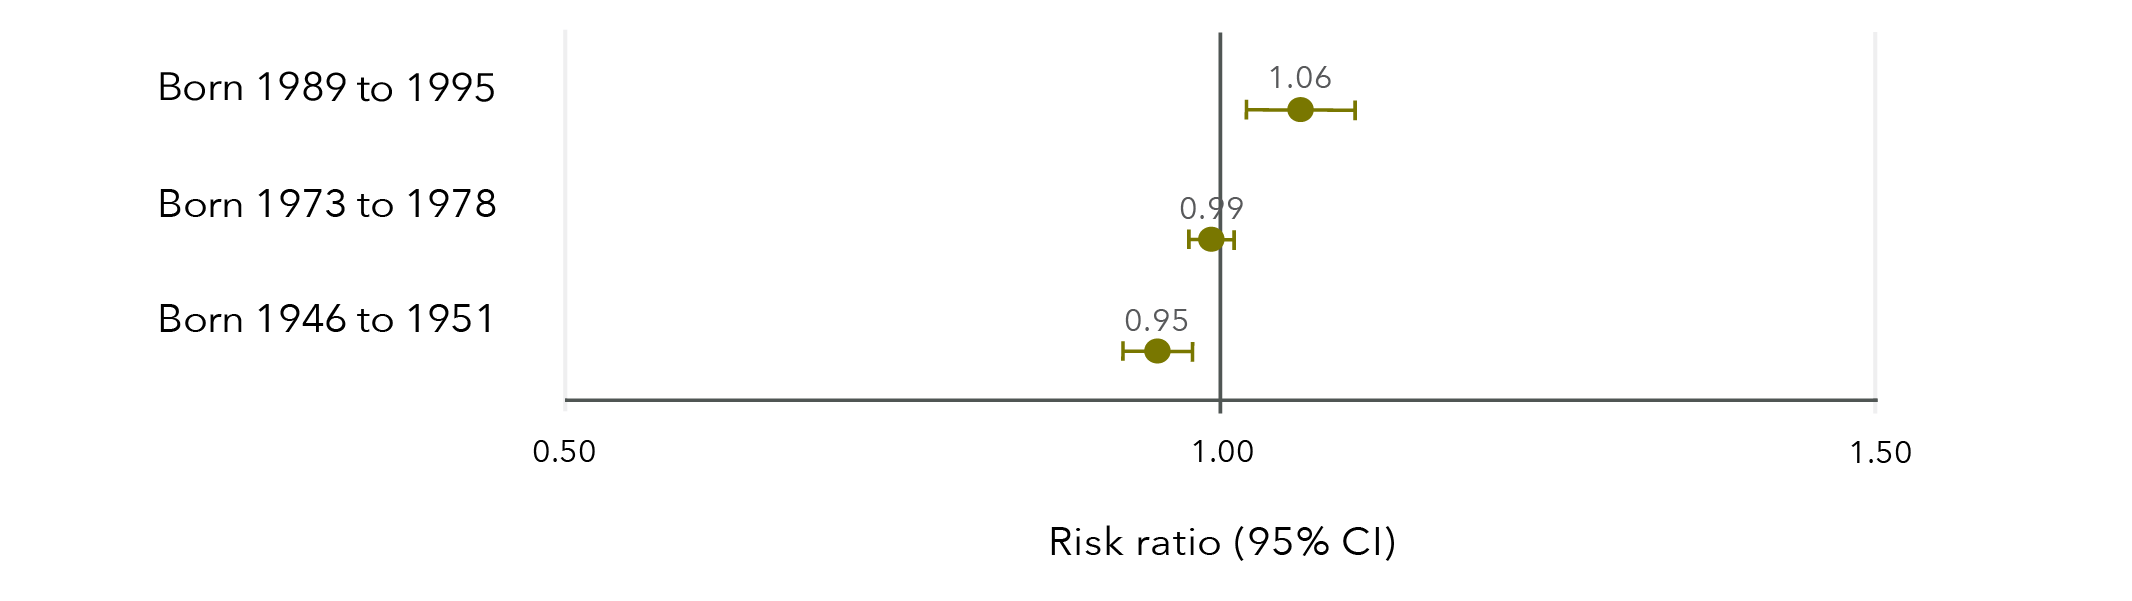
Note: Longitudinal models in Figure 28 were controlled for CALD status, age, highest qualification, area of residence, relationship status and ability to manage on available income. Similar results were obtained when women who reported having had a hysterectomy were excluded from the cervical cancer screening models.
Data table for figure 28:
Risk ratio Lower limit Upper limit Born 1989 to 1995 1.06 1.02 1.10 Born 1973 to 1978 0.99 0.98 1.01 Born 1946 to 1951 0.95 0.93 0.98
Breast cancer screening
Four in five (80%) women aged 68 to 73 reported having had a mammogram in the previous two years. Women born 1946 to 1951 were slightly less likely to have had a mammogram in the last two years if they had experienced sexual violence compared to women who had not experienced sexual violence (risk ratio=0.98, 95% CI=0.96, 1.00).
Sexual violence and health behaviours
Findings from the Australian Longitudinal Study on Women’s Health
Women born 1989 to 1995 (aged 24 to 30 in 2019), 1973 to 1978 (aged 40 to 45 in 2018), and 1946 to 1951 (aged 68 to 73 in 2019) who had experienced sexual violence were
16 to 73% more likely to engage in high-risk alcohol consumption*
compared to those who had not experienced sexual violence.
Women born 1989 to 1995 (aged 24 to 30 in 2019) and 1973 to 1978 (aged 40 to 45 in 2018)
who had experienced sexual violence were:
- 26 to 60% more likely to be current smokers.
- 30% more likely to have recently used illicit drugs*.
- 3% less likely to report high levels of physical activity*.
- 15% more likely to be obese (BMI≥30 kg/m2)*.
compared to those who had not experienced sexual violence.
* Risk ratios varied for women born 1989 to 1995, 1973 to 1978, and 1946 to 1951.
Chapter 5: Sexual violence and health
Sexual violence and general health
Around three in 20 women across all three cohorts reported fair or poor health, with 15 per cent of women aged 24 to 30, 11 per cent of women aged 40 to 45 and 15 per cent of women aged 68 to 73 reporting fair or poor health. Women who had experienced sexual violence were more likely to report fair or poor health compared to those who had not experienced sexual violence (Figure 29). Women were between 18 and 47 per cent more likely to report fair or poor health if they had experienced sexual violence, compared to women who had not experienced sexual violence.
Figure 29: Effect estimates of the association between sexual violence and fair or poor general health
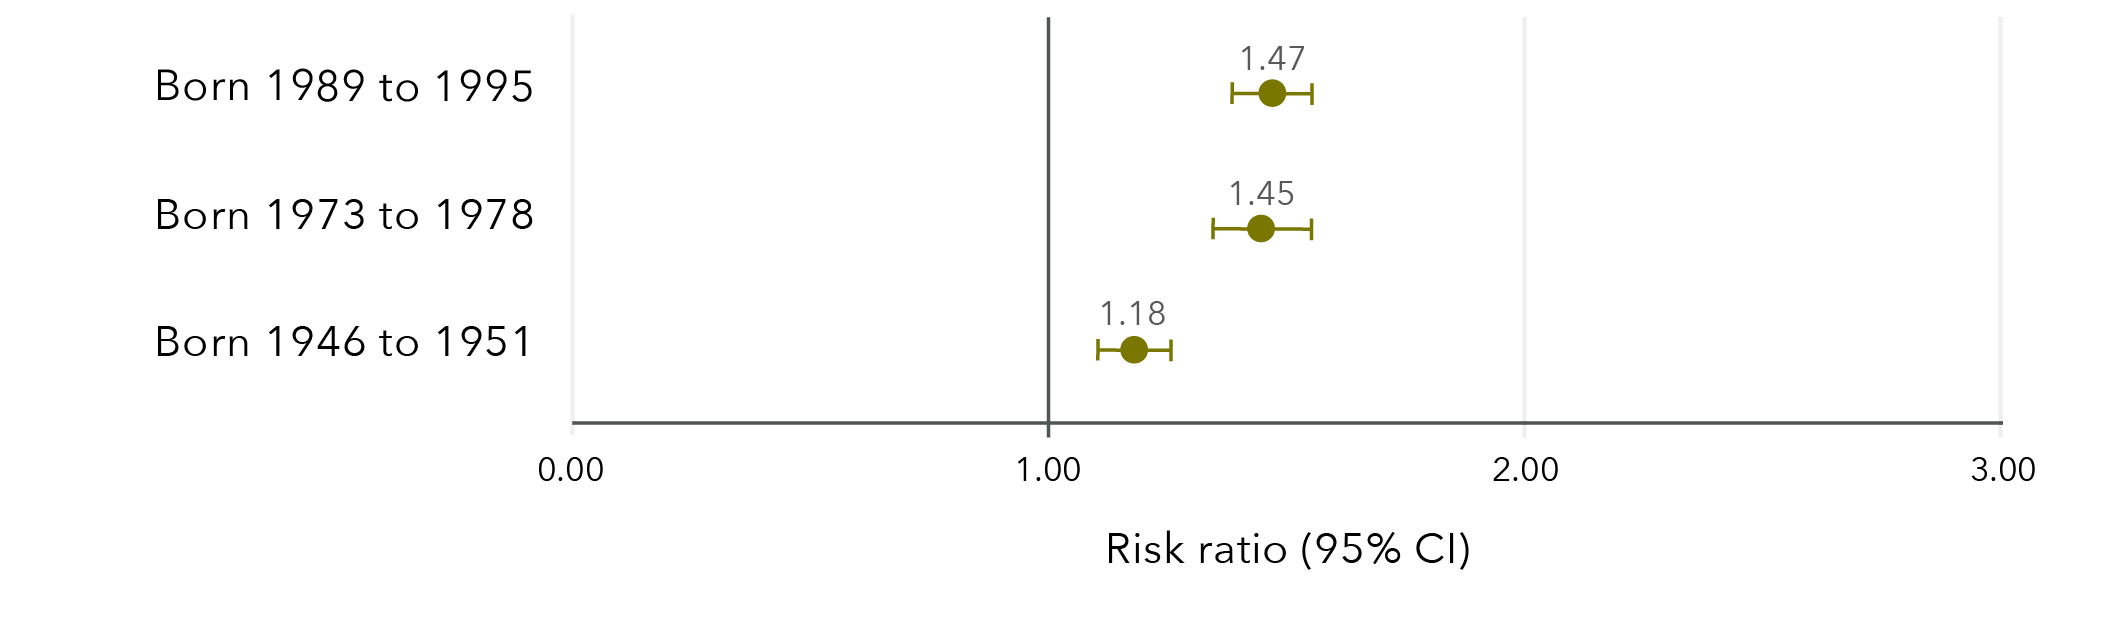
Note: Longitudinal models in Figure 29 were controlled for CALD status, age, highest qualification, area of residence, relationship status and ability to manage on available income.
Data table for figure 29:
Risk ratio Lower limit Upper limit Born 1989 to 1995 1.47 1.39 1.55 Born 1973 to 1978 1.45 1.35 1.55 Born 1946 to 1951 1.18 1.11 1.26
Women who had experienced sexual violence were more likely to have two or more physical conditions, such as diabetes, reproductive health conditions, asthma and heart disease. Among women aged 24 to 30, 13 per cent who had experienced sexual violence reported two or more physical conditions, compared to 8 per cent of women who had not experienced sexual violence. Among women aged 40 to 45 and 68 to 73, these values were 5 and 2 per cent and 22 and 13 per cent, respectively. Details on the physical conditions measured are included in the “Methods” section.
Sexual violence and bodily pain
Around one in 10 women reported high levels of bodily pain, with 7 per cent of women aged 21 to 27 and 40 to 45 and 12 per cent of women aged 68 to 73 reporting high levels of bodily pain. Women were between 23 and 67 per cent more likely to report high levels of bodily pain if they had experienced sexual violence compared to those who had not experienced sexual violence (Figure 30).
Figure 30: Effect estimates of the association between sexual violence and high levels of bodily pain
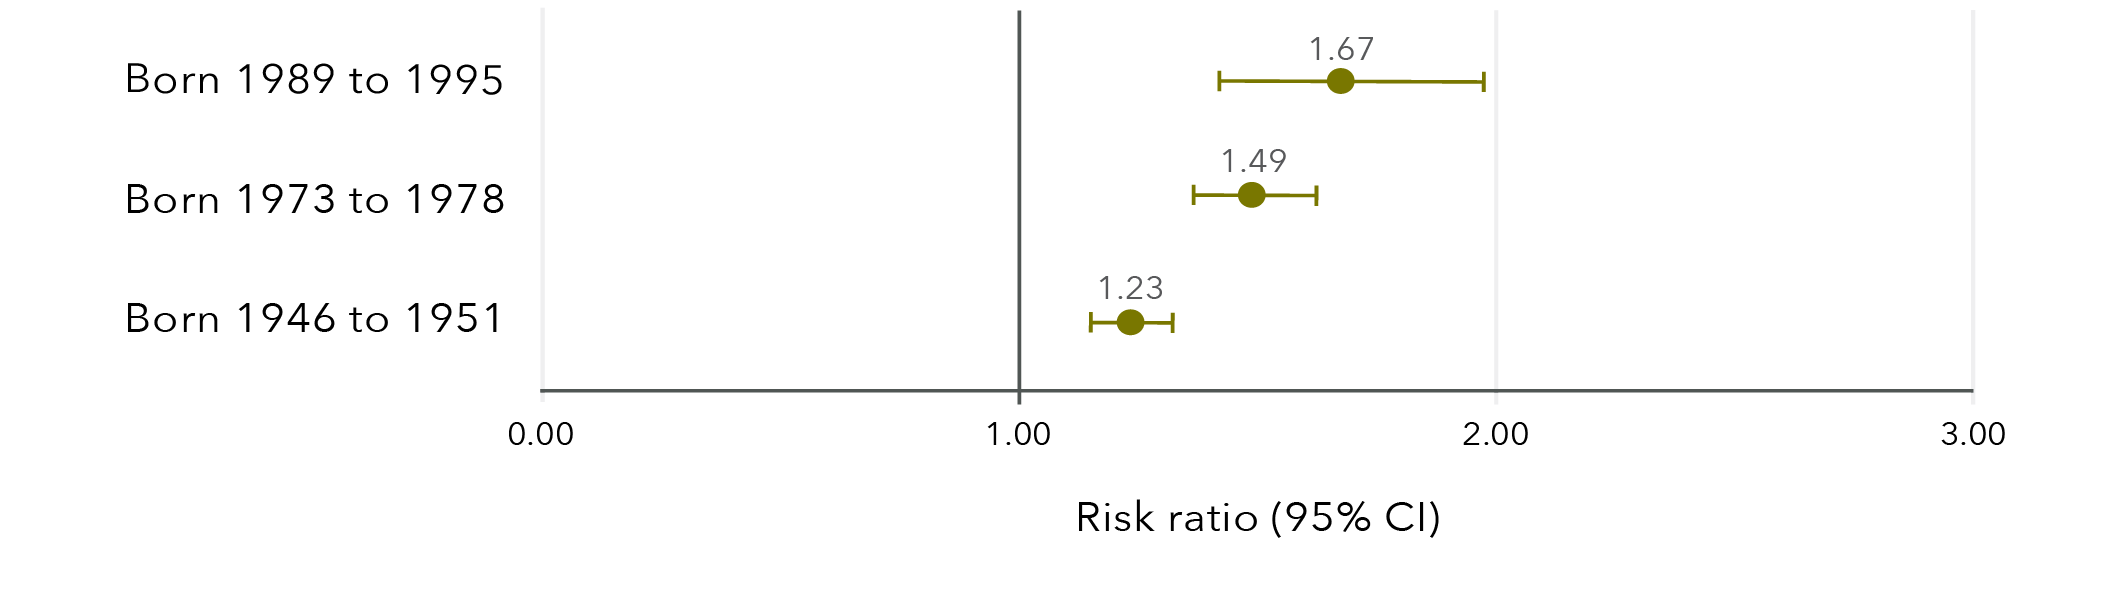
Note: Models in Figure 30 were controlled for CALD status, age, highest qualification, area of residence, relationship status and ability to manage on available income.
Data table for figure 30:
Risk ratio Lower limit Upper limit Born 1989 to 1995 1.67 1.42 1.97 Born 1973 to 1978 1.49 1.36 1.62 Born 1946 to 1951 1.23 1.15 1.32
Sexual violence and sexually transmitted infections
Less than 1 per cent of women aged 24 to 30, 40 to 45 and 68 to 73, respectively, reported a recent STI. Women were 42 to 84 per cent more likely to report a recent STI if they had experienced sexual violence compared to those who had not experienced sexual violence (Figure 31).
Figure 31: Effect estimates of the association between sexual violence and a recent STI
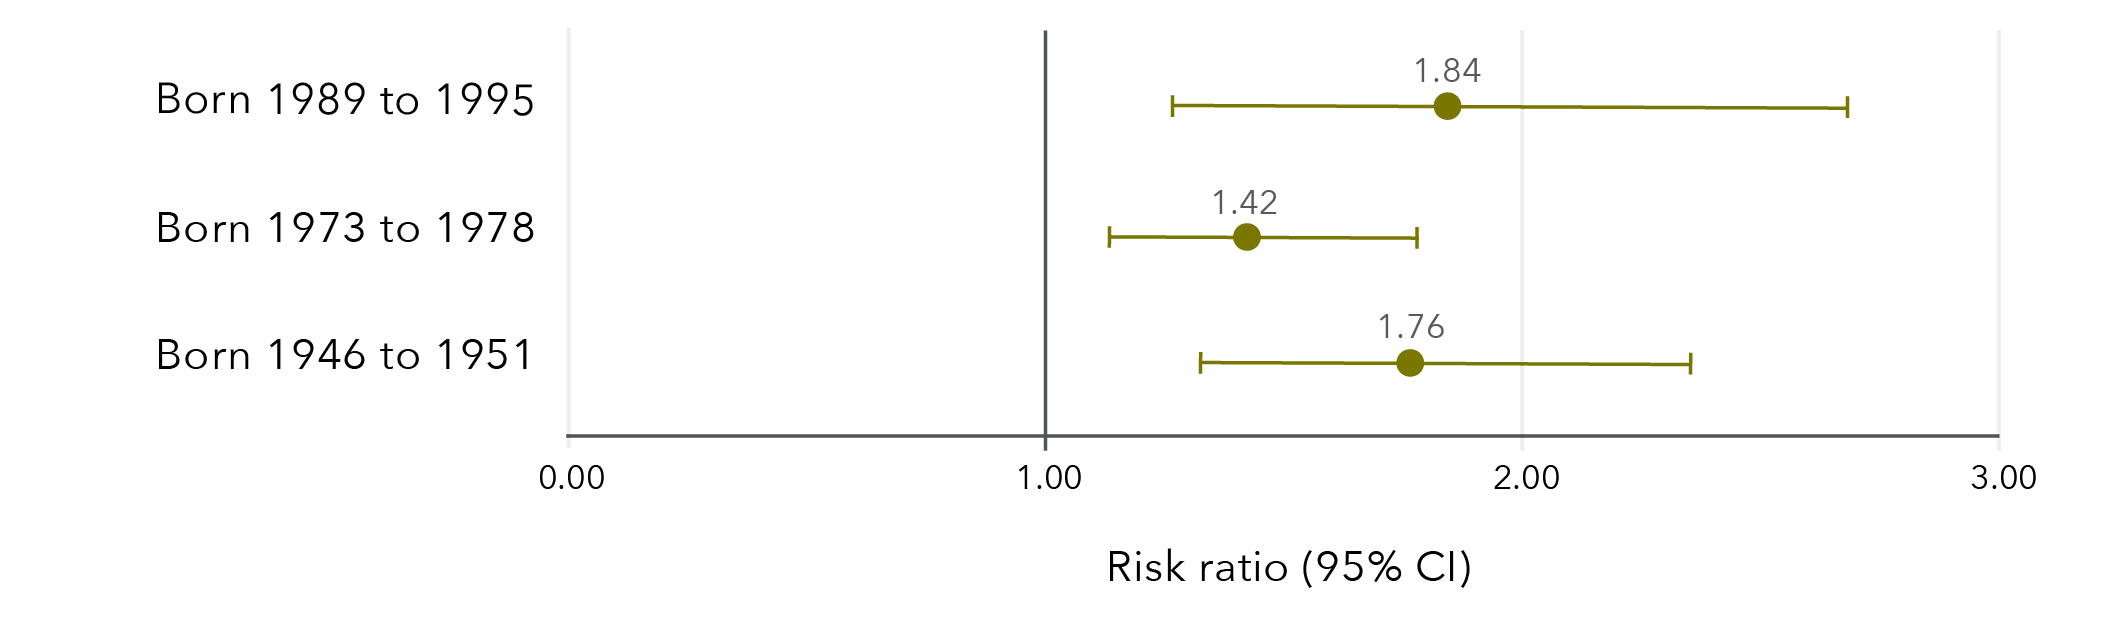
Note: Longitudinal models in Figure 31 were controlled for CALD status, age, highest qualification, area of residence, relationship status and ability to manage on available income. Due to the low frequencies of a recent STI, there is substantial uncertainty around these effect estimates.
Data table for figure 31:
Risk ratio Lower limit Upper limit Born 1989 to 1995 1.84 1.26 2.68 Born 1973 to 1978 1.42 1.13 1.78 Born 1946 to 1951 1.76 1.32 2.35
Sexual violence and depression
Recent diagnosis of and/or treatment for depression was more common in younger women than older women, with 27 per cent of women aged 24 to 30, 16 per cent of women aged 40 to 45 and 10 per cent of women aged 68 to 73 reporting a recent diagnosis of and/or treatment for depression. Women were 39 to 62 per cent more likely to report a recent diagnosis of and/or treatment for depression if they had experienced sexual violence compared to those who had not experienced sexual violence (Figure 32).
Figure 32: Effect estimates of the association between sexual violence and depression
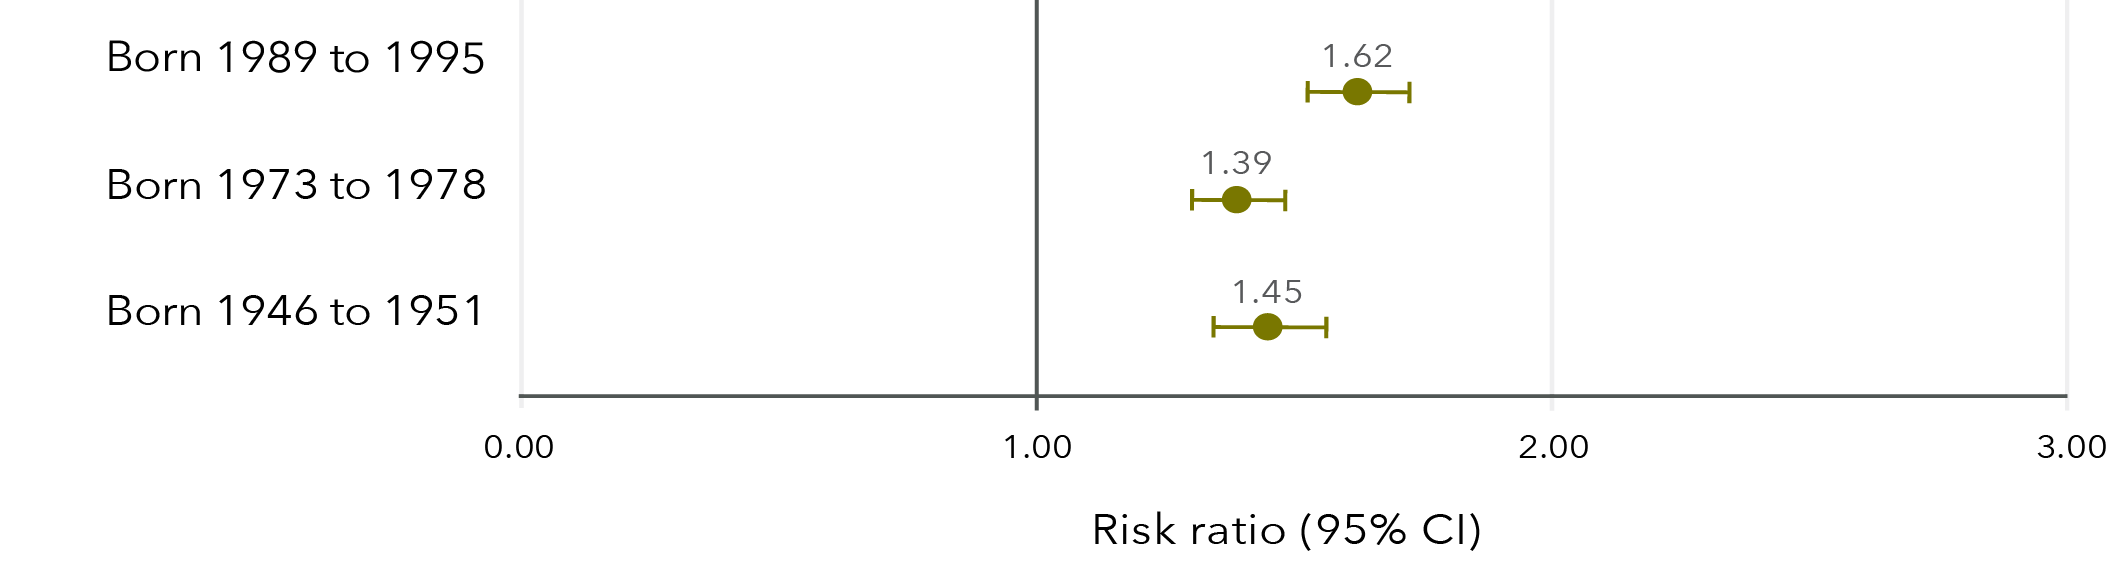
Note: Longitudinal models in Figure 32 were controlled for CALD status, age, highest qualification, area of residence, relationship status and ability to manage on available income.
Data table for figure 32:
Risk ratio Lower limit Upper limit Born 1989 to 1995 1.62 1.53 1.73 Born 1973 to 1978 1.39 1.30 1.48 Born 1946 to 1951 1.45 1.34 1.56
Sexual violence and anxiety
Younger women were more likely to report a recent diagnosis of and/or treatment for anxiety than older women, with 31 per cent of women aged 24 to 30, 13 per cent of women aged 40 to 45 and 10 per cent of women aged 68 to 73 reporting a recent diagnosis and/or treatment. Women were approximately 50 per cent more likely to report a recent diagnosis of and/or treatment for anxiety if they had experienced sexual violence compared to those who had not experienced sexual violence (Figure 33).
Figure 33: Effect estimates of the association between sexual violence and anxiety
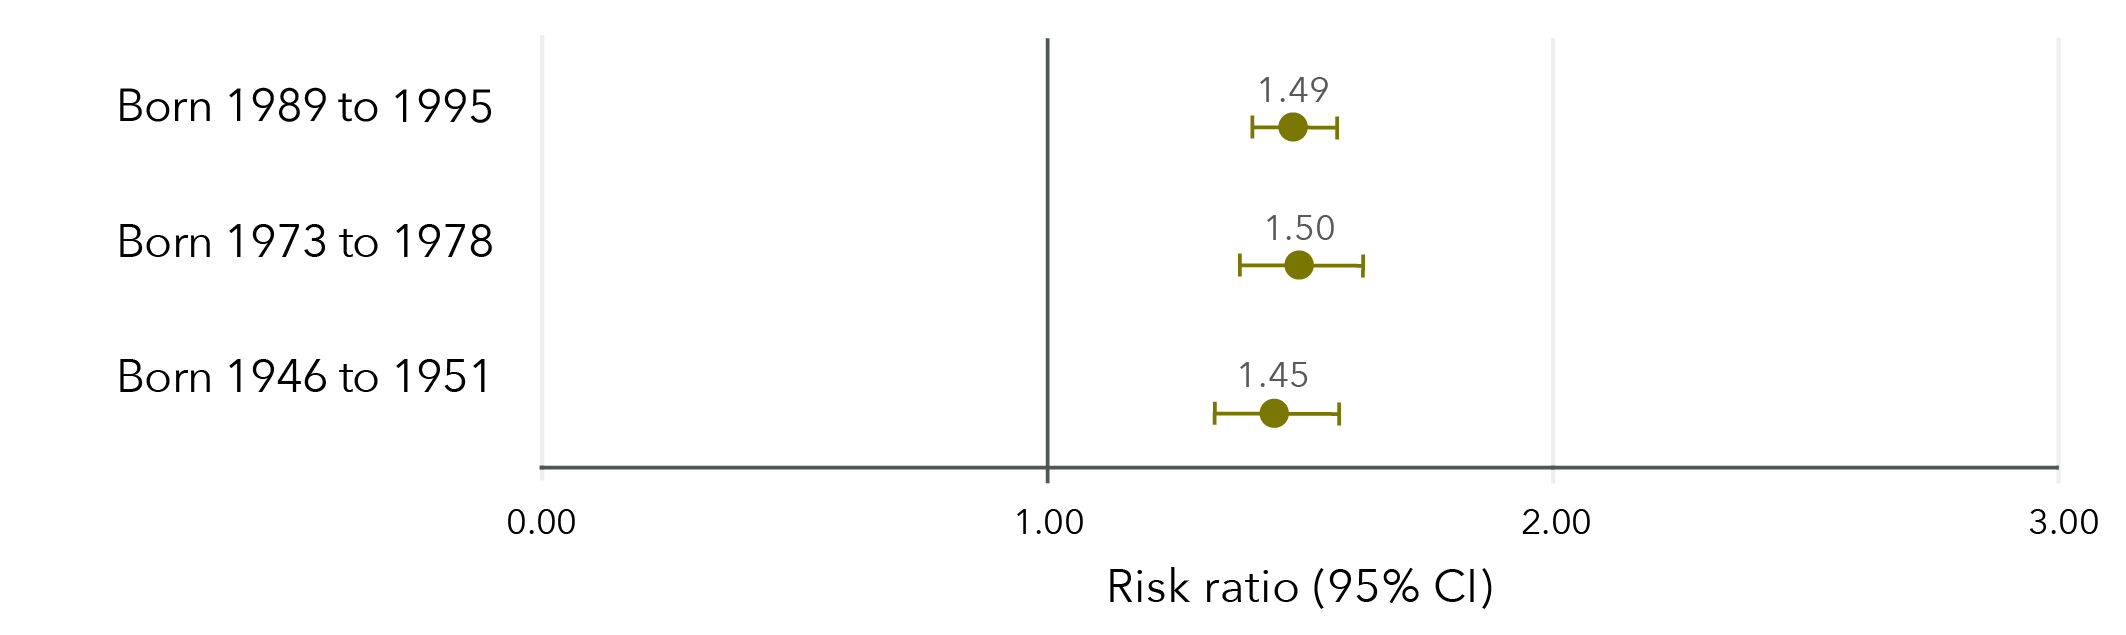
Note: Longitudinal models in Figure 33 were controlled for CALD status, age, highest qualification, area of residence, relationship status and ability to manage on available income.
Data table for figure 33:
Risk ratio Lower limit Upper limit Born 1989 to 1995 1.49 1.40 1.57 Born 1973 to 1978 1.50 1.38 1.62 Born 1946 to 1951 1.45 1.33 1.58
Sexual violence and stress
Younger women were more likely than older women to report high levels of stress, with 41 per cent of women aged 24 to 30, 30 per cent of women aged 40 to 45 and 6 per cent of women aged 68 to 73 reporting high levels of stress. Women were 29 to 51 per cent more likely to report high levels of stress if they had experienced sexual violence compared to those who had not experienced sexual violence (Figure 34).
Figure 34: Effect estimates of the association between sexual violence and high levels of stress
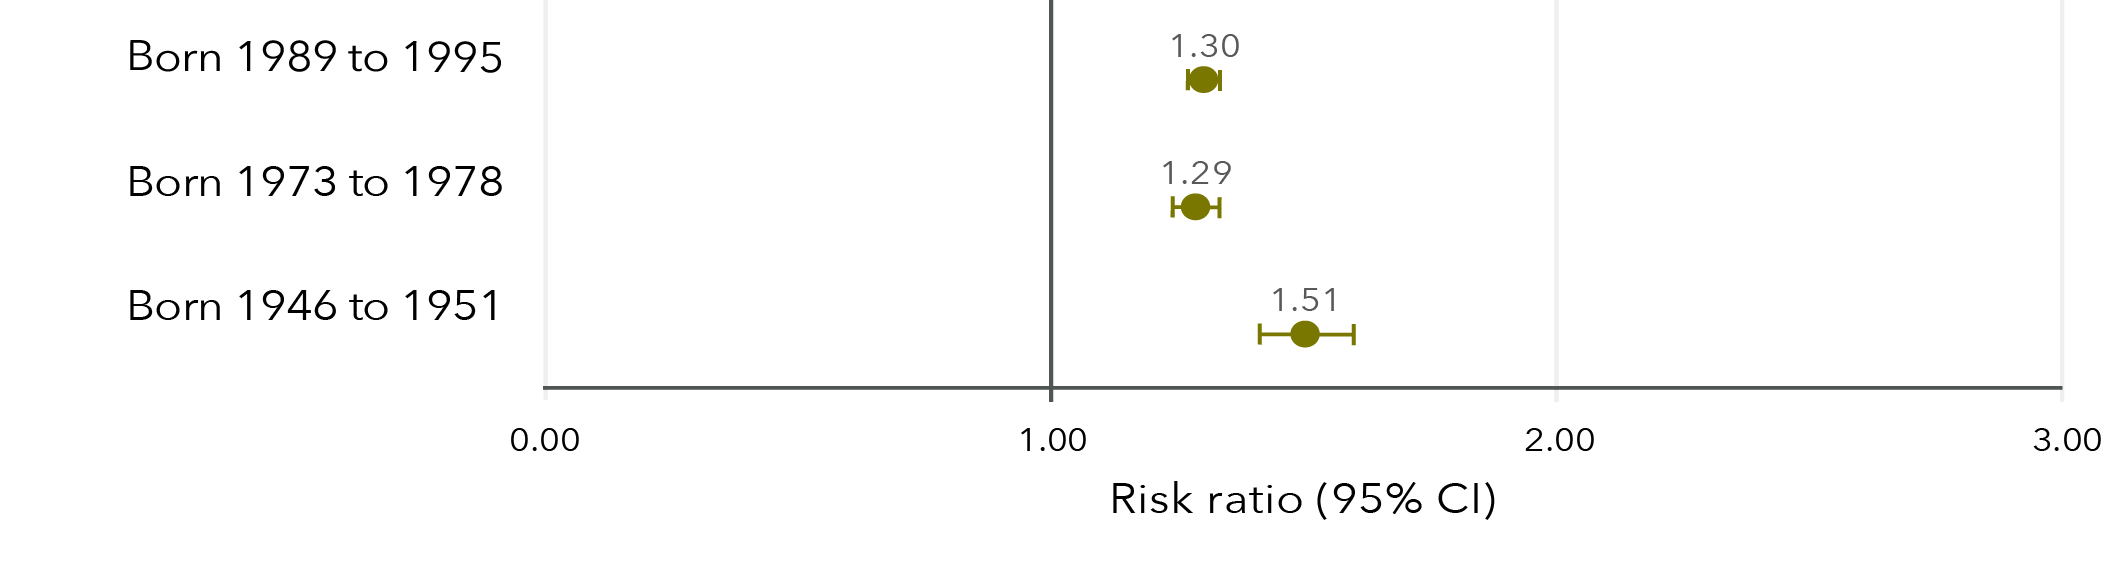
Note: Longitudinal models in Figure 34 were controlled for CALD status, age, highest qualification, area of residence, relationship status and ability to manage on available income.
Data table for figure 34:
Risk ratio Lower limit Upper limit Born 1989 to 1995 1.30 1.27 1.34 Born 1973 to 1978 1.29 1.24 1.34 Born 1946 to 1951 1.51 1.42 1.60
Sexual violence and psychological distress
In 2019 to 2020, 41 per cent of women aged 24 to 30 reported high levels of psychological distress. Women born 1989 to 1995 who had had experienced sexual violence were 34 per cent more likely to report high levels of psychological distress compared to those who had not experienced sexual violence (95% CI=1.31, 1.38). This longitudinal model was controlled for CALD status, age, highest qualification, area of residence, relationship status and ability to manage on available income. Psychological distress was only measured among women born 1989 to 1995.
Sexual violence and health
Findings from the Australian Longitudinal Study on Women’s Health
Compared to those who had not experienced sexual violence,
women who had experienced sexual violence were:
- 18 to 47% more likely to report fair or poor health*.
- 23 to 67% more likely to report high levels of bodily pain*.
- 42 to 84% more likely to report a recent sexually transmitted infection*.
Compared to those who had not experienced sexual violence,
women who had experienced sexual violence were:
- 39 to 62% more likely to report a recent diagnosis of and/or treatment for depression*.
- ~50% more likely to report a recent diagnosis of and/or treatment for anxiety*.
- 29 to 51% more likely to report high levels of stress*.
Compared to those who had not experienced sexual violence,
women born 1989 to 1995 who had experienced sexual violence were
34% more likely to report high levels of psychological distress**.
* Risk ratios varied for women born 1989 to 1995, 1973 to 1978, and 1946 to 1951.
** Psychological distress was only measured in the 1989 to 1995 cohort.
Chapter 6: Sexual violence and health services
Use of health services was captured through data linkage with the MBS and the PBS. More than 99 per cent of women claimed at least one service through MBS each year, with many women (more than 90%) having at least one non-referred consultation, such as a consultation with a general practitioner or registered doctor. Similarly, many women claimed prescriptions each year, with over 35 per cent of younger women and over 70 per cent of older women claiming at least one government-subsidised PBS medication script annually.
All costs in Chapter 6 are government-subsidised costs and do not include out-of-pocket costs. Medicare services and PBS medication scripts that did not attract a government subsidy were excluded from analysis. All average costs presented in Chapter 6 are marginal predicted means from generalised estimating equations that account for within-subject correlation.
Sexual violence and cost of services subsidised by Medicare
The predicted average annual costs for women born in 1989 to 1995 who had experienced sexual violence were between $200 (2013 to 2014 financial year) and $268 (2018 to 2019 financial year) higher than the predicted average annual costs for those who had not experienced sexual violence (Figure 35).
Among women born in 1973 to 1978, the predicted average annual costs in the 1999 to 2000 financial year were $32 higher for those who had experienced sexual violence compared to those who had not. From 2012 onwards, the difference was more apparent, with predicted average annual costs for women who had experienced sexual violence between $82 (2011 to 2012 financial year) and $85 (2017 to 2018 financial year) higher than for those who had not experienced sexual violence.
There were no meaningful differences in predicted average annual costs over time among women born in 1946 to 1951 between those who had and had not experienced sexual violence.
Figure 35: Predicted average annual cost of Medicare services for women born in 1989 to 1995, 1973 to 1978 and 1946 to 1951, according to whether sexual violence had been experienced
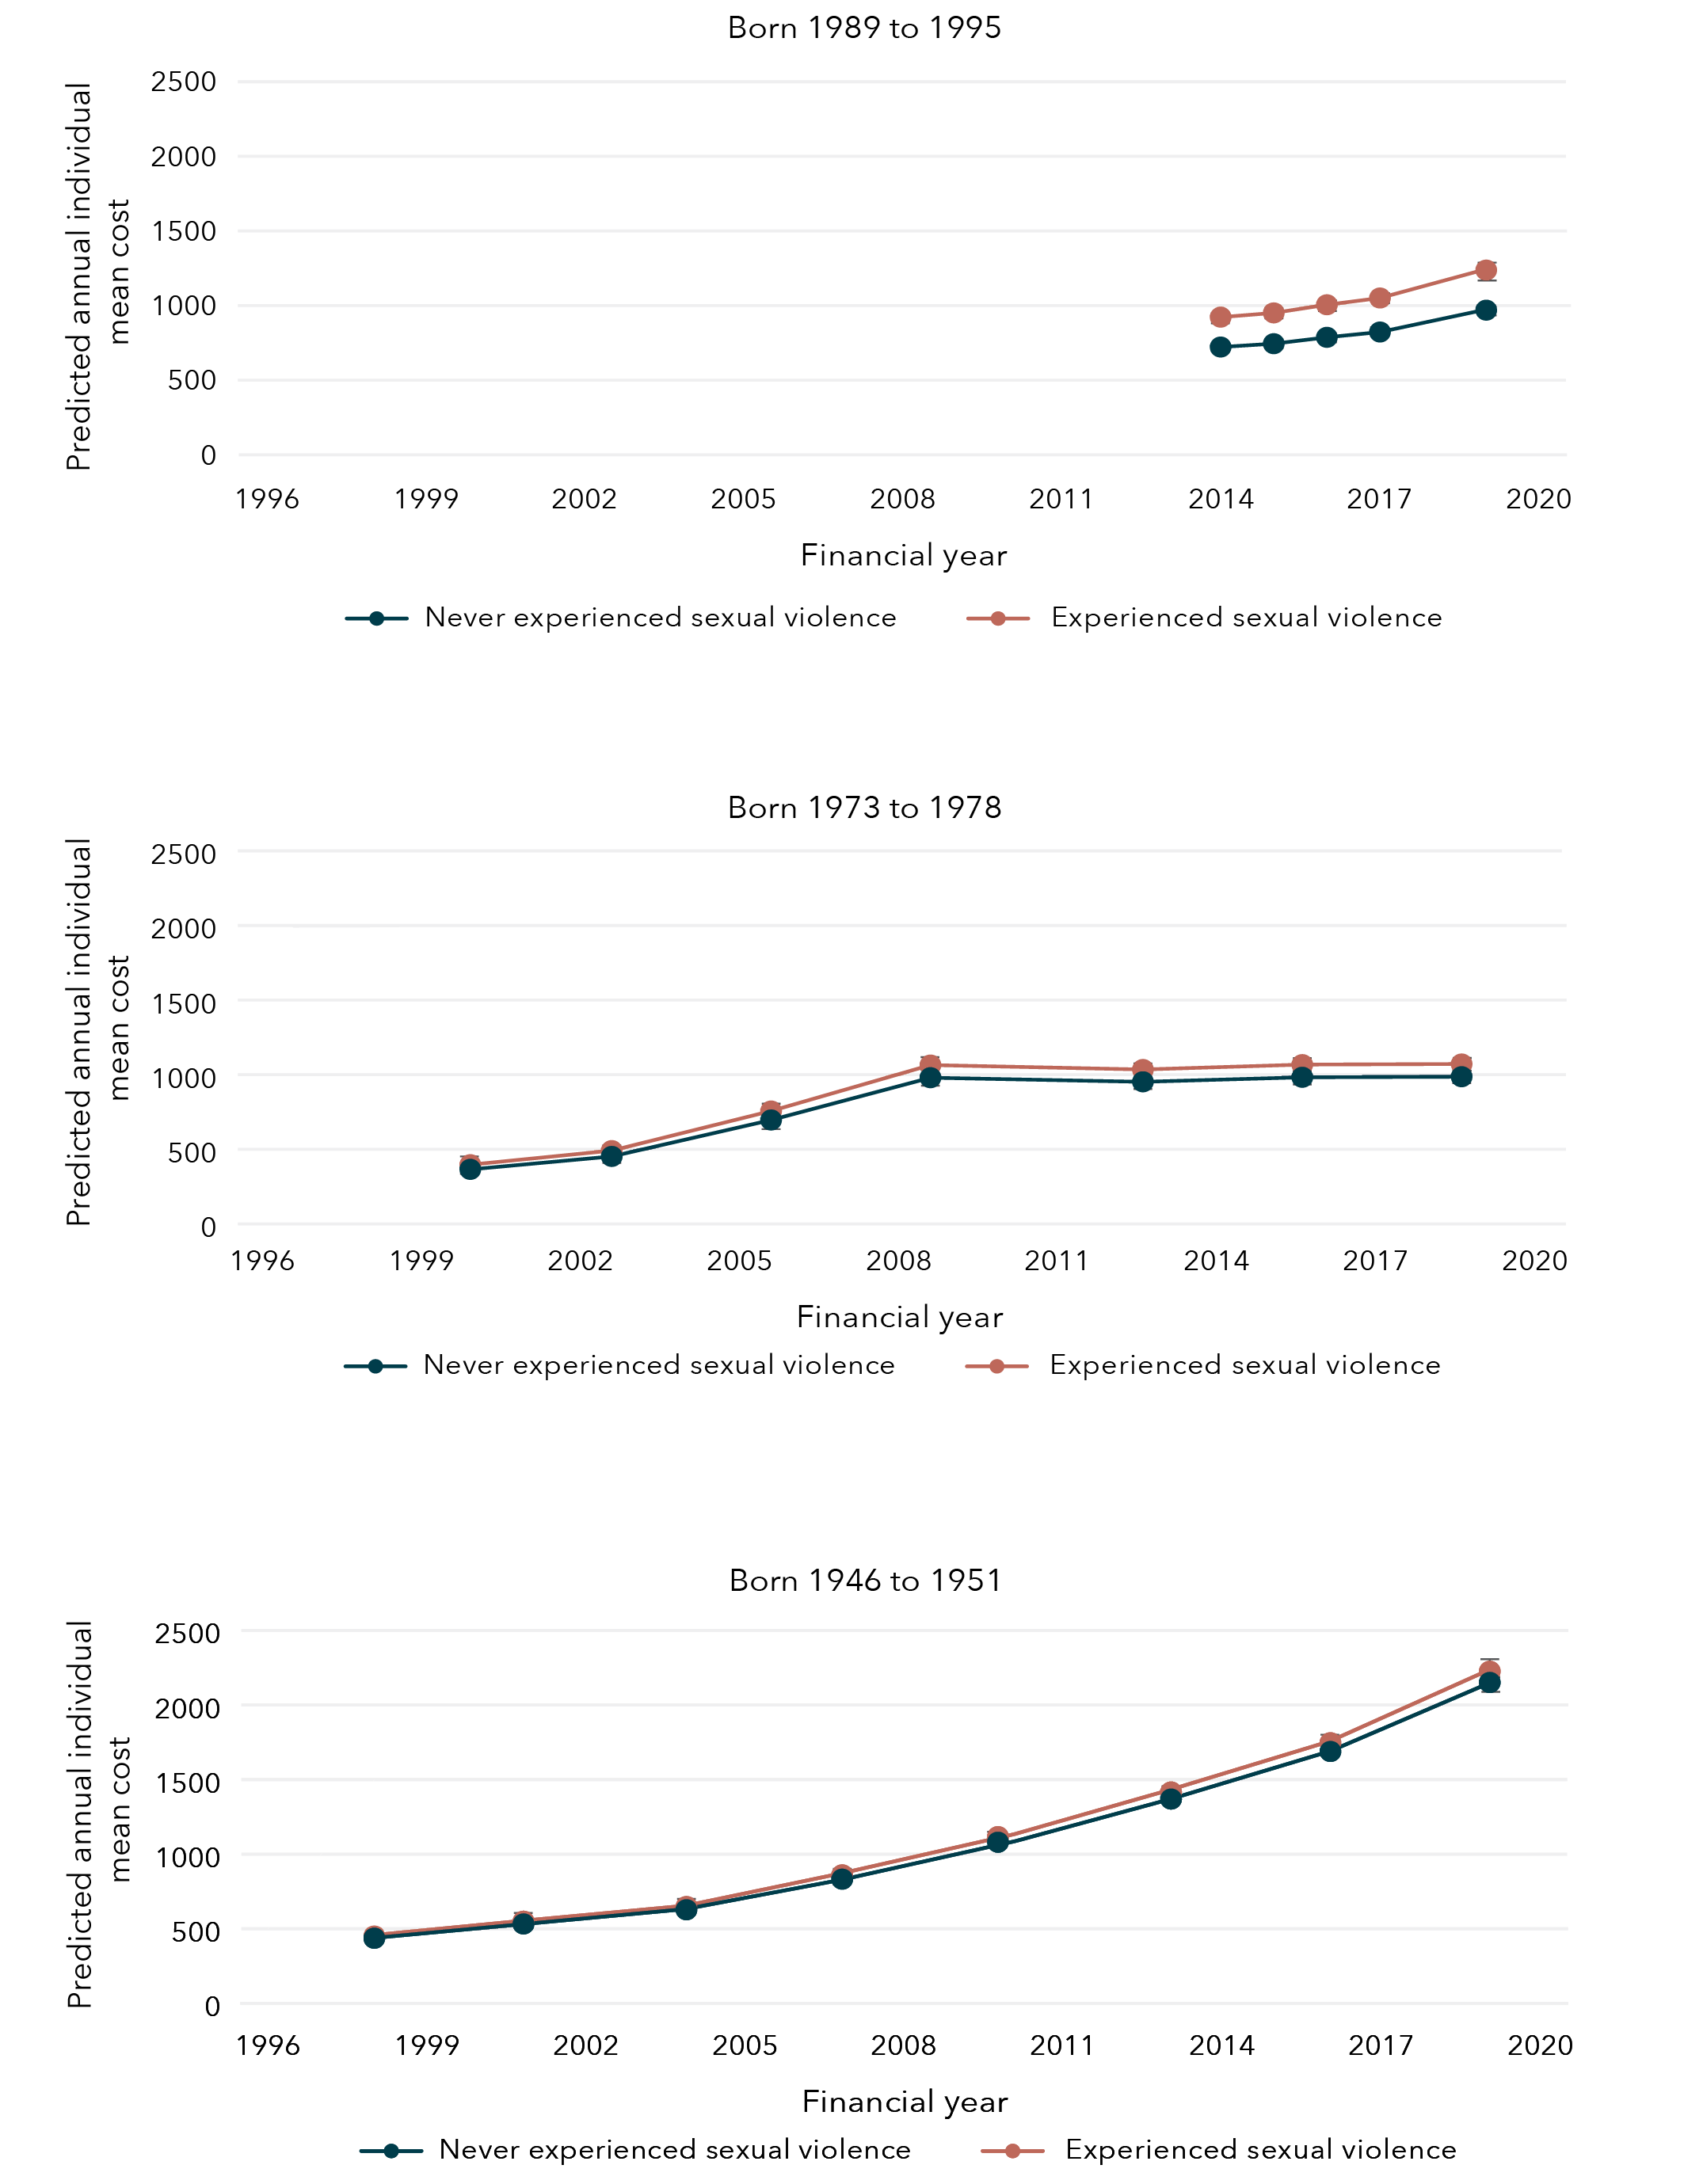
Data table tables for figure 35:
Born 1989 to 1995
Year
Experience with sexual violence Bound Lower limit Upper limit 2014 Never experienced sexual violence $722.22 $706.10 $738.35 2015 Never experienced sexual violence $744.58 $726.37 $762.78 2016 Never experienced sexual violence $787.29 $767.87 $806.72 2017 Never experienced sexual violence $822.79 $801.93 $843.65 2019 Never experienced sexual violence $969.25 $943.68 $994.83 2014 Experienced sexual violence $922.38 $897.23 $947.53 2015 Experienced sexual violence $950.93 $924.82 $977.04 2016 Experienced sexual violence $1005.49 $978.08 $1032.89 2017 Experienced sexual violence $1050.81 $1022.12 $1079.51 2019 Experienced sexual violence $1237.87 $1204.46 $1271.28
Born 1973 to 1978
Year Experience with sexual violence Bound Lower limit Upper limit 2000 Never experienced sexual violence $365.47 $356.13 $374.80 2003 Never experienced sexual violence $452.28 $440.26 $464.31 2006 Never experienced sexual violence $696.43 $677.73 $715.13 2009 Never experienced sexual violence $979.85 $952.14 $1007.56 2012 Never experienced sexual violence $952.33 $924.88 $979.77 2015 Never experienced sexual violence $982.60 $952.84 $1012.35 2018 Never experienced sexual violence $986.29 $956.24 $1016.33 2000 Experienced sexual violence $397.18 $382.13 $412.23 2003 Experienced sexual violence $491.53 $473.22 $509.83 2006 Experienced sexual violence $756.86 $729.26 $784.46 2009 Experienced sexual violence $1064.88 $1025.69 $1104.07 2012 Experienced sexual violence $1034.97 $997.37 $1072.56 2015 Experienced sexual violence $1067.86 $1028.87 $1106.86 2018 Experienced sexual violence $1071.87 $1033.07 $1110.68
Born 1946 to 1951
Year Experience with sexual violence Bound Lower limit Upper limit 1998 Never experienced sexual violence $436.27 $427.0116 $445.5224 2001 Never experienced sexual violence $532.27 $520.4818 $544.0654 2004 Never experienced sexual violence $627.21 $613.1706 $641.2495 2007 Never experienced sexual violence $832.44 $813.622 $851.2532 2010 Never experienced sexual violence $1079.98 $1055.08 $1104.89 2013 Never experienced sexual violence $1369.16 $1336.67 $1401.65 2016 Never experienced sexual violence $1688.04 $1646.89 $1729.19 2019 Never experienced sexual violence $2150.74 $2096.49 $2205.00 1998 Experienced sexual violence $451.44 $436.14 $466.75 2001 Experienced sexual violence $550.79 $532.32 $569.26 2004 Experienced sexual violence $649.03 $627.50 $670.56 2007 Experienced sexual violence $861.40 $832.99 $889.80 2010 Experienced sexual violence $1117.55 $1080.59 $1154.51 2013 Experienced sexual violence $1416.79 $1369.62 $1463.96 2016 Experienced sexual violence $1746.76 $1689.04 $1804.48 2019 Experienced sexual violence $2225.56 $2151.50 $2299.62
Sexual violence and cost of non-referred consultations subsidised by Medicare
Across all cohorts, women who had experienced sexual violence had higher predicted average annual costs for consultations that do not require a referral (e.g. referral from a general practitioner, primary care or practice nurse consultation) than women who had not experienced sexual violence and this difference increased slightly over time.
The predicted average annual costs for non-referred consultations among women born in 1989 to 1995 were $73 (2013 to 2014 financial year) and $88 (2018 to 2019 financial year) higher than the predicted average annual costs for those women who had not experienced sexual violence.
Among women born in 1973 to 1978, the predicted average annual costs for non-referred consultations in the 1999 to 2000 financial year among women who had experienced sexual violence was $17 higher than for women who had not experienced sexual violence. By the 2017 to 2018 financial year, the predicted average annual cost of non-referred consultations was $36 higher for women who had experienced sexual violence compared to those who had not experienced sexual violence.
Among women born in 1946 to 1951, the predicted average annual costs for non-referred consultations in the 1997 to 1998 financial year for women who had experienced sexual violence was $6 higher than for women who had not experienced sexual violence. By the 2018 to 2019 financial year, the predicted average annual cost of non-referred consultations was $26 higher for women who had experienced sexual violence compared to those who had not experienced sexual violence.
Figure 36: Predicted average annual cost of non-referred consultations for women born in 1989 to 1995, 1973 to 1978 and 1946 to 1951, according to whether sexual violence had been experienced
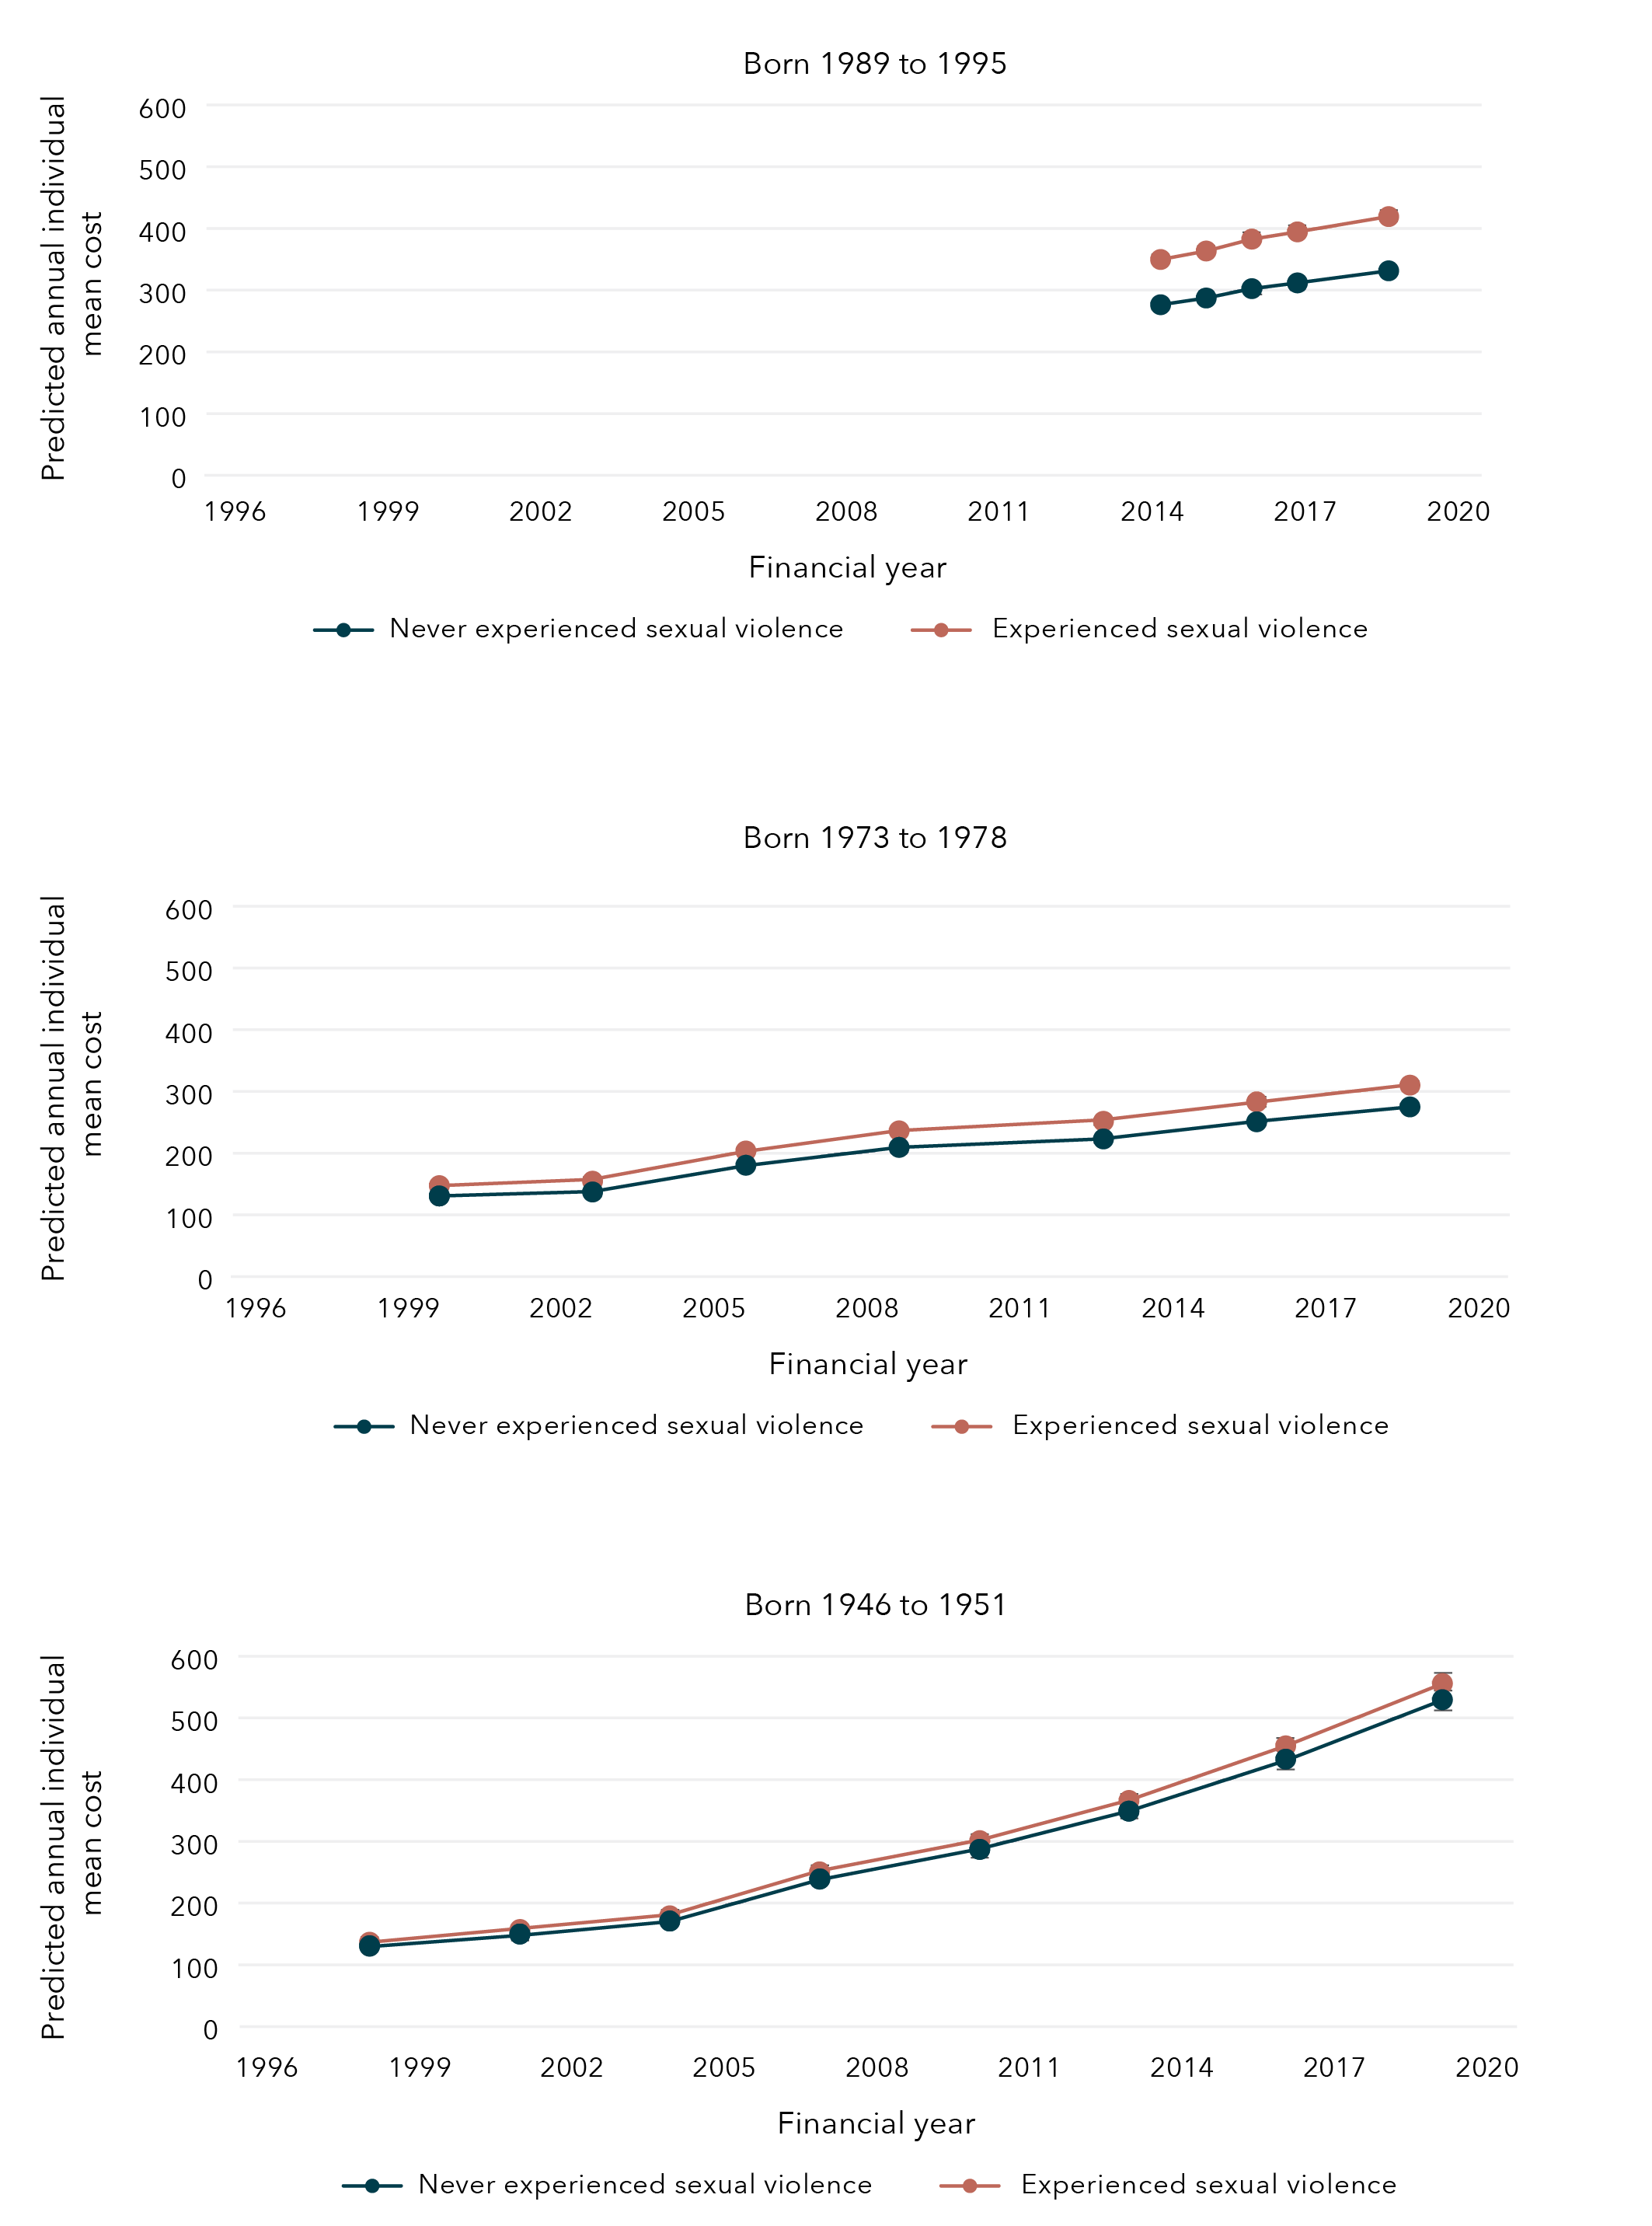
Data tables for figure 36:
Born 1989 to 1995
Year Experience with sexual violence Bound Lower limit Upper limit 2014 Never experienced sexual violence $276.40 $271.51 $281.29 2015 Never experienced sexual violence $287.26 $281.67 $292.85 2016 Never experienced sexual violence $302.44 $296.50 $308.38 2017 Never experienced sexual violence $311.77 $305.47 $318.08 2019 Never experienced sexual violence $331.34 $324.38 $338.30 2014 Experienced sexual violence $349.68 $342.07 $357.29 2015 Experienced sexual violence $363.42 $355.44 $371.40 2016 Experienced sexual violence $382.62 $374.28 $390.96 2017 Experienced sexual violence $394.43 $385.82 $403.04 2019 Experienced sexual violence $419.19 $410.17 $428.21
Born 1973 to 1978
Year Experience with sexual violence Bound Lower limit Upper limit 2000 Never experienced sexual violence $130.63 $128.25 $133.01 2003 Never experienced sexual violence $137.00 $134.40 $139.61 2006 Never experienced sexual violence $180.35 $176.88 $183.82 2009 Never experienced sexual violence $209.29 $205.07 $213.52 2012 Never experienced sexual violence $222.98 $218.38 $227.57 2015 Never experienced sexual violence $250.78 $245.37 $256.19 2018 Never experienced sexual violence $274.89 $268.90 $280.89 2000 Experienced sexual violence $147.37 $143.32 $151.43 2003 Experienced sexual violence $154.56 $150.39 $158.74 2006 Experienced sexual violence $203.46 $198.09 $208.84 2009 Experienced sexual violence $236.12 $229.84 $242.39 2012 Experienced sexual violence $251.55 $244.94 $258.16 2015 Experienced sexual violence $282.92 $275.45 $290.39 2018 Experienced sexual violence $310.12 $302.00 $318.24
Born 1946 to 1951
Year Experience with sexual violence Bound Lower limit Upper limit 1998 Never experienced sexual violence $130.18 $128.04 $132.32 2001 Never experienced sexual violence $149.86 $147.29 $152.43 2004 Never experienced sexual violence $170.98 $168.02 $173.94 2007 Never experienced sexual violence $238.80 $234.62 $242.98 2010 Never experienced sexual violence $286.98 $281.88 $292.08 2013 Never experienced sexual violence $349.02 $342.65 $355.39 2016 Never experienced sexual violence $433.29 $425.19 $441.39 2019 Never experienced sexual violence $529.55 $519.33 $539.76 1998 Experienced sexual violence $136.66 $133.02 $140.29 2001 Experienced sexual violence $157.32 $153.19 $161.45 2004 Experienced sexual violence $179.49 $174.82 $184.15 2007 Experienced sexual violence $250.68 $244.21 $257.15 2010 Experienced sexual violence $301.26 $293.47 $309.02 2013 Experienced sexual violence $366.39 $356.88 $375.89 2016 Experienced sexual violence $454.84 $443.15 $466.54 2019 Experienced sexual violence $555.89 $541.53 $570.26
Sexual violence and cost of mental health consultations subsidised by Medicare
Mental health consultations were captured using the Better Access initiative item numbers available through Medicare, which allow for consultations with general practitioners, psychologists and psychiatrists. Using the most recent MBS data available, 23 per cent of women born in 1989 to 1995, 11 per cent of women born in 1973 to 1978 and 4 per cent of women born in 1946 to 1951 had at least one mental health consultation in the 2019 to 2020 financial year.
Women who had experienced sexual violence were more likely to have used at least one mental health consultation when compared to women who had not experienced sexual violence. In the 2018 to 2019 financial year, 22 per cent of women born in 1989 to 1995 who had experienced sexual violence had accessed a mental health consultation compared to 14 per cent of those who had not experienced sexual violence. Similarly, in the 2017 to 2018 financial year, 8 per cent of women born in 1973 to 1978 who had experienced sexual violence had accessed a mental health consultation compared to 3 per cent of those who had not experienced sexual violence. In the 2018 to 2019 financial year, 3 per cent of women born in 1946 to 1951 who had experienced sexual violence had accessed a mental health consultation compared to 1 per cent of those who had not experienced sexual violence.
However, among women who had used at least one mental health consultation, there was no meaningful difference in the number of mental health consultations between women who had and had not experienced sexual violence. Across all three cohorts, there were no meaningful differences in the predicted average annual cost of mental health consultations between women who had and had not experienced sexual violence (Figure 37). It should be noted that these are the predicted average annual costs among women who had at least one mental health consultation.
Figure 37: Predicted average annual cost of mental health services (using MBS Better Access initiative items) for women who used at least one mental health service born in 1989 to 1995, 1973 to 1978 and 1946 to 1951, according to whether sexual violence had been experienced
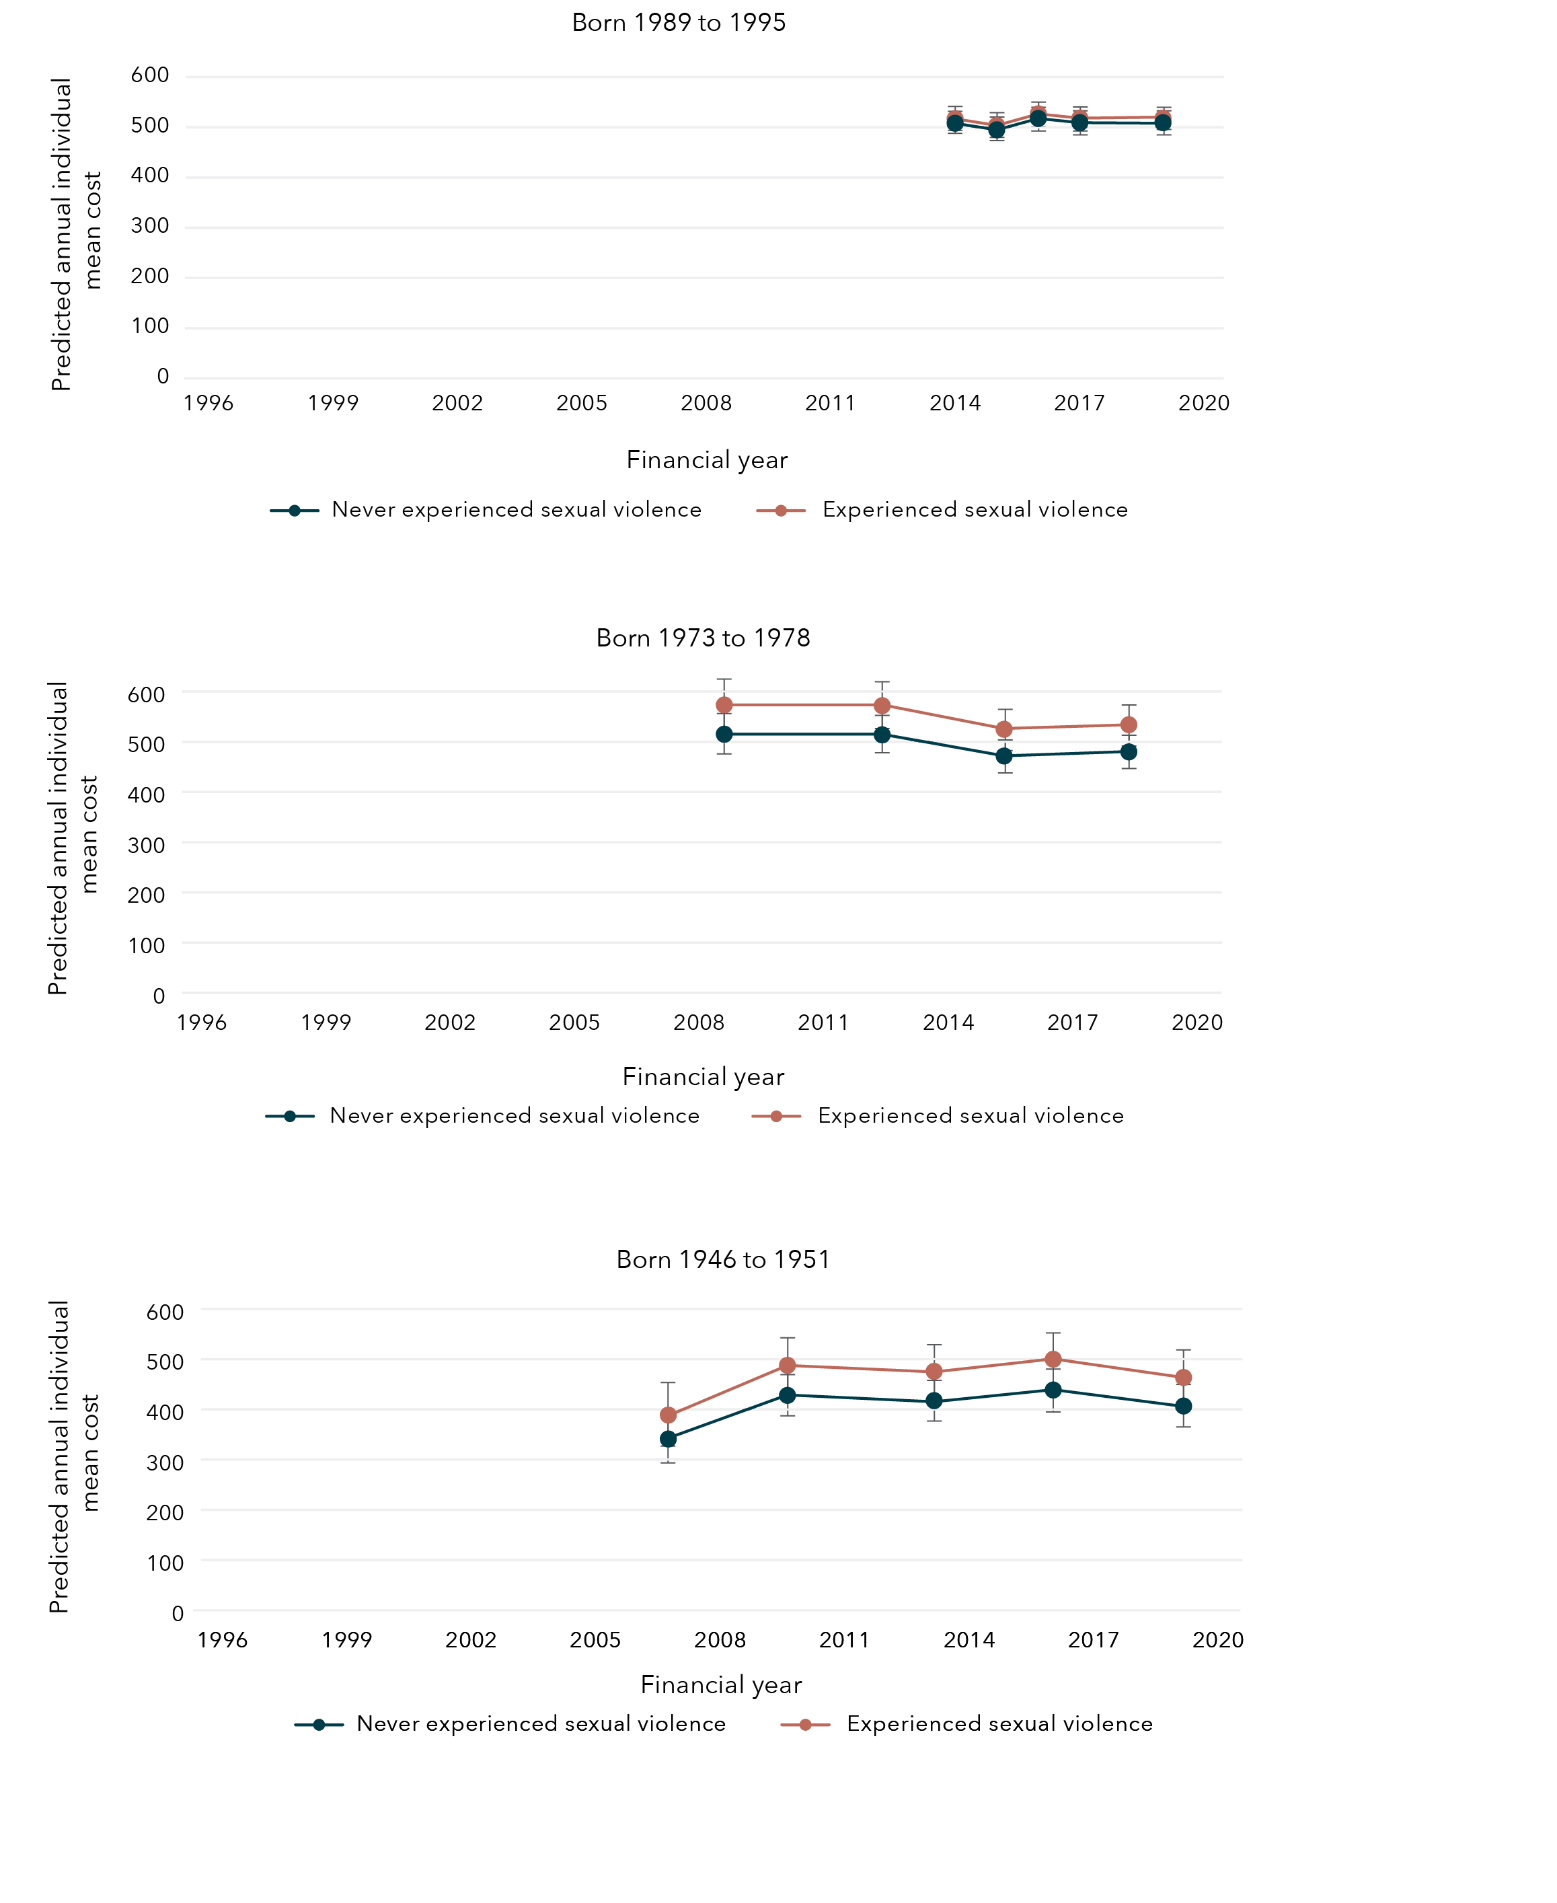
Data tables for figure 37:
Born 1989 to 1995
Year Experience with sexual violence Bound Lower limit Upper limit 2014 Never experienced sexual violence $507.99 $485.54 $530.43 2015 Never experienced sexual violence $494.89 $471.20 $518.59 2016 Never experienced sexual violence $517.50 $493.61 $541.39 2017 Never experienced sexual violence $509.17 $485.56 $532.79 2019 Never experienced sexual violence $509.12 $486.00 $532.24 2014 Experienced sexual violence $516.97 $492.44 $541.51 2015 Experienced sexual violence $503.65 $479.22 $528.08 2016 Experienced sexual violence $526.66 $502.03 $551.29 2017 Experienced sexual violence $518.18 $494.24 $542.12 2019 Experienced sexual violence $518.13 $495.76 $540.50
Born 1973 to 1978
Year Experience with sexual violence Bound Lower limit Upper limit 2009 Never experienced sexual violence $515.04 $474.33 $555.75 2012 Never experienced sexual violence $513.80 $475.77 $551.82 2015 Never experienced sexual violence $471.57 $437.85 $505.29 2018 Never experienced sexual violence $479.72 $446.26 $513.19 2009 Experienced sexual violence $573.16 $521.78 $624.54 2012 Experienced sexual violence $571.78 $524.81 $618.75 2015 Experienced sexual violence $524.78 $484.32 $565.25 2018 Experienced sexual violence $533.86 $492.45 $575.26
Born 1946 to 1951
Year Experience with sexual violence Bound Lower limit Upper limit 2007 Never experienced sexual violence $341.02 $290.06 $391.98 2010 Never experienced sexual violence $427.86 $385.79 $469.93 2013 Never experienced sexual violence $417.45 $376.23 $458.67 2016 Never experienced sexual violence $438.53 $396.21 $480.86 2019 Never experienced sexual violence $406.67 $363.29 $450.04 2007 Experienced sexual violence $388.62 $325.17 $452.07 2010 Experienced sexual violence $487.58 $432.11 $543.04 2013 Experienced sexual violence $475.72 $421.33 $530.11 2016 Experienced sexual violence $499.74 $445.94 $553.55 2019 Experienced sexual violence $463.43 $407.79 $519.07
Sexual violence and general practitioner satisfaction
Women born 1973 to 1978 were 11 per cent more likely to report poor satisfaction with general practitioner services if they had experienced sexual violence compared to women who had not reported sexual violence (95% CI=1.06, 1.16). This longitudinal model was controlled for CALD status, age, highest qualification, area of residence, relationship status and ability to manage on available income. Satisfaction with general practitioner services was not measured longitudinally among women born in 1989 to 1995 and 1946 to 1951.
Sexual violence and government-subsidised PBS medication costs
Approximately 40 per cent of women born 1989 to 1995, 35 per cent of women born 1973 to 1978 and 80 per cent of women born 1946 to 1951 had at least one government-subsidised PBS prescription each year.
The predicted average annual cost of all government-subsidised PBS medications across all three cohorts of women was similar between women who had experienced sexual violence and those who had not (Figure 38).
Figure 38: Predicted average annual cost of government-subsidised PBS medications for women born in 1989 to 1995, 1973 to 1978 and 1946 to 1951, according to whether sexual violence had been experienced
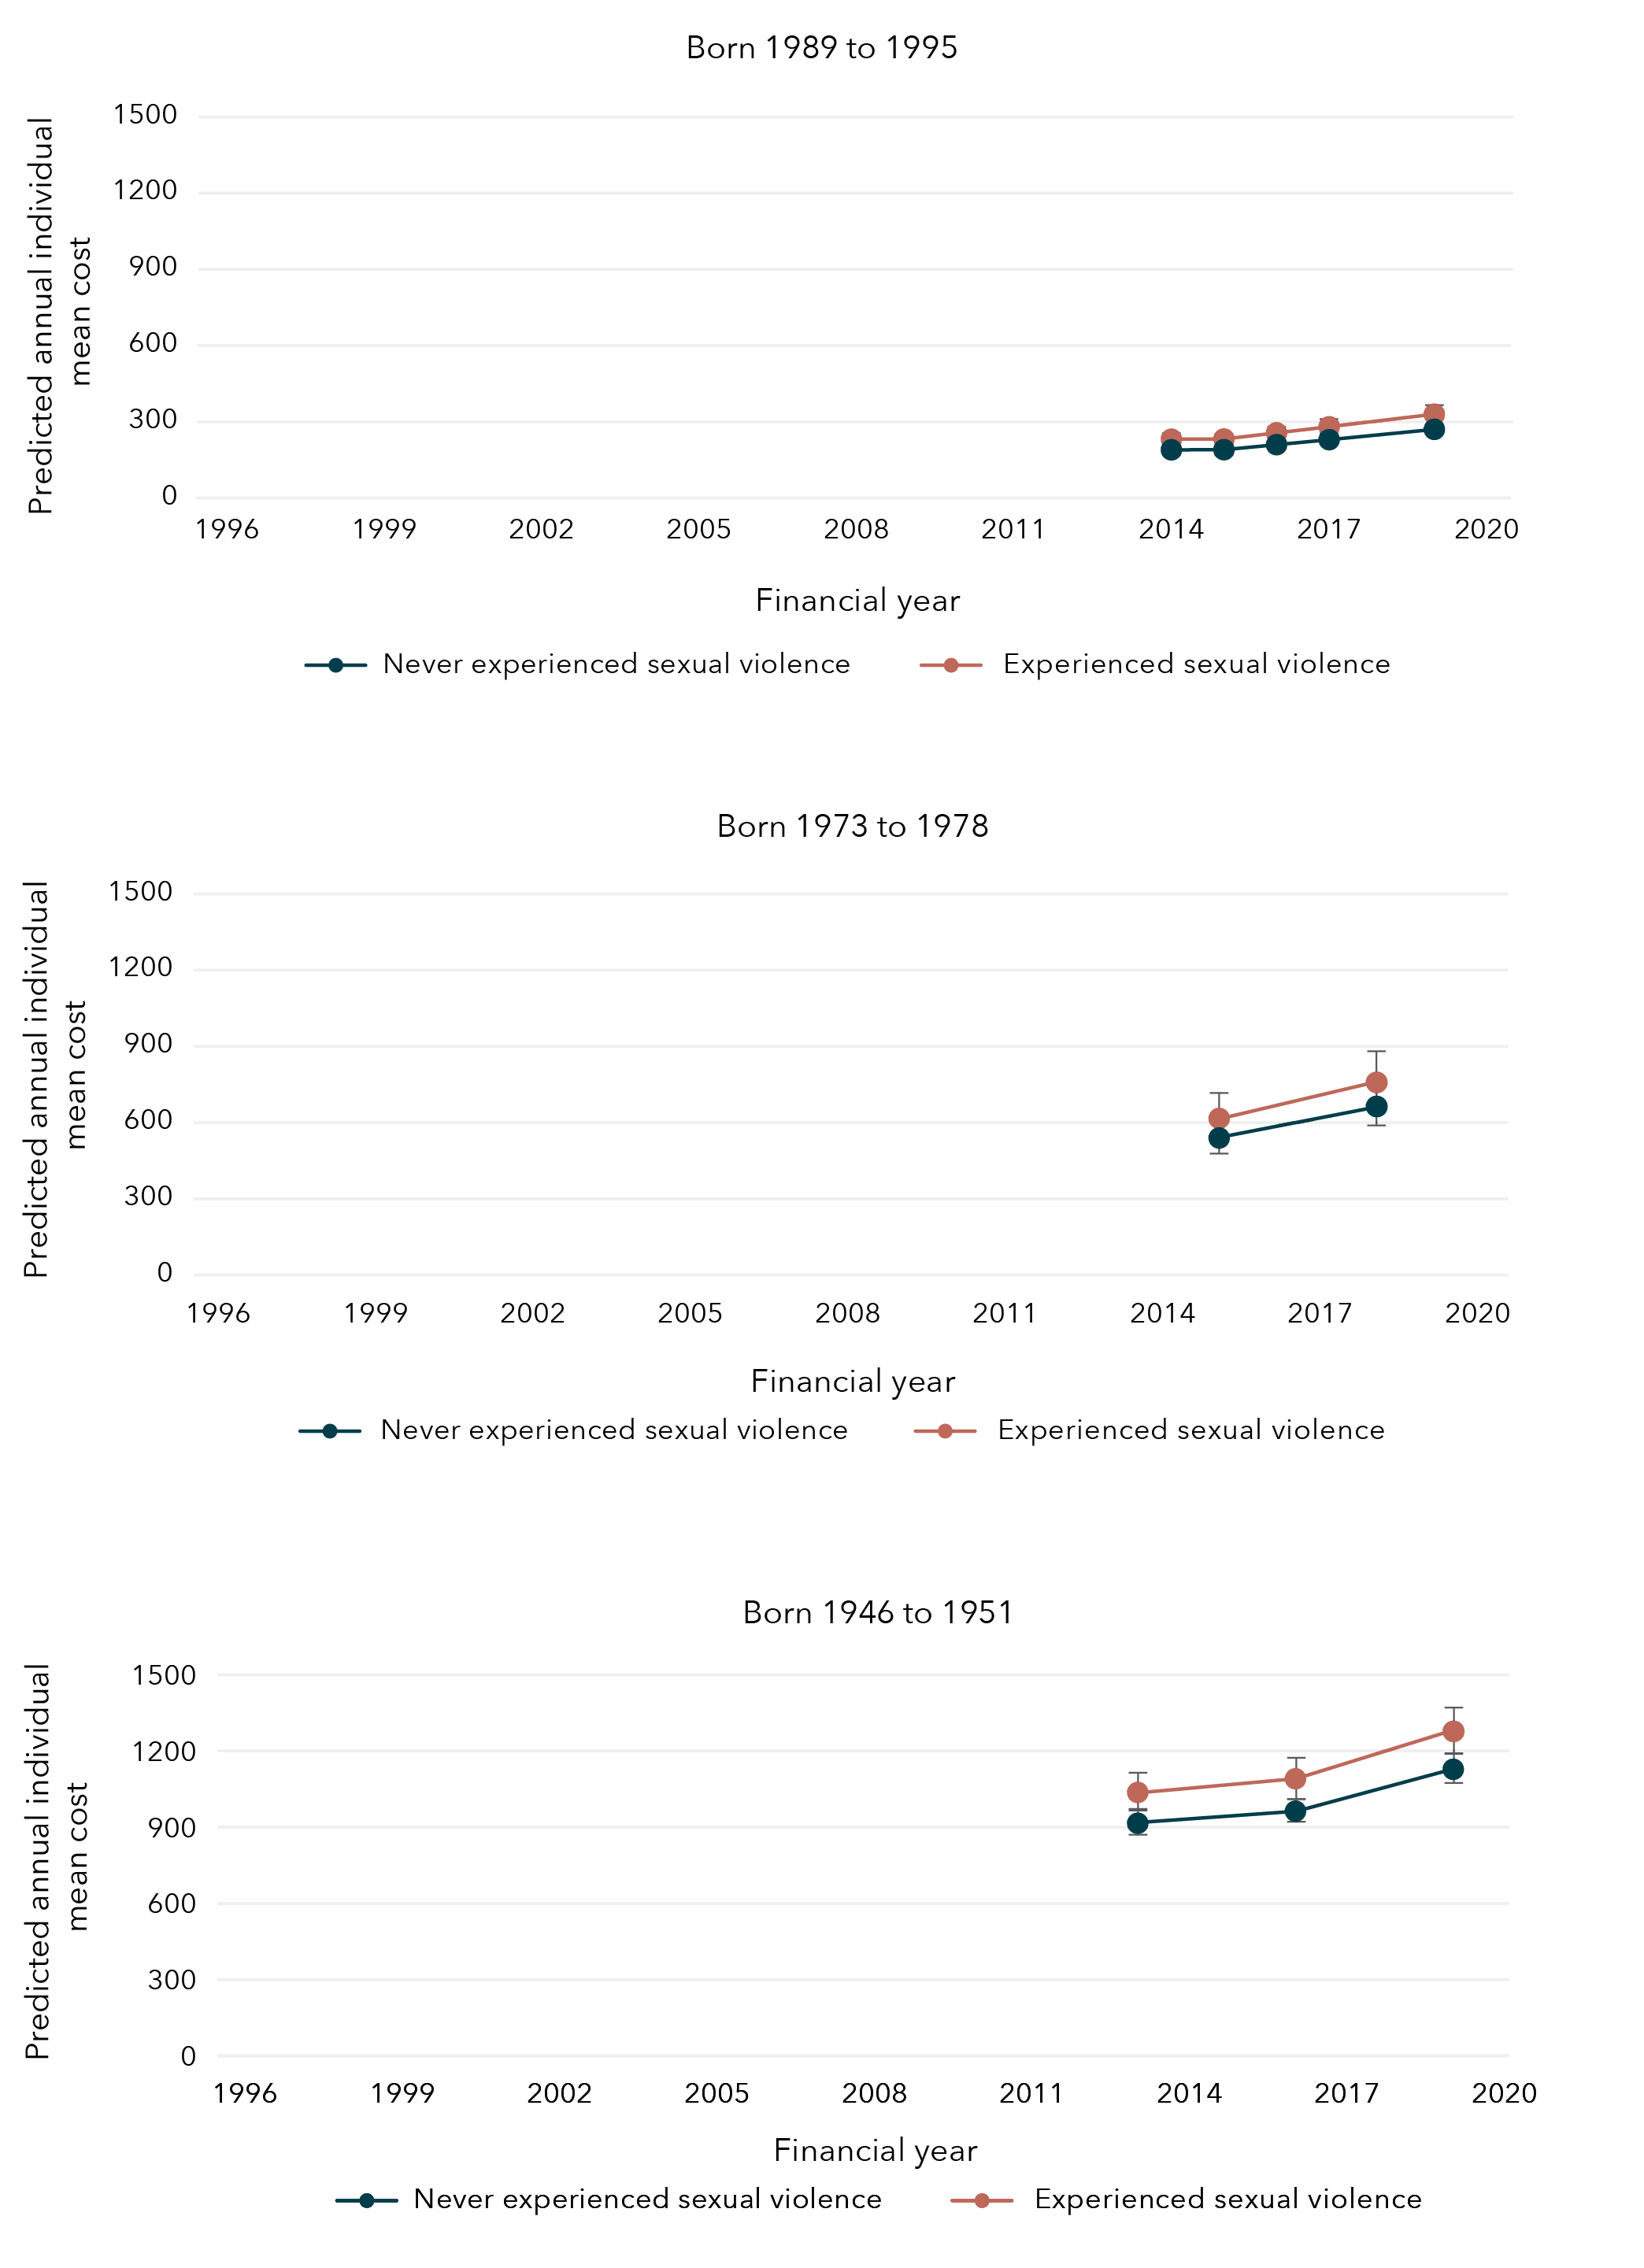
Data tables for figure 38:
Born 1989 to 1995
Year Experience with sexual violence Bound Lower limit Upper limit 2014 Never experienced sexual violence $189.61 $179.40 $199.81 2015 Never experienced sexual violence $190.09 $179.04 $201.13 2016 Never experienced sexual violence $209.87 $197.37 $222.37 2017 Never experienced sexual violence $229.56 $215.34 $243.78 2019 Never experienced sexual violence $270.15 $252.21 $288.10 2014 Experienced sexual violence $231.66 $217.43 $245.89 2015 Experienced sexual violence $232.25 $217.88 $246.61 2016 Experienced sexual violence $256.42 $240.33 $272.51 2017 Experienced sexual violence $280.47 $262.47 $298.47 2019 Experienced sexual violence $330.07 $308.48 $351.67
Born 1973 to 1978
Year Experience with sexual violence Bound Lower limit Upper limit 2015 Never experienced sexual violence $539.40 $470.11 $608.69 2018 Never experienced sexual violence $663.20 $580.07 $746.33 2015 Experienced sexual violence $616.43 $527.89 $704.98 2018 Experienced sexual violence $757.91 $651.72 $864.10
Born 1946 to 1951
Year Experience with sexual violence Bound Lower limit Upper limit 2013 Never experienced sexual violence $915.35 $868.46 $962.25 2016 Never experienced sexual violence $962.92 $912.87 $1,012.97 2019 Never experienced sexual violence $1,127.62 $1,067.52 $1,187.72 2013 Experienced sexual violence $1,036.59 $960.77 $1,112.41 2016 Experienced sexual violence $1,090.45 $1,012.23 $1,168.68 2019 Experienced sexual violence $1,276.97 $1,185.17 $1,368.77
Sexual violence and government-subsidised psychoactive PBS medication costs
The annual prevalence of filling at least one government-subsidised psychoactive PBS medication prescription (e.g. antidepressants, anxiolytics) was approximately 11 per cent among women born in 1989 to 1995 and 10 per cent among women born in 1973 to 1978. Among women born in 1946 to 1951, this prevalence increased from 23 per cent in the 2012 to 2013 financial year to 29 per cent in the 2019 to 2020 financial year.
The predicted average annual cost of all government-subsidised PBS medications across all three cohorts of women was similar between those women who had experienced sexual violence and those who had not (Figure 39).
Figure 39: Average annual cost of government-subsidised psychoactive PBS medications for women born in 1989 to 1995, 1973 to 1978 and 1946 to 1951, according to whether sexual violence had been experienced
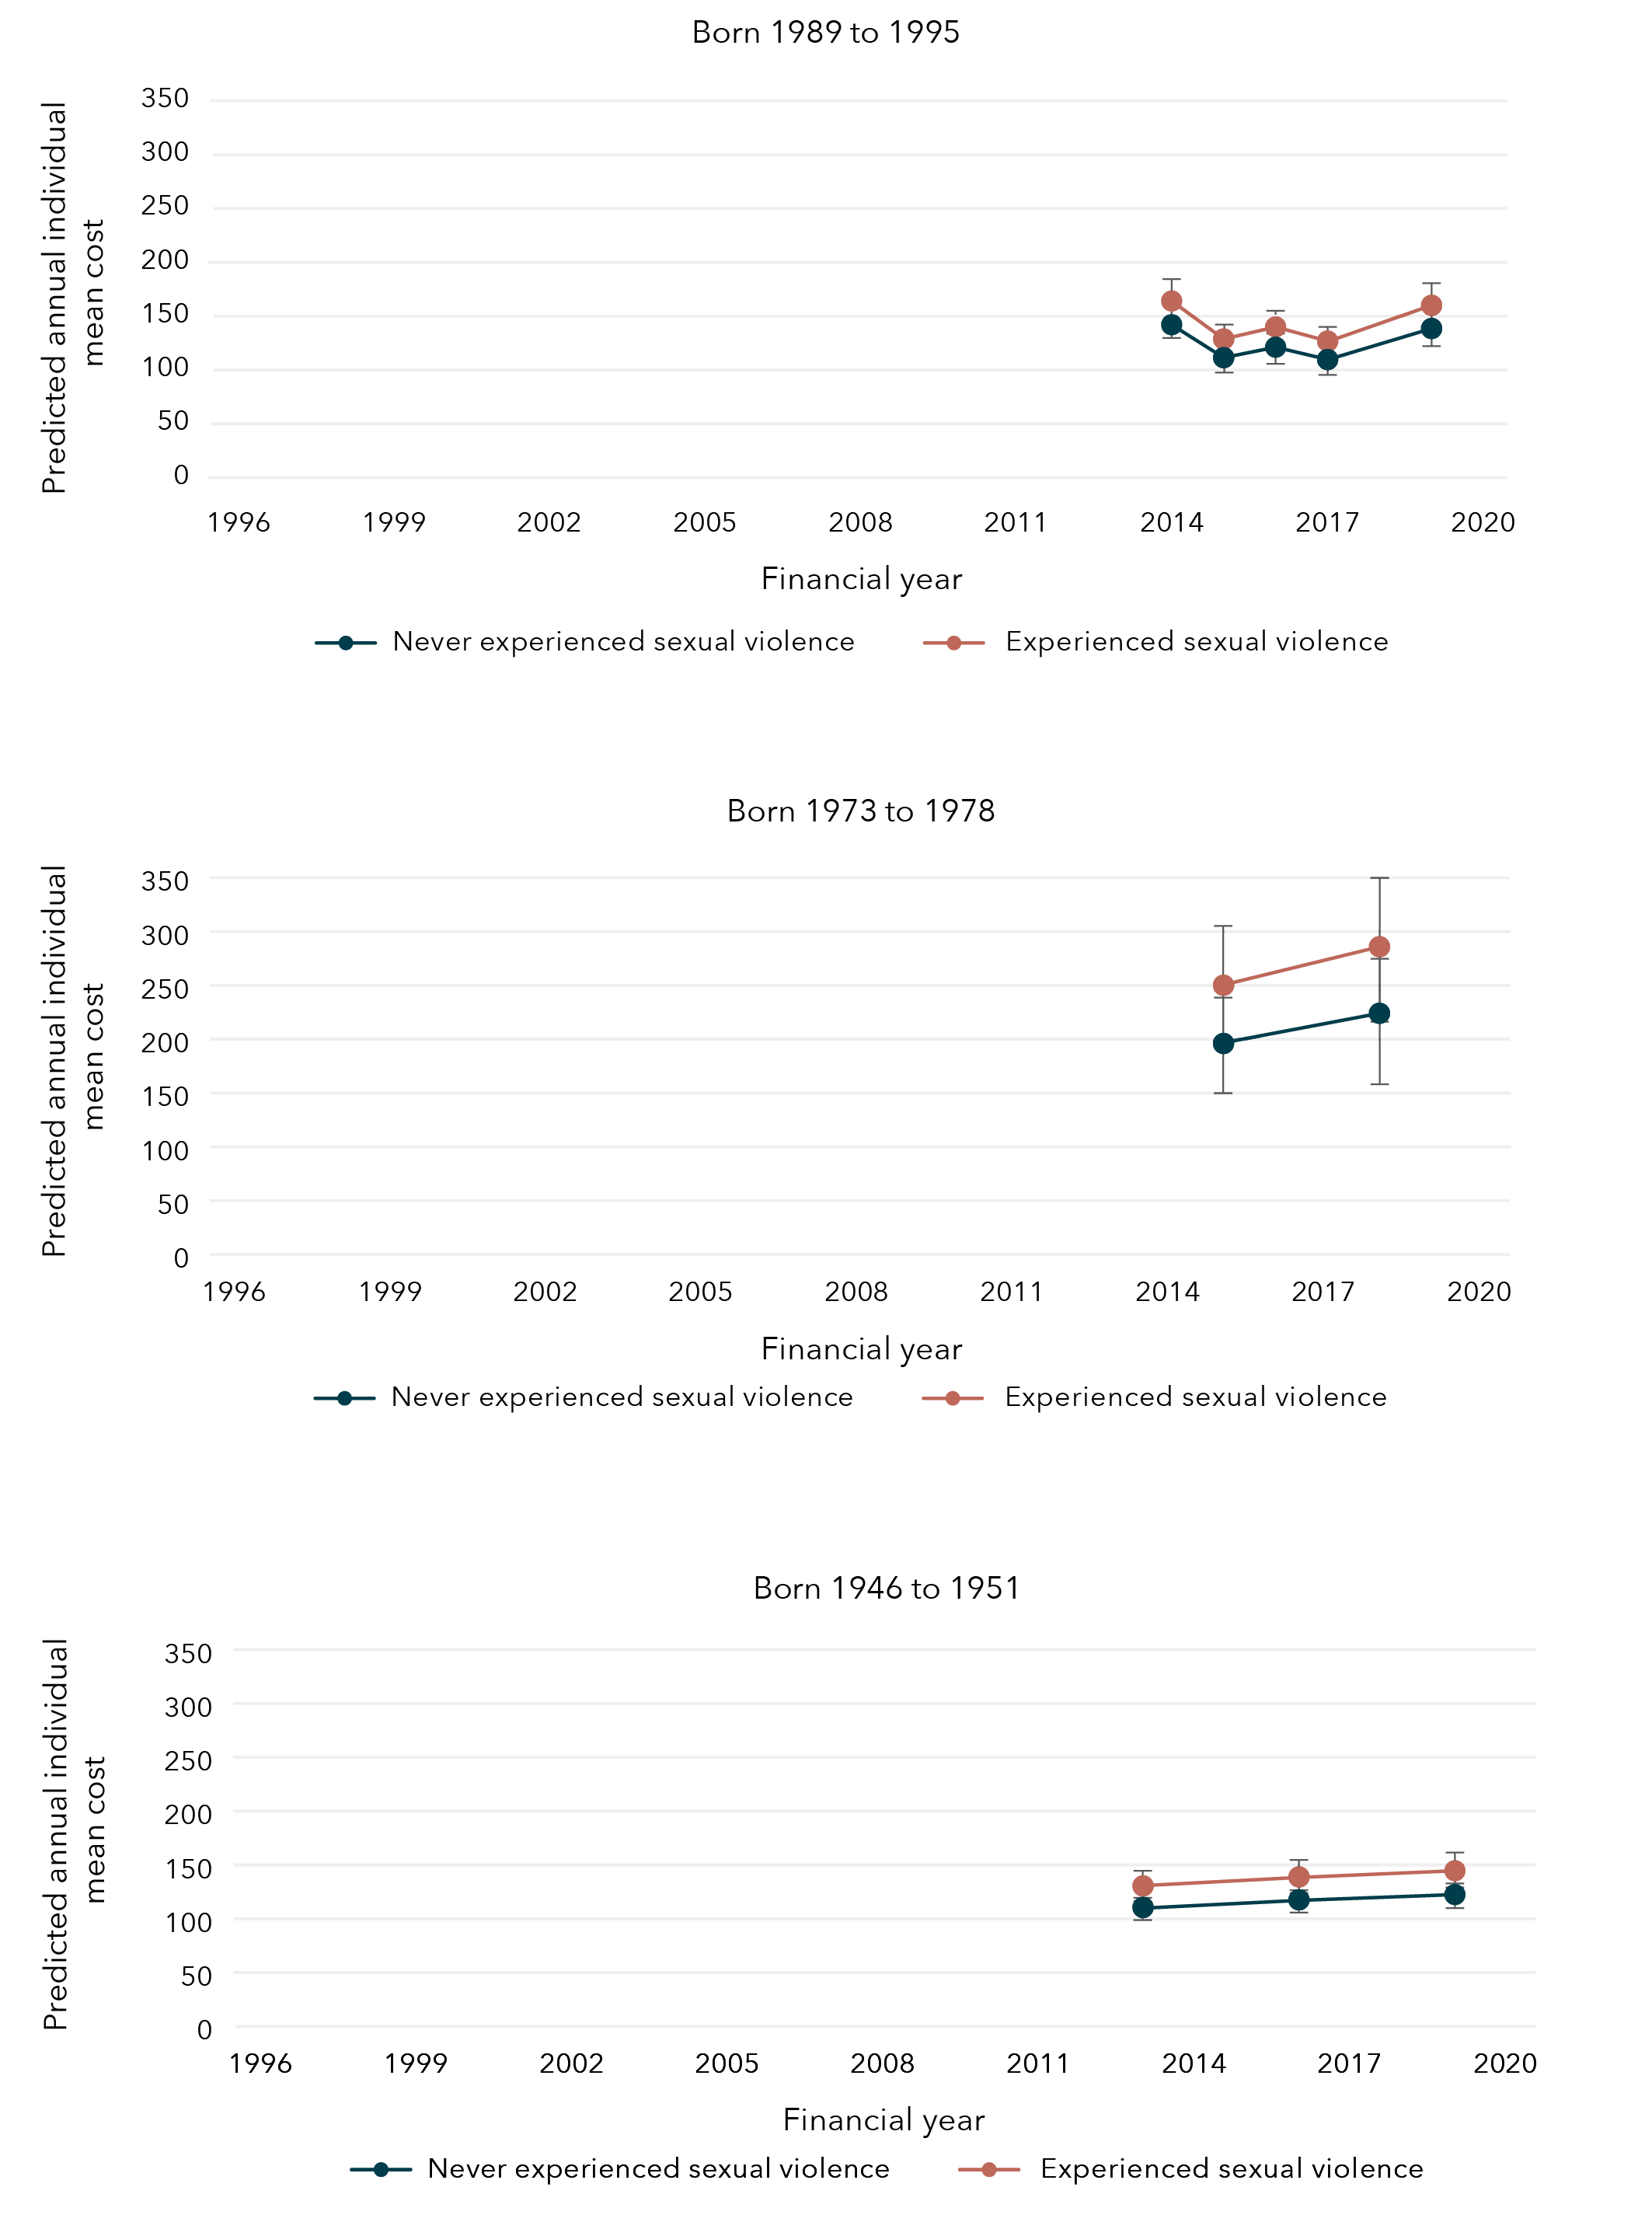
Data tables for figure 39:
Born 1989 to 1995
Year Experience with sexual violence Bound Lower limit Upper limit 2014 Never experienced sexual violence $142.01 $127.91 $156.11 2015 Never experienced sexual violence $111.45 $99.58 $123.32 2016 Never experienced sexual violence $121.15 $107.91 $134.39 2017 Never experienced sexual violence $109.74 $97.16 $122.32 2019 Never experienced sexual violence $138.52 $121.27 $155.77 2014 Experienced sexual violence $164.07 $147.57 $180.58 2015 Experienced sexual violence $128.77 $115.66 $141.88 2016 Experienced sexual violence $139.97 $125.40 $154.55 2017 Experienced sexual violence $126.79 $113.32 $140.26 2019 Experienced sexual violence $160.04 $142.39 $177.70
Born 1973 to 1978
Year Experience with sexual violence Bound Lower limit Upper limit 2015 Never experienced sexual violence $195.97 $153.11 $238.84 2018 Never experienced sexual violence $224.02 $172.73 $275.32 2015 Experienced sexual violence $250.08 $196.24 $303.92 2018 Experienced sexual violence $285.87 $221.90 $349.84
Born 1946 to 1951
Year Experience with sexual violence Bound Lower limit Upper limit 2013 Never experienced sexual violence $110.56 $101.10 $120.03 2016 Never experienced sexual violence $117.63 $107.31 $127.95 2019 Never experienced sexual violence $122.51 $111.46 $133.56 2013 Experienced sexual violence $130.53 $115.94 $145.12 2016 Experienced sexual violence $138.87 $123.66 $154.09 2019 Experienced sexual violence $144.63 $128.62 $160.65
Sexual violence and health services
Findings from the Australian Longitudinal Study on Women’s Health
The predicted average annual costs* for women who had experienced sexual violence were
higher than the predicted average annual costs for those who had not experienced sexual violence:
- $268 higher for women born 1989 to 1995 (aged 24 to 30 in 2019) 2018–2019 financial year.
- $85 higher for women born 1973 to 197 (aged 40 to 45 in 2018) 2017–2018 financial year.
The predicted average annual costs for non-referred consultations were higher for women who had experienced sexual violence
than those who had not experienced sexual violence:
- $88 higher predicted average annual costs for non-referred consultations for women born 1989 to 1995 (aged 24 to 30 in 2019) 2018–2019 financial year.
- $36 higher predicted average annual costs for non-referred consultations for women born 1973 to 1978 (aged 40 to 45 in 2019) 2017–2018 financial year.
- $26 higher predicted average annual costs for non-referred consultations for women born 1946 to 1951 (aged 68 to 73 in 2019) 2018–2019 financial year.
Women born 1973 to 1978 were
11% more likely
to report poor satisfaction with GP services if they had experienced sexual violence compared to women who had not reported sexual violence.
* Government-subsidised Medicare costs.
** Satisfaction with GP services was not measured longitudinally for women born 1989 to 1995 and 1946 to 1951.
Chapter 7: Wellbeing among women who have experienced sexual violence
In each cohort, irrespective of experiencing sexual violence, 85 per cent of women aged 24 to 30 (in 2019), 89 per cent of women aged 40 to 45 (in 2018) and 85 per cent of women aged 68 to 73 (in 2019) reported good general health. Good mental health was reported by 75 per cent of women aged 21 to 27 (in 2016), 88 per cent of women aged 40 to 45 (in 2018) and 93 per cent of women aged 68 to 73 (in 2019). Among women aged 21 to 27, 67 per cent simultaneously reported both good general health and good mental health, as did 79 per cent of women aged 40 to 45 and 81 per cent of women aged 68 to 73.
Factors associated with wellbeing among women who have experienced sexual violence
Factors associated with improved wellbeing
Physical activity and social support were associated with good general health (Figure 40) among women who had experienced sexual violence. Those women who engaged in moderate to high physical activity were 10 to 17 per cent more likely to report good general health compared to women who engaged in no physical activity. This was consistently observed across the three cohorts of women. Where measures of social support were available for women born in 1973 to 1978 and 1946 to 1951, emotional support and guidance (e.g. empathetic understanding or advice) and affection and social interaction (e.g. expressions of love or companionship) were also associated with good general health among women who had experienced sexual violence.
Figure 40: Factors associated with an increased likelihood of reporting good general health
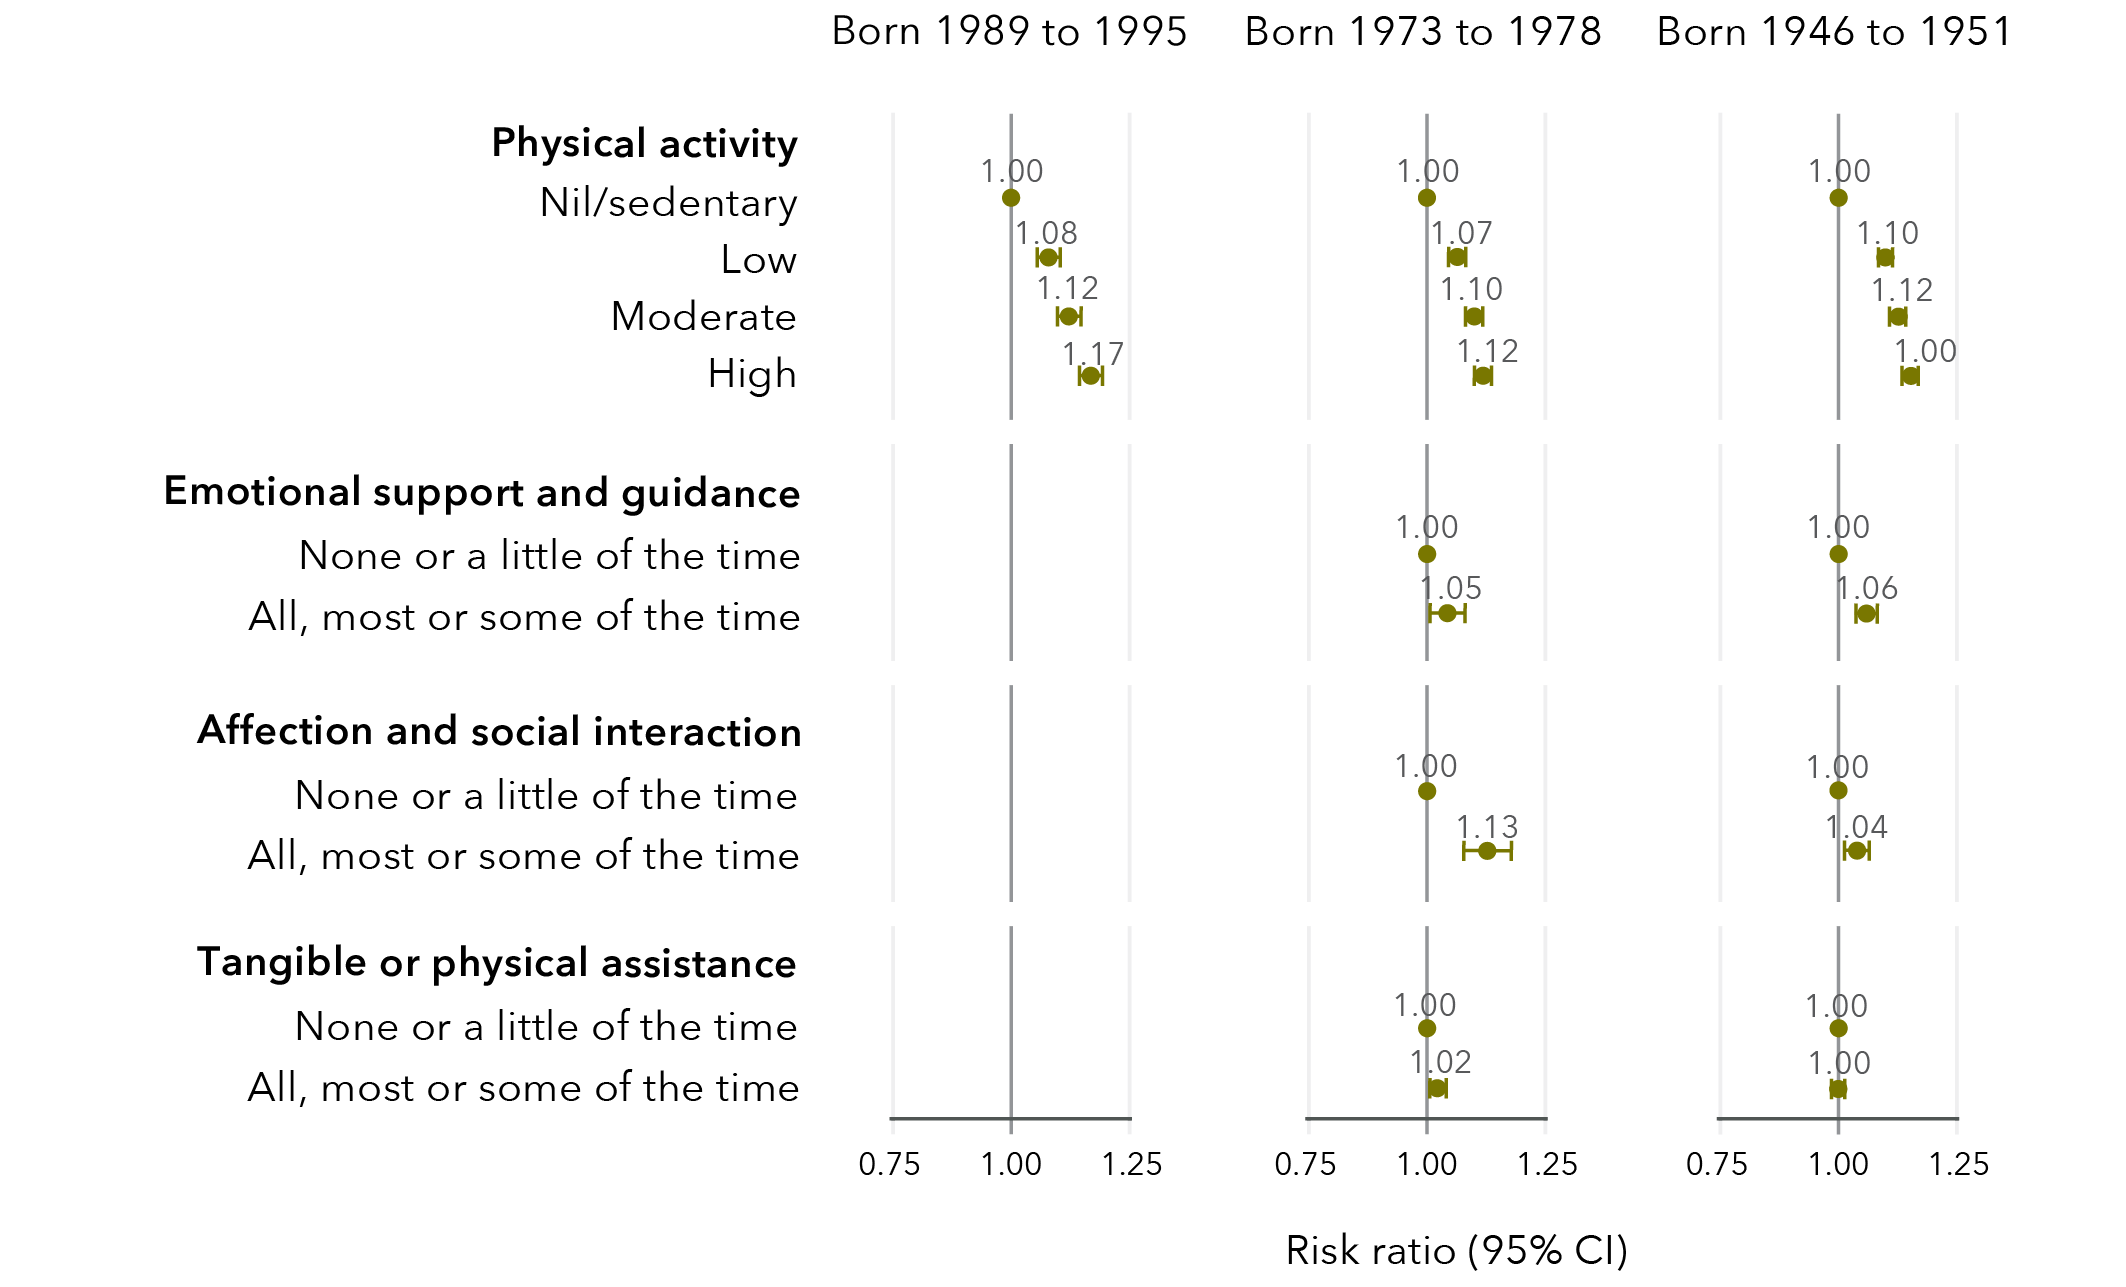
Data tables for figure 40:
Born 1989 to 1995
Physical activity
Risk ratio Lower limit Upper limit Nil/sedentary 1.00 No data No data Low 1.08 1.05 1.10 Moderate 1.12 1.10 1.15 High 1.17 1.14 1.19
Born 1973 to 1978
Physical activity
Risk ratio Lower limit Upper limit Nil/sedentary 1.00 No data No data Low 1.07 1.05 1.09 Moderate 1.10 1.09 1.12 High 1.12 1.10 1.14
Emotional support and guidance
Risk ratio Lower limit Upper limit None or a little of the time 1.00 No data No data All, most, or some of the time 1.05 1.01 1.08
Affection and social interaction
Risk ratio Lower limit Upper limit None or a little of the time 1.00 No data No data All, most, or some of the time 1.13 1.08 1.18
Tangible or physical assistance
Risk ratio Lower limit Upper limit None or a little of the time 1.00 No data No data All, most, or some of the time 1.02 1.00 1.04
Born 1946 to 1951
Physical activity
Risk ratio Lower limit Upper limit Nil/sedentary 1.00 No data No data Low 1.10 1.08 1.11 Moderate 1.12 1.11 1.14 High 1.15 1.13 1.17
Emotional support and guidance
Risk ratio Lower limit Upper limit None or a little of the time 1.00 No data No data All, most, or some of the time 1.06 1.03 1.08
Affection and social interaction
Risk ratio Lower limit Upper limit None or a little of the time 1.00 No data No data All, most, or some of the time 1.04 1.01 1.06
Tangible or physical assistance
Risk ratio Lower limit Upper limit None or a little of the time 1.00 No data No data All, most, or some of the time 1.00 0.98 1.01
Overall, 75 per cent of women aged 21 to 27 (in 2016), 88 per cent of women aged 40 to 45 (in 2018) and 93 per cent of women aged 68 to 73 (in 2019) reported good mental health. As with general health, physical activity and social support were associated with good mental health among women who had experienced sexual violence (Figure 41). However, in addition to emotional support and guidance (e.g. empathetic understanding or advice) and affection and social interaction (e.g. expressions of love or companionship), there was evidence of a small association between tangible or physical assistance and good mental health among women who had experienced sexual violence.
Figure 41: Factors associated with an increased likelihood of reporting good mental health
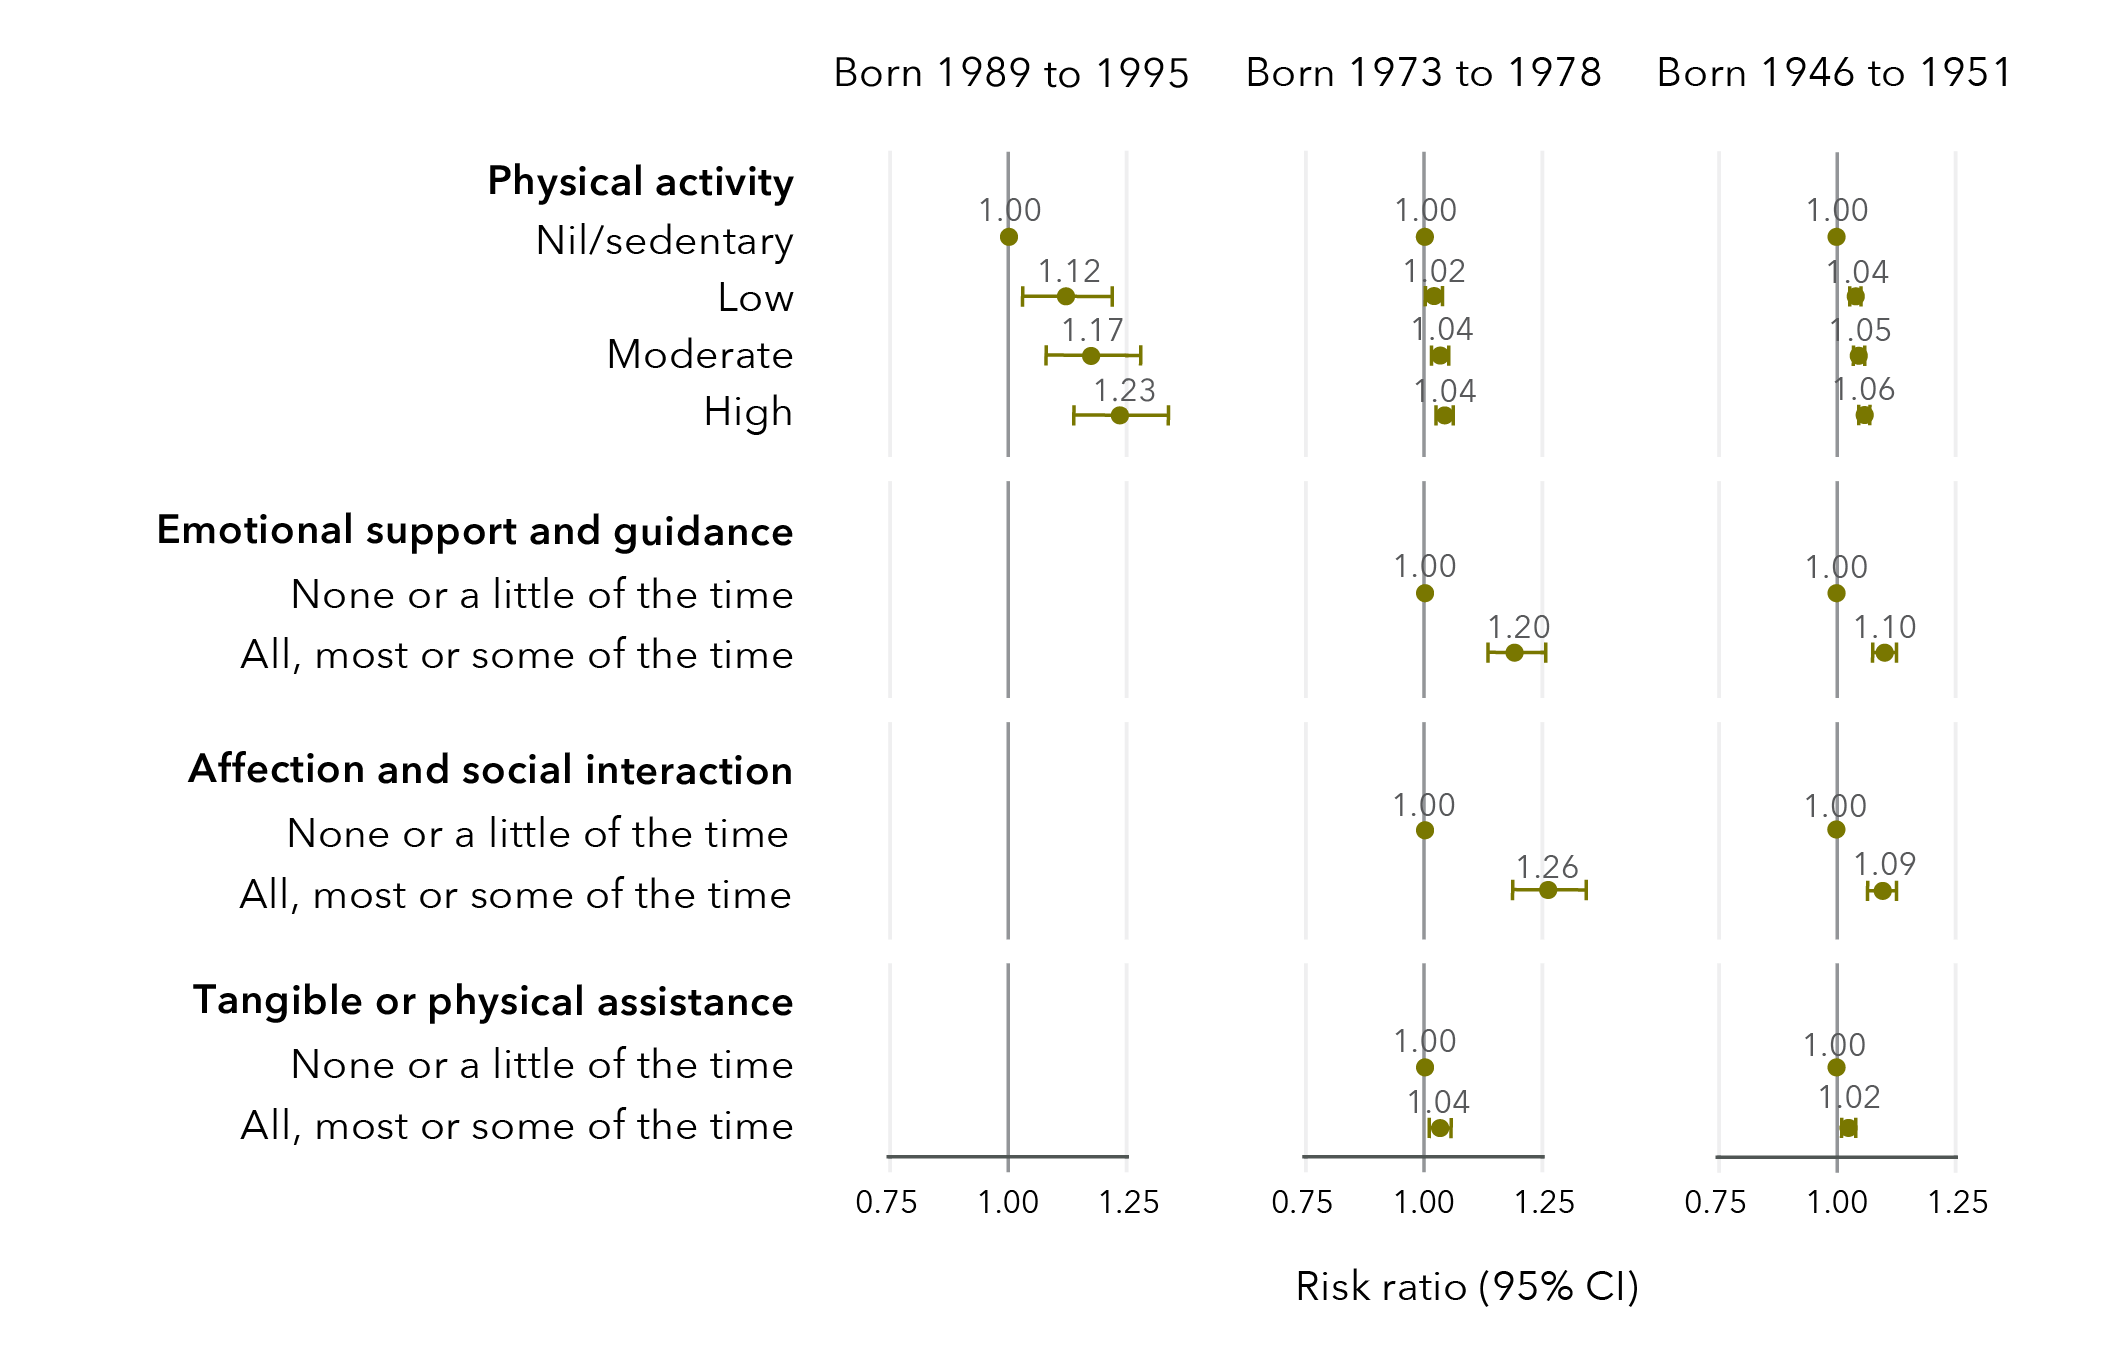
Data tables for figure 41:
Born 1989 to 1995
Physical activity
Risk ratio Lower limit Upper limit Nil/sedentary 1.00 No data No data Low 1.12 1.03 1.22 Moderate 1.17 1.08 1.28 High 1.23 1.14 1.34
Born 1973 to 1978
Physical activity
Risk ratio Lower limit Upper limit Nil/sedentary 1.00 No data No data Low 1.02 1.01 1.04 Moderate 1.04 1.02 1.05 High 1.04 1.03 1.06
Emotional support and guidance
Risk ratio Lower limit Upper limit None or a little of the time 1.00 No data No data All, most, or some of the time 1.20 1.14 1.26
Affection and social interaction
Risk ratio Lower limit Upper limit None or a little of the time 1.00 No data No data All, most, or some of the time 1.26 1.19 1.34
Tangible or physical assistance
Risk ratio Lower limit Upper limit None or a little of the time 1.00 No data No data All, most, or some of the time 1.04 1.01 1.06
Born 1946 to 1951
Physical activity
Risk ratio Lower limit Upper limit Nil/sedentary 1.00 No data No data Low 1.04 1.03 1.05 Moderate 1.05 1.03 1.06 High 1.06 1.05 1.07
Emotional support and guidance
Risk ratio Lower limit Upper limit None or a little of the time 1.00 No data No data All, most, or some of the time 1.10 1.07 1.12
Affection and social interaction
Risk ratio Lower limit Upper limit None or a little of the time 1.00 No data No data All, most, or some of the time 1.09 1.06 1.13
Tangible or physical assistance
Risk ratio Lower limit Upper limit None or a little of the time 1.00 No data No data All, most, or some of the time 1.02 1.01 1.04
Factors associated with a decline in wellbeing
Factors that reduced the likelihood of good general health and good mental health among women who had experienced sexual violence included sexual violence during childhood, recent non-sexual violence, high alcohol consumption, current smoking, obesity and difficulty managing on available income (Figure 42 and Figure 43). There were substantial differences across cohorts in these effects. However, most effect sizes were relatively small, indicating a small (less than 10%) reduction in likelihood of reporting good general and mental health due to these factors.
Figure 42: Factors associated with a decreased likelihood of reporting good general health
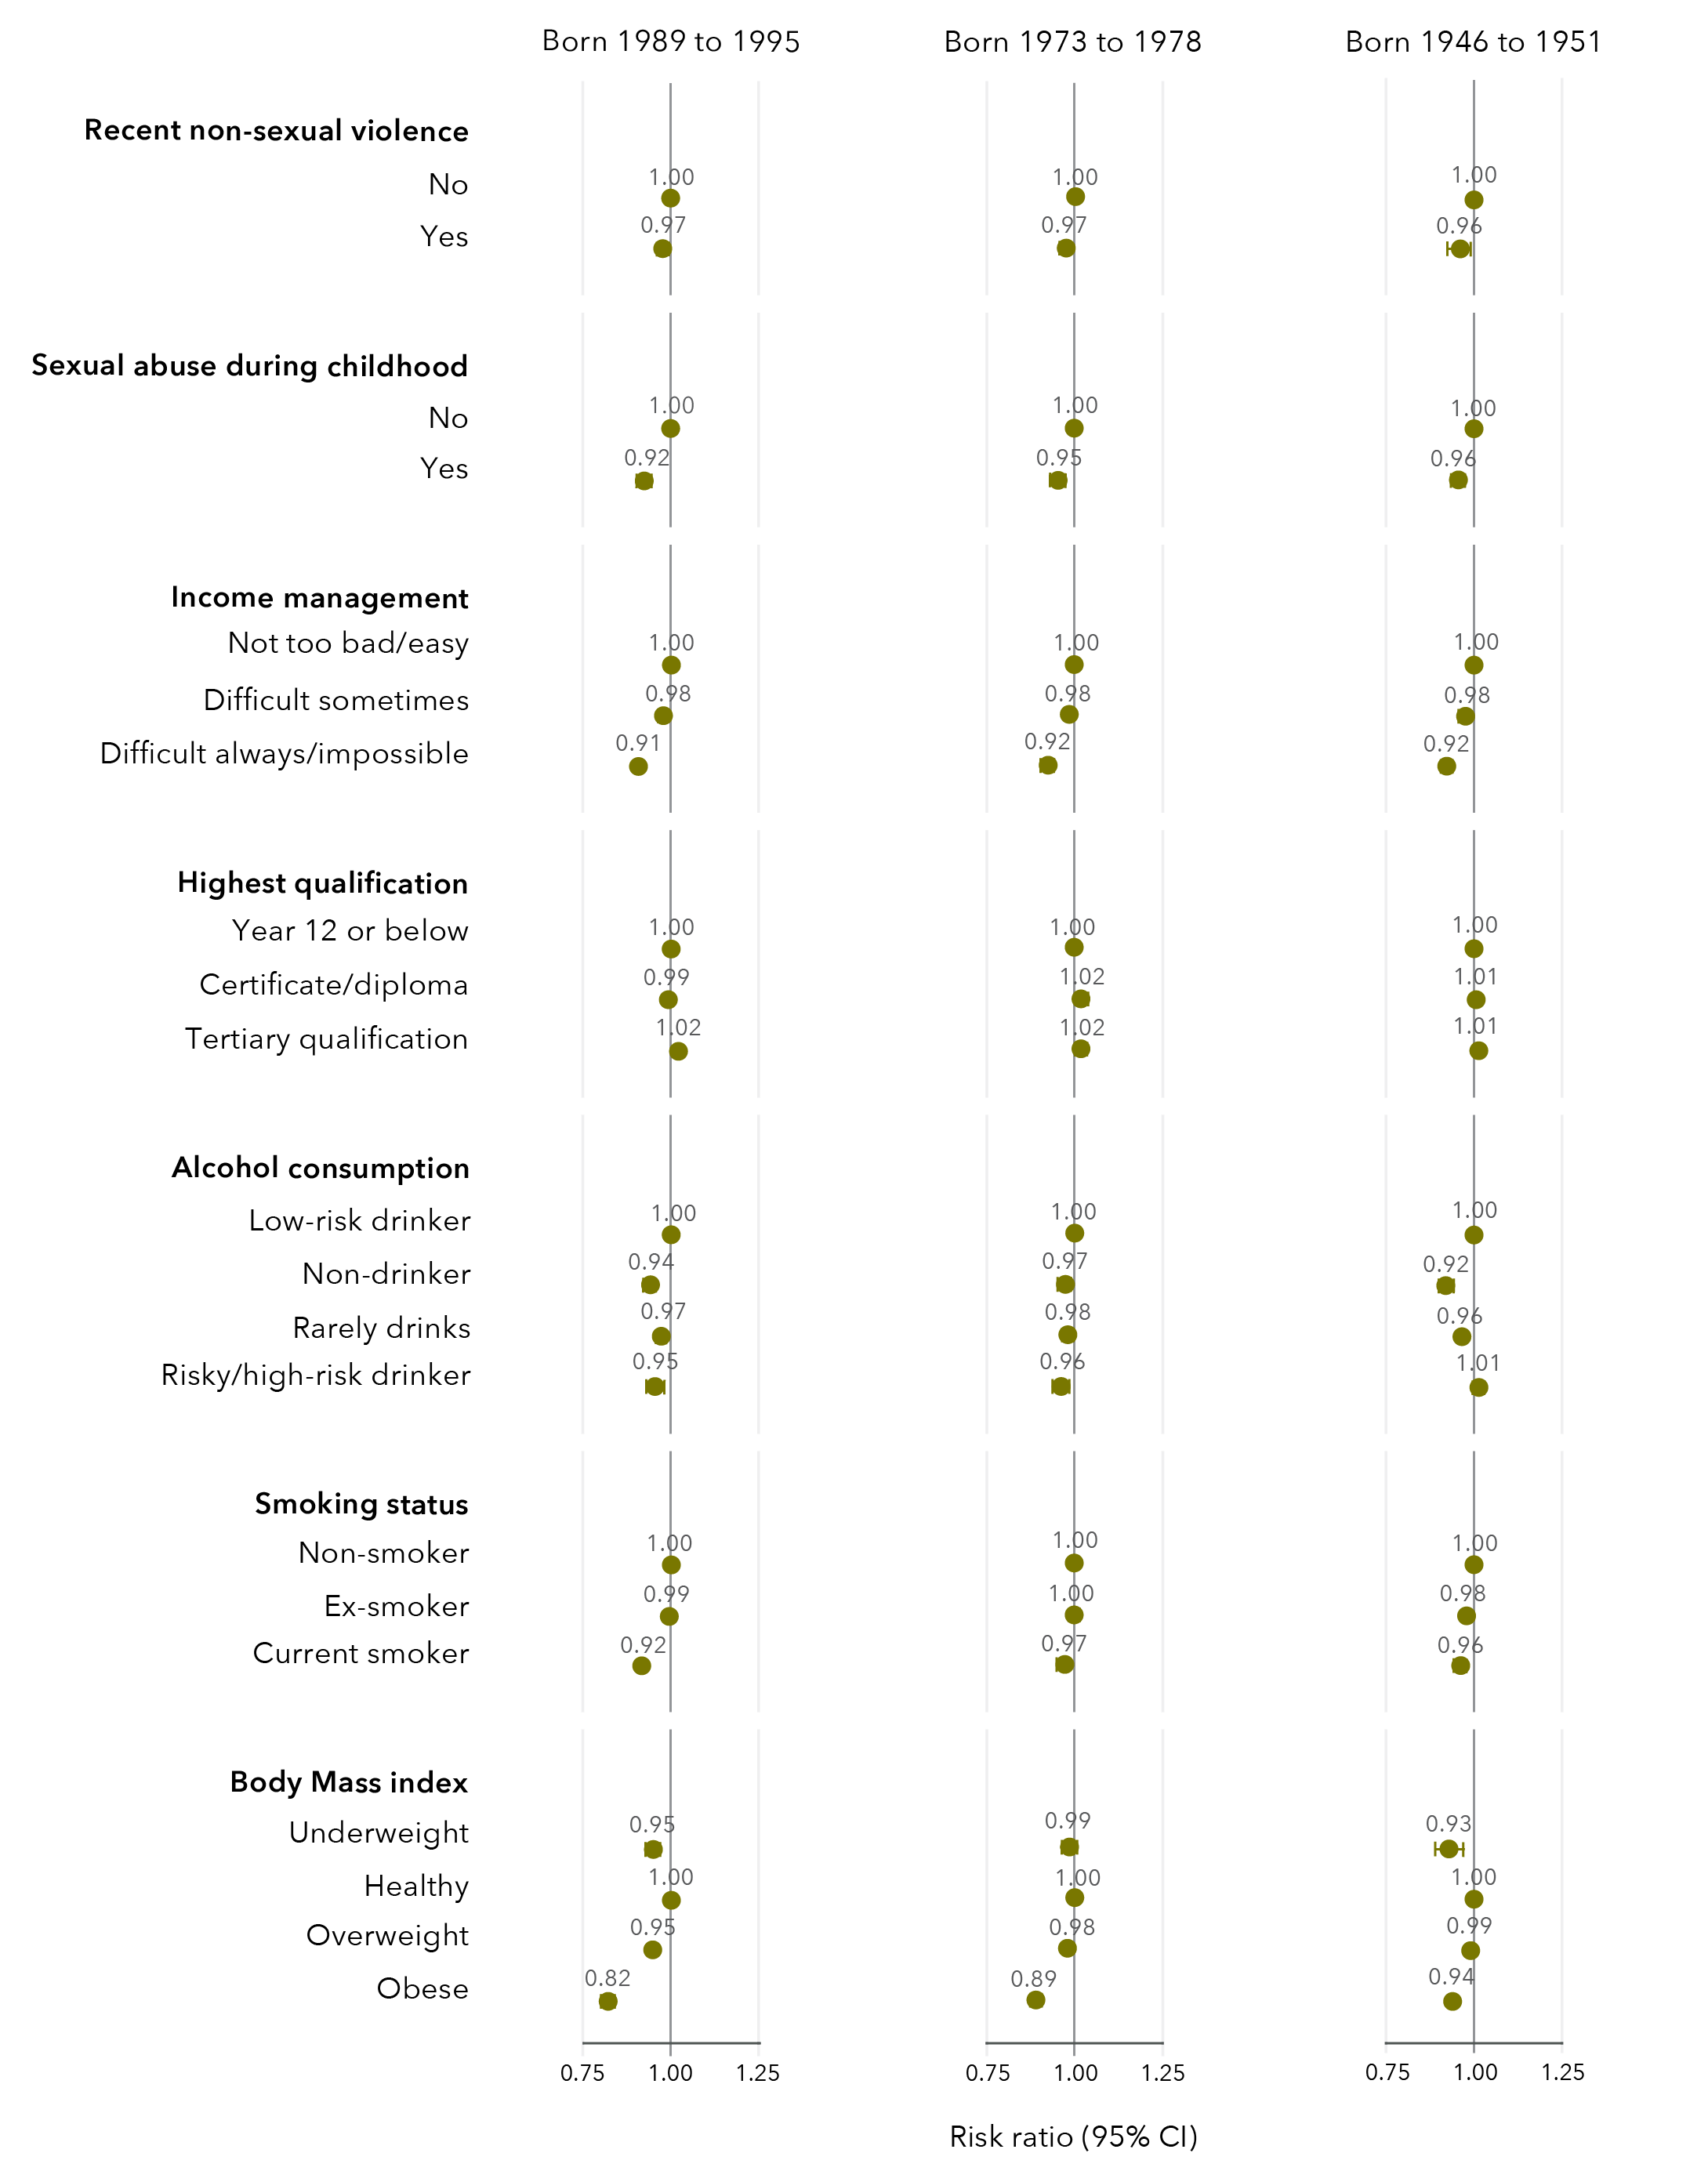
Data tables for figure 42:
Born 1989 to 1995
Recent non-sexual violence
Risk ratio Lower limit Upper limit No 1.00 No data No data Yes 0.97 0.96 0.98
Sexual abuse during childhood
Risk ratio Lower limit Upper limit No 1.00 No data No data Yes 0.92 0.90 0.94
Income management
Risk ratio Lower limit Upper limit Not too bad/easy 1.00 No data No data Difficult sometimes 0.98 0.97 0.98 Difficult always/impossible 0.91 0.90 0.92
Highest qualification
Risk ratio Lower limit Upper limit Year 12 or below 1.00 No data No data Certificate/diploma 0.99 0.98 1.01 Tertiary qualification 1.02 1.01 1.03
Alcohol consumption
Risk ratio Lower limit Upper limit Low risk drinker 1.00 No data No data Non-drinker 0.94 0.92 0.96 Rarely drinks 0.97 0.96 0.98 Risky/high risk drinker 0.95 0.93 0.98
Smoking status
Risk ratio Lower limit Upper limit Non-smoker 1.00 No data No data Ex-smoker 0.99 0.98 1.01 Current smoker 0.92 0.90 0.93
Body mass index
Risk ratio Lower limit Upper limit Underweight 0.95 0.93 0.97 Healthy 1.00 No data No data Overweight 0.95 0.94 0.96 Obese 0.82 0.81 0.84
Born 1973 to 1978
Recent non-sexual violence
Risk ratio Lower limit Upper limit No 1.00 No data No data Yes 0.97 0.96 0.99
Sexual abuse during childhood
Risk ratio Lower limit Upper limit No 1.00 No data No data Yes 0.95 0.94 0.97
Income management
Risk ratio Lower limit Upper limit Not too bad/easy 1.00 No data No data Difficult sometimes 0.98 0.97 0.99 Difficult always/impossible 0.92 0.91 0.94
Highest qualification
Risk ratio Lower limit Upper limit Year 12 or below 1.00 No data No data Certificate/diploma 1.02 1.00 1.03 Tertiary qualification 1.02 1.00 1.03
Alcohol consumption
Risk ratio Lower limit Upper limit Low risk drinker 1.00 No data No data Non-drinker 0.97 0.96 0.99 Rarely drinks 0.98 0.97 0.99 Risky/high risk drinker 0.96 0.94 0.98
Smoking status
Risk ratio Lower limit Upper limit Non-smoker 1.00 No data No data Ex-smoker 1.00 0.99 1.01 Current smoker 0.97 0.95 0.99
Body mass index
Risk ratio Lower limit Upper limit Underweight 0.99 0.96 1.01 Healthy 1.00 No data No data Overweight 0.98 0.97 0.99 Obese 0.89 1.10 1.14
Born 1946 to 1951
Recent non-sexual violence
Risk ratio Lower limit Upper limit No 1.00 No data No data Yes 0.96 0.93 0.99
Sexual abuse during childhood
Risk ratio Lower limit Upper limit No 1.00 No data No data Yes 0.96 0.94 0.97
Income management
Risk ratio Lower limit Upper limit Not too bad/easy 1.00 No data No data Difficult sometimes 0.98 0.97 0.98 Difficult always/impossible 0.92 0.91 0.94
Highest qualification
Risk ratio Lower limit Upper limit Year 12 or below 1.00 No data No data Certificate/diploma 1.01 0.99 1.02 Tertiary qualification 1.01 1.00 1.02
Alcohol consumption
Risk ratio Lower limit Upper limit Low risk drinker 1.00 No data No data Non-drinker 0.92 0.90 0.93 Rarely drinks 0.96 0.96 0.97 Risky/high risk drinker 1.01 1.00 1.03
Smoking status
Risk ratio Lower limit Upper limit Non-smoker 1.00 No data No data Ex-smoker 0.98 0.97 0.99 Current smoker 0.96 0.95 0.98
Body mass index
Risk ratio Lower limit Upper limit Underweight 0.93 0.89 0.97 Healthy 1.00 No data No data Overweight 0.99 0.98 1.00 Obese 0.94 0.93 0.95
Figure 43: Factors associated with a decreased likelihood of reporting good mental health
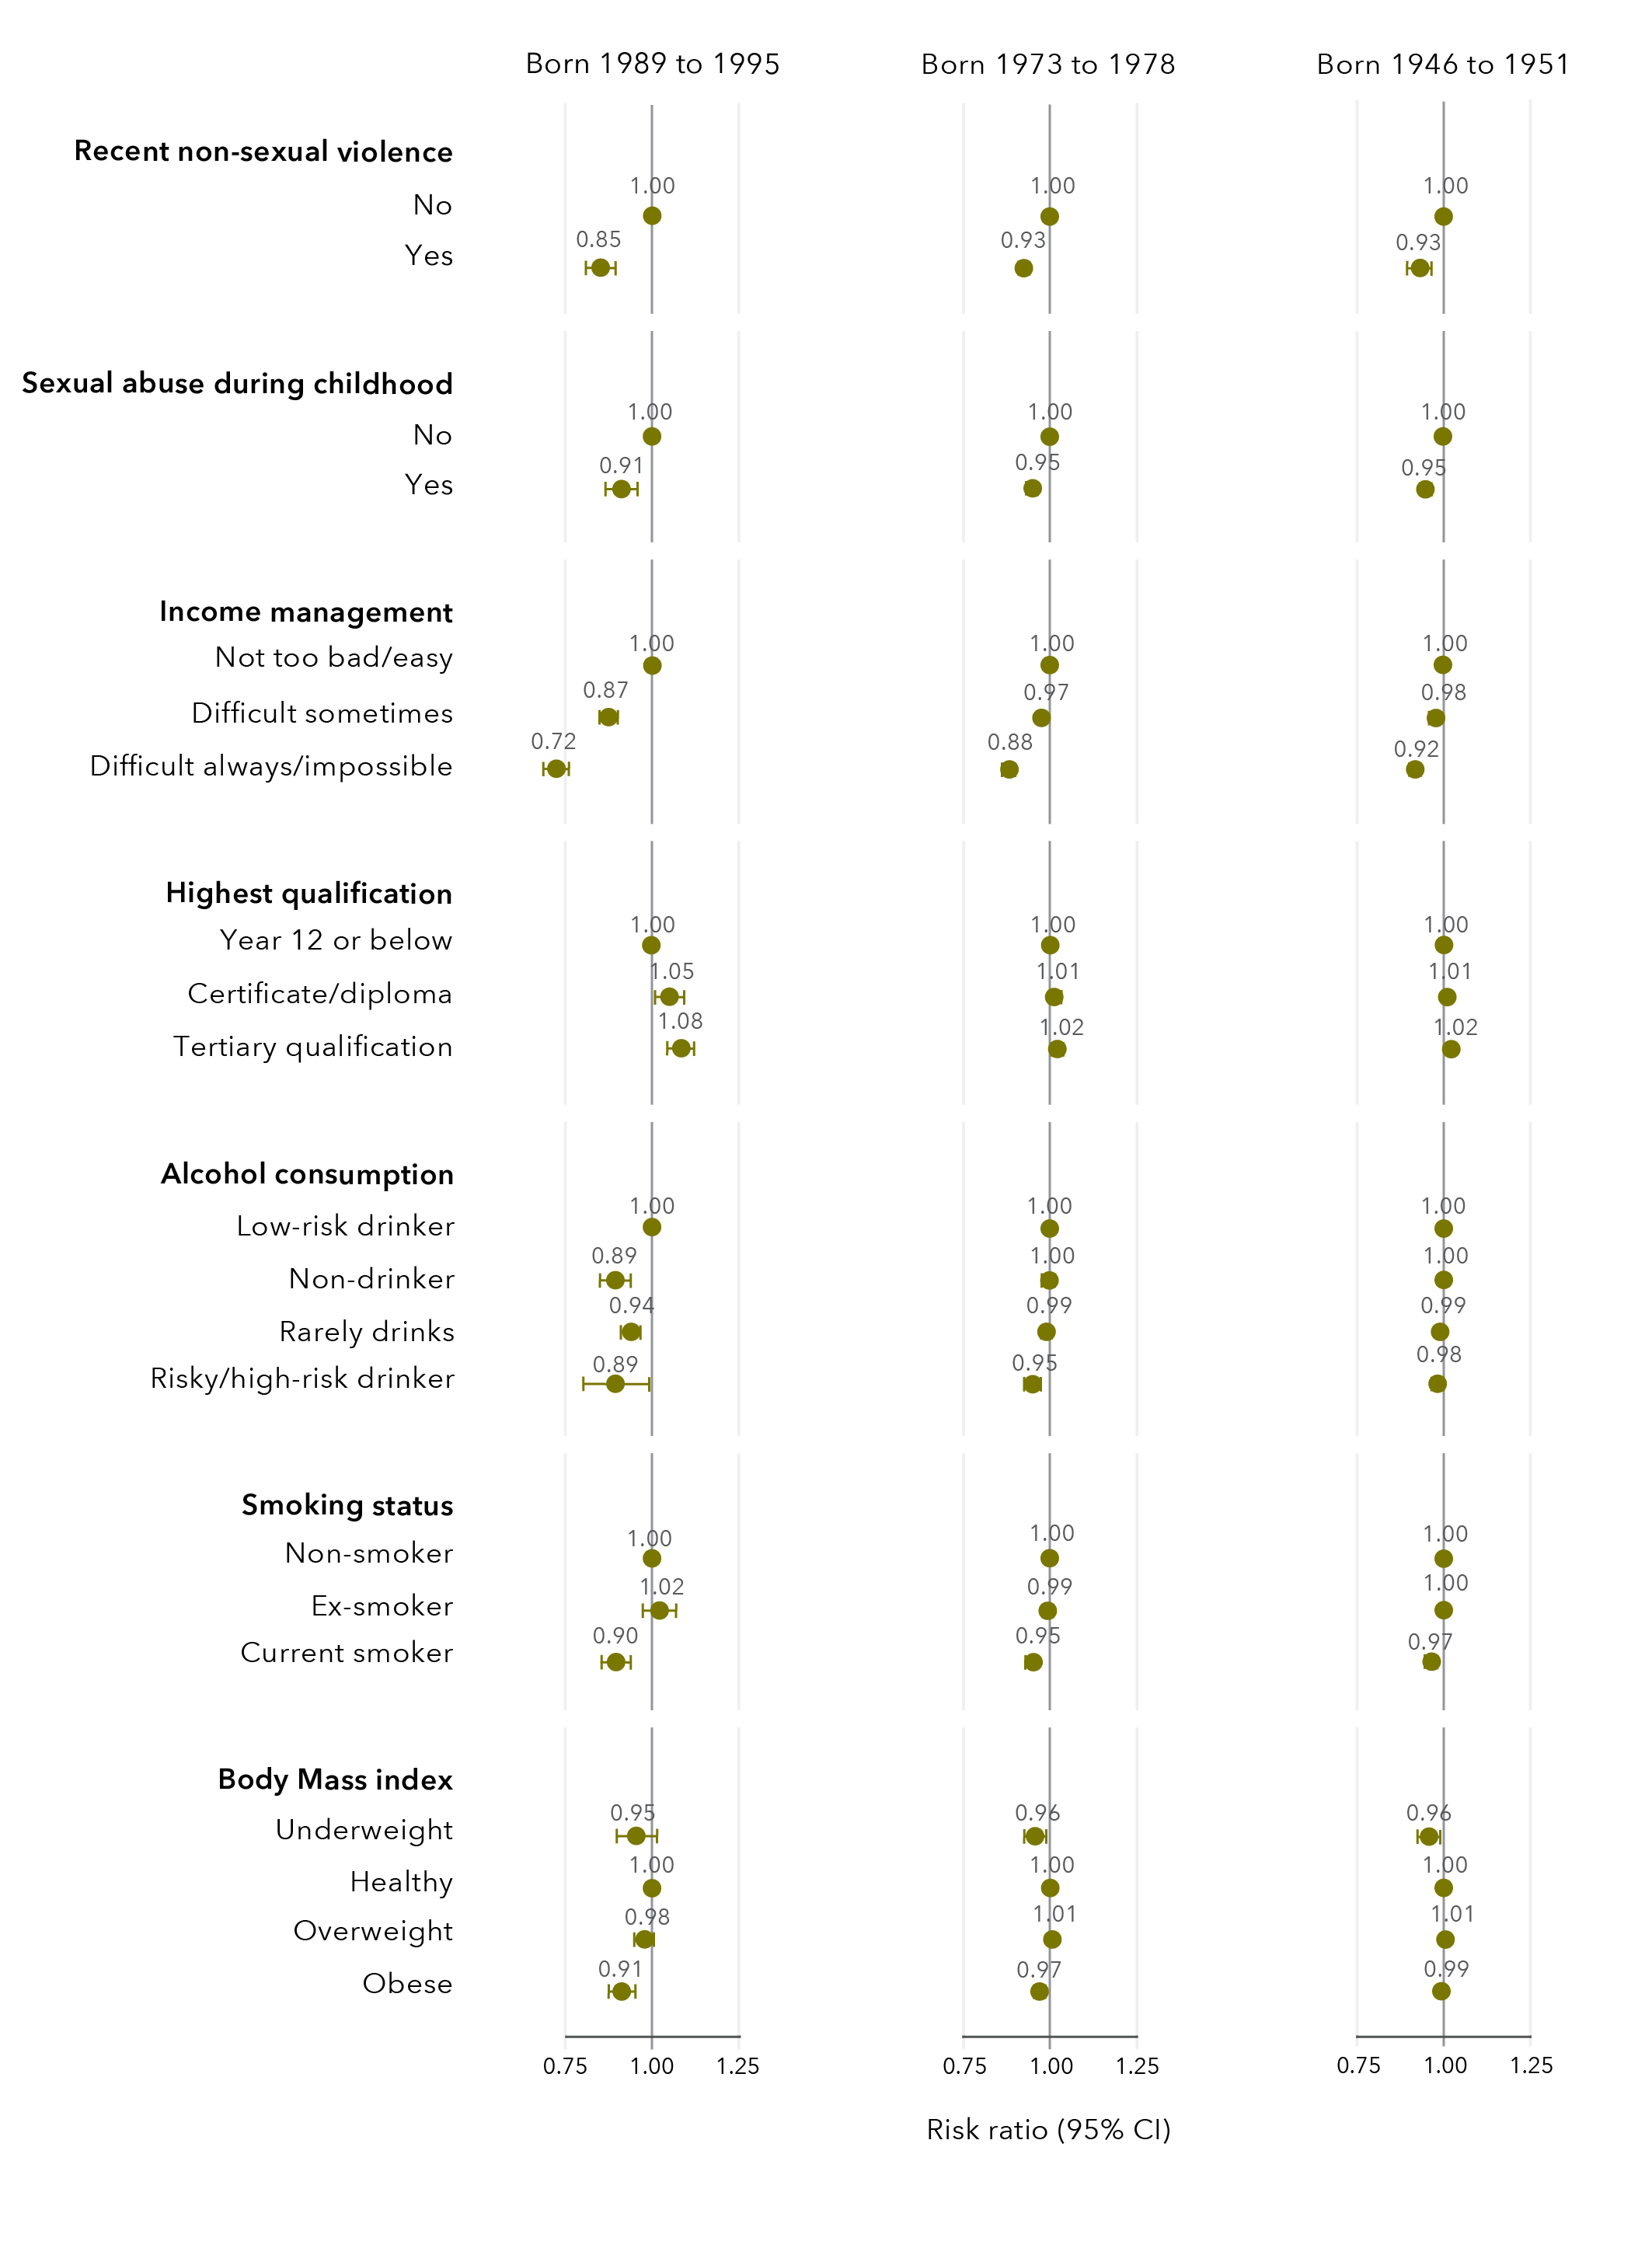
Data tables for figure 43:
Born 1989 to 1995
Recent non-sexual violence
Risk ratio Lower limit Upper limit No 1.00 No data No data Yes 0.85 0.81 0.90
Sexual abuse during childhood
Risk ratio Lower limit Upper limit No 1.00 No data No data Yes 0.91 0.87 0.96
Income management
Risk ratio Lower limit Upper limit Not too bad/easy 1.00 No data No data Difficult sometimes 0.87 0.85 0.90 Difficult always/impossible 0.72 0.69 0.76
Highest qualification
Risk ratio Lower limit Upper limit Year 12 or below 1.00 No data No data Certificate/diploma 1.05 1.01 1.09 Tertiary qualification 1.08 1.04 1.12
Alcohol consumption
Risk ratio Lower limit Upper limit Low risk drinker 1.00 No data No data Non-drinker 0.89 0.85 0.94 Rarely drinks 0.94 0.91 0.97 Risky/high risk drinker 0.89 0.80 1.00
Smoking status
Risk ratio Lower limit Upper limit Non-smoker 1.00 No data No data Ex-smoker 1.02 0.98 1.07 Current smoker 0.90 0.86 0.94
Body mass index
Risk ratio Lower limit Upper limit Underweight 0.95 0.90 1.02 Healthy 1.00 No data No data Overweight 0.98 0.95 1.01 Obese 0.91 0.88 0.95
Born 1973 to 1978
Recent non-sexual violence
Risk ratio Lower limit Upper limit No 1.00 No data No data Yes 0.93 0.91 0.94
Sexual abuse during childhood
Risk ratio Lower limit Upper limit No 1.00 No data No data Yes 0.95 0.93 0.97
Income management
Risk ratio Lower limit Upper limit Not too bad/easy 1.00 No data No data Difficult sometimes 0.97 0.96 0.98 Difficult always/impossible 0.88 0.86 0.90
Highest qualification
Risk ratio Lower limit Upper limit Year 12 or below 1.00 No data No data Certificate/diploma 1.01 1.00 1.03 Tertiary qualification 1.02 1.00 1.03
Alcohol consumption
Risk ratio Lower limit Upper limit Low risk drinker 1.00 No data No data Non-drinker 1.00 0.98 1.01 Rarely drinks 0.99 0.98 1.00 Risky/high risk drinker 0.95 0.92 0.97
Smoking status
Risk ratio Lower limit Upper limit Non-smoker 1.00 No data No data Ex-smoker 0.99 0.98 1.01 Current smoker 0.95 0.93 0.97
Body mass index
Risk ratio Lower limit Upper limit Underweight 0.96 0.93 0.99 Healthy 1.00 No data No data Overweight 1.01 1.00 1.02 Obese 0.97 0.96 0.98
Born 1946 to 1951
Recent non-sexual violence
Risk ratio Lower limit Upper limit No 1.00 No data No data Yes 0.93 0.90 0.97
Sexual abuse during childhood
Risk ratio Lower limit Upper limit No 1.00 No data No data Yes 0.95 0.93 0.96
Income management
Risk ratio Lower limit Upper limit Not too bad/easy 1.00 No data No data Difficult sometimes 0.98 0.97 0.98 Difficult always/impossible 0.92 0.91 0.93
Highest qualification
Risk ratio Lower limit Upper limit Year 12 or below 1.00 No data No data Certificate/diploma 1.01 1.00 1.02 Tertiary qualification 1.02 1.01 1.03
Alcohol consumption
Risk ratio Lower limit Upper limit Low risk drinker 1.00 No data No data Non-drinker 1.00 0.99 1.01 Rarely drinks 0.99 0.98 1.00 Risky/high risk drinker 0.98 0.97 1.00
Smoking status
Risk ratio Lower limit Upper limit Non-smoker 1.00 No data No data Ex-smoker 1.00 0.99 1.00 Current smoker 0.97 0.95 0.98
Body mass index
Risk ratio Lower limit Upper limit Underweight 0.96 0.93 0.99 Healthy 1.00 No data No data Overweight 1.01 1.00 1.01 Obese 0.99 0.98 1.00
Effect of health service use on mental health among women who have experienced sexual violence
Among women who had experienced sexual violence, 41 per cent of women aged 20 to 26 (in 2015), 29 per cent of women aged 40 to 45 (in 2018) and 10 per cent of women aged 68 to 73 (in 2019) reported a consultation with a counsellor or other mental health worker in the last 12 months. Among women who had experienced sexual violence, 19 per cent of women aged 24 to 30 (in 2019), 21 per cent of women aged 40 to 45 (in 2018) and 19 per cent of women aged 68 to 73 (in 2019) reported an improvement in their mental health since their last survey.
Women born in 1989 to 1995 who had experienced sexual violence were 17 per cent more likely to report an improvement in mental health if they had reported a mental health consultation in the last 12 months, compared to women who had not reported a mental health consultation in the last 12 months (Figure 44). Similarly, among women born in 1946 to 1951 who had experienced sexual violence, those who had reported a mental health consultation in the last 12 months were 9 per cent more likely to report an improvement in mental health compared to women who had not had a mental health consultation in the last 12 months.
Figure 44: Effect estimates for association between mental health consultations in the last 12 months and improvements in mental health
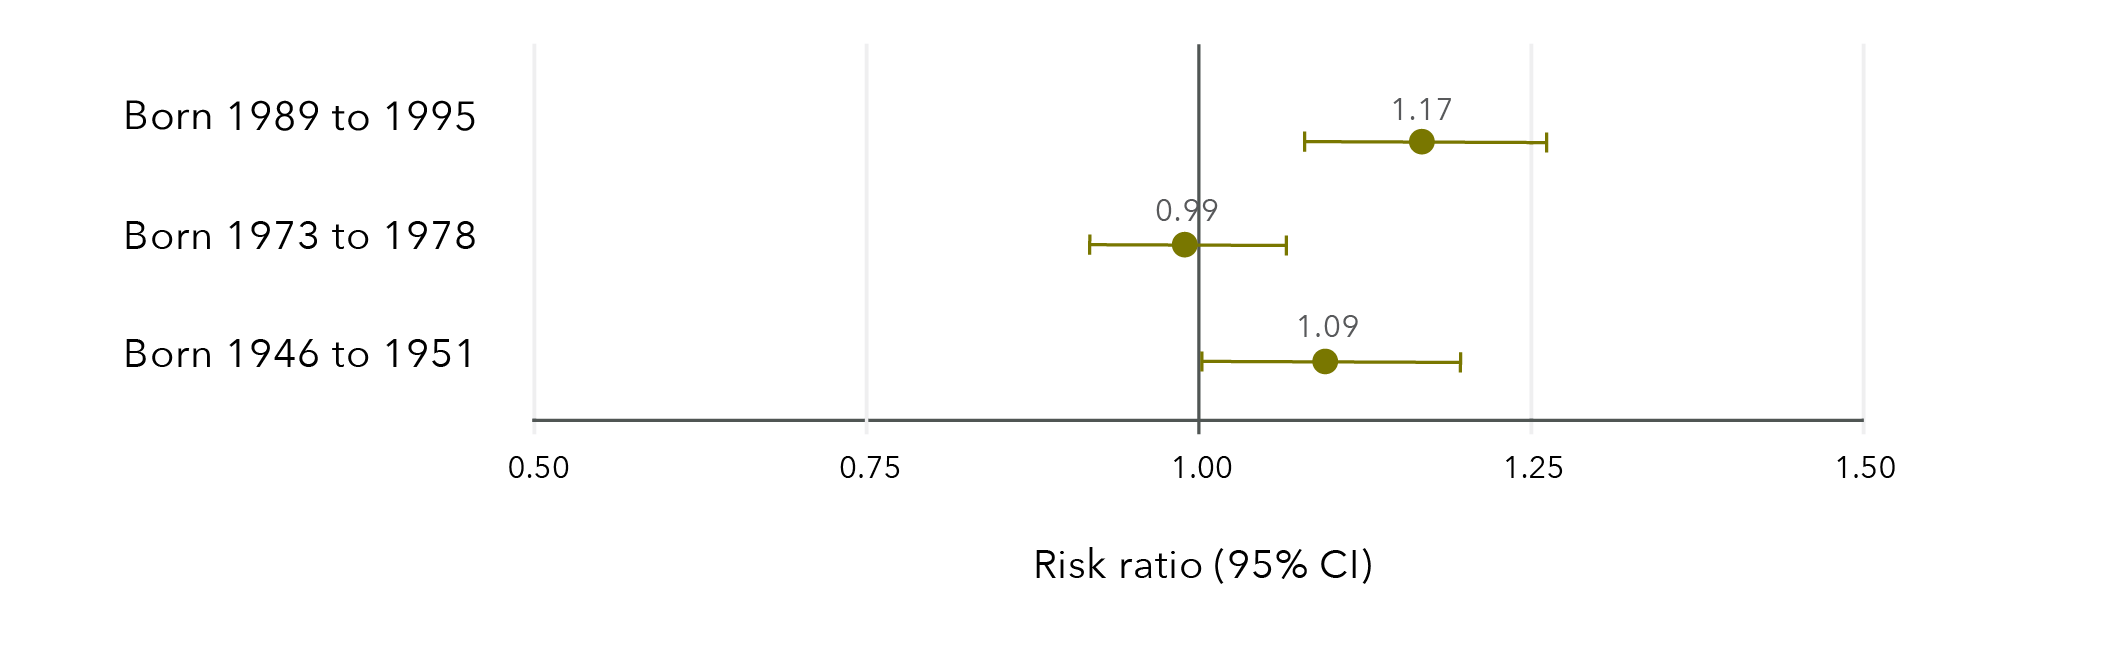
Note: Longitudinal models in Figure 44 were controlled for CALD status, age, highest qualification, area of residence, relationship status and ability to manage on available income.
Data table for figure 44:
Risk ratio Lower limit Upper limit Born 1989 to 1995 1.17 1.08 1.26 Born 1973 to 1978 0.99 0.92 1.07 Born 1946 to 1951 1.09 1.00 1.20
Wellbeing among women who have experienced sexual violence
Findings from the Australian Longitudinal Study on Women’s Health
Factors that reduced the likelihood of good general health and good mental health among women who had experienced sexual violence:
- Sexual violence during childhood.
- Recent non-sexual violence.
- Difficulty managing on available income.
- High alcohol consumption.
- Current smoking.
- Obesity.
Factors that were associated with good general health and good mental health among women who had experienced sexual violence:
- Physical activity.
- Emotional support and guidance*.
- Affection and social interaction*.
- Tangible or physical assistance (mental health only).
Women born 1989 to 1995 (aged 24 to 30 in 2019) and 1946 to 1951 (aged 68 to 73 in 2019) who had experienced sexual violence were
9 to 17% more likely
to report an improvement in mental health if they had reported a mental health consultation in the last 12 months, compared to women who had not reported a mental health consultation in the last 12 months**.
* Associations between good general health and emotional support and guidance and affection and social interaction were found for women born 1973 to 1978 and 1946 to 1951 only.
** Risk ratios varied for women born 1989 to 1995, 1973 to 1978, and 1946 to 1951.
Discussion
“Trauma lives on in ourselves. Our unconscious bodies are steps ahead of our conscious minds. When we’re triggered, we’re at the mercy of our emotional brain.
In this state, it’s impossible to discern between past and present.”
Grace Tame, National Press Club Address, February 2022
As 2021 Australian of the Year Grace Tame has pointed out, retelling experiences of sexual violence comes at a cost. Earlier research with women who participated in the ALSWH has also shown the emotional impact of disclosing experiences of violence (Loxton, Townsend, et al., 2017). To examine sexual violence over the life course means asking the same women to record these experiences on a regular basis. We start this discussion by acknowledging, with heartfelt thanks, the ongoing participation in the ALSWH of the women whose data have permitted the analyses included in this report.
The findings of this report reveal that experiencing sexual violence is common among women in Australia, with some variation by age indicating that sexual violence is more frequently reported by younger women. Across all cohorts, sexual violence in childhood was found to be a risk factor for experiencing further violence. In line with past research, sexual violence was associated with socioeconomic outcomes, including level of education and financial stress. Sexual violence was also associated with some adverse health behaviours. Regardless of age, women who experienced sexual violence had poorer health than women who had not experienced sexual violence, across all measures of both physical and mental health. As might be expected, sexual violence was also associated with higher primary healthcare costs, with mental health service access slightly higher but the costs similar between women who had and had not experienced sexual violence. Factorsassociated with wellbeing among women who had experienced sexual violence included physical activity and social support. These findings are discussed in more detail in the following sections.
Prevalence of sexual violence
More than half of women in their late twenties, one third of women in their early forties and a quarter of women in their late sixties and early seventies reported sexual violence in their lifetime. The results are not directly comparable to the PSS, which indicated one in five Australian women had experienced sexual violence (Australian Bureau of Statistics, 2017), due to sample and data capture differences. Other Australian studies have reported the lifetime prevalence of sexual violence at 17 per cent in South Australia (González-Chica et al., 2019) and 41 per cent among women visiting a general practitioner (Tarzia et al., 2018).
The ALSWH measures childhood sexual violence using a comprehensive subscale of the well-validated Adverse Childhood Experiences Scale (Felitti et al., 1998) and captures sexual violence in adulthood using a broad measure of “unwanted sexual activity”, which is consistent with approaches of the WHO, the Department of Social Services and the AIHW (Australian Institute of Health and Welfare, 2019a; Department of Social Services, 2019; World Health Organization et al., 2013). ALSWH data may result in higher prevalence rates of adult sexual violence compared to other studies due to the broad measures used by ALSWH and their lack of specificity concerning the sexual acts involved. However, we argue that relying on the respondent’s interpretation with regard to defining “sexual activity” offers a high level of subjective salience that is necessary to validly measure the incidence of sexual violence.
The results revealed wide variations in the prevalence of sexual violence by age, type of violence and priority population. The differences in prevalence by age may reflect generational differences in understanding, personal feelings about disclosing sexual violence and the time since the violence occurred (Loxton, Townsend, et al., 2017). Measurement differences will have also impacted these results – for example, the cohort born 1946 to 1951 was not specifically asked about sexual violence perpetrated by a partner. The findings indicate a much higher lifetime prevalence of sexual violence than has been previously reported in Australian national data. The broad definition of sexual violence that was used and the increased attention to sexual violence in the media with its impact on awareness have likely contributed to this difference.
Sexual violence during childhood was reported by 12 per cent of women born 1989 to 1995, 15 per cent of women born 1973 to 1978 and 14 per cent of women born 1946 to 1951. There was minimal variation in prevalence across the cohorts, with the most common form of childhood sexual violence being touching (11 to 14%) and the least common being attempted penetrative sexual violence (4 to 5%) and actual penetrative sexual violence (3 to 4%). The overall prevalence is more than the 11 per cent reported by the PSS (Australian Bureau of Statistics, 2017). However, the ALSWH defines childhood sexual violence as occurring before 18 years of age and the PSS uses a cut-off of 15 years, so ALSWH data incorporate a longer timeframe in which violence could occur. Two studies of pregnant women conducted in Victoria and Queensland found higher rates of childhood sexual violence, at 23 per cent (Gartland et al., 2016) and 31 per cent (Mills et al.,2016) respectively. Sample differences may account for these differences, with interpersonal violence being reported at higher levels in clinical samples than in community-based samples such as the ALSWH (Tarzia et al., 2017).
Lifetime sexual violence perpetrated by a partner was reported by 33 per cent of women aged 24 to 30 in 2019 and 14 per cent of women aged 40 to 45 in 2018. The same factors that drive differences in overall reporting are likely to drive the differences in reporting partner-perpetrated sexual violence. In addition, there are generational differences in the ways in which women define intimate relationships that might have impacted the results (Loxton, Dolja-Gore, et al., 2017; Stark et al., 2012). Similarly, recent studies have suggested that these generational effects may extend to women’s beliefs and perceptions about violence within relationships, further influencing how women respond to these items (Machado et al., 2014; Neves & Almeida, 2020).
Sexual violence occurring at any point in adulthood was reported by 39 per cent of women aged 24 to 30, compared with 18 per cent of women aged 40 to 45 and 12 per cent of those in their late sixties and early seventies. Recent sexual violence (within the previous 12 months) was found to fall slightly over time for all three cohorts: from 6 to 4 per cent for women born in 1989 to 1995; from 4 to 1 per cent for women born in 1973 to 1978; and from 1.8 to 0.3 per cent for women born in 1946 to 1951. While the results are encouraging, the percentage differences are small, so results should be viewed with caution. There are no comparable longitudinal data in Australia with which to compare these results. To ascertain improvements in prevalence rates of sexual violence with confidence, we need to continue to monitor the different cohorts and supplement this information with data gathered from other age groups and specific populations.
Among women born in 1989 to 1995 and 1973 to 1978, those who identified as bisexual reported a higher prevalence of sexual violence than women who identified as mainly or exclusively lesbian or heterosexual. This is in line with previous international research in this area (Black, 2011). However, the low number of women in the ALSWH cohorts who identify as bisexual limits the generalisability of our findings. Across the three ALSWH cohorts, women who identified as mainly or exclusively lesbian were more likely to report sexual violence than women who identified as being mainly or exclusively heterosexual. A previous study using ALSWH data reported a higher prevalence of sexual violence among women identifying as mainly heterosexual, bisexual and lesbian compared to women identifying as exclusively heterosexual (Szalacha et al., 2017). There is generally a lack of Australian and recent international data concerned with the prevalence of sexualviolence among those who identify as lesbian, gay, bisexual, queer, intersex or transgender (Campo & Tayton, 2015; Ussher et al., 2020). While the current report can contribute to this knowledge gap in a limited way, there is a need for more focused research in this area.
Although slightly lower, the prevalence of sexual violence among women from a CALD background was not dissimilar to the prevalence reported by women without a CALD background. This was seen across all three cohorts of women. As we have previously reported (Loxton, Townsend, et al., 2018), women from CALD backgrounds may be less likely to report experiencing interpersonal violence for various reasons. The AIHW highlighted the difficulties in understanding the prevalence of sexual violence among women from CALD communities. Findings from national data sources such as the Australian Bureau of Statistics’ PSS present conflicting results (Australian Institute of Health and Welfare, 2020). It was suggested that this may be due to the small number of women from CALD backgrounds participating in the survey, in addition to the barriers faced in disclosing experiences of violence.
There was a much higher prevalence of all types of sexual violence among women living with disability, major illness or injury when compared to those not living with disability, major illness or injury across all three cohorts. We have previously reported similar results in relation to domestic violence (Loxton, Townsend, et al., 2018). The findings were also in line with those of the 2016 PSS, which estimated a higher prevalence of sexual violence after the age of 15 among women living with disability compared to those without disability (16% versus 9.6%; Australian Bureau of Statistics, 2017).
Sexual violence during childhood as a risk factor for further violence
Findings indicated that sexual violence experienced in childhood was clearly associated with experiencing later sexual, physical and domestic violence for women born in 1989 to 1995 and women born in 1973 to 1978, even after adjusting for sociodemographic and economic status. These findings build on the growing body of evidence that has shown links between experiencing sexual violence in childhood and experiencing violence again later in life (Cox, 2015; Gartland et al., 2016; Öberg et al., 2021), underscoring the need for a better understanding of the link between childhood sexual violence and experiencing violence during adulthood.
Lifetime sexual violence and economic factors
Findings indicated associations between sexual violence and education, employment and financial stress, in keeping with past research (Baigorria et al., 2017). Sexual violence has been previously shown to predict poor academic performance (Baker et al., 2016) and lower education levels (Baigorria et al., 2017). The current report was able to show that life stage influences these findings. While women in their twenties and forties who had experienced sexual violence were less likely to have completed Year 12 than those who had not experienced sexual violence, the results for women in their sixties and seventies showed the reverse. That is, women born 1946 to 1951 who had experienced sexual violence were more likely to have a qualification beyond Year 12 than women who had not experienced sexual violence. Women who have experienced sexual violence may have been more likely to separate from a partner and, to support themselvesfinancially, undertaken further training. Women from the older cohort might have had more opportunity and time to complete this extra training.
Consideration of life stage was also important when examining paid employment in relation to sexual violence. Past research has indicated that sexual violence leads to disruptions to paid employment (Dillon et al., 2015), including a higher prevalence of unemployment (Showalter, 2016). Our results showed paid employment differences by cohort and as time passed. Sexual violence was related to a lower likelihood of paid employment among women born in 1989 to 1995, with the gap between those who had and had not experienced sexual violence widening as women moved through their twenties. No association between paid employment and sexual violence was found among women born in 1973 to 1978, whose employment status was similar from early adulthood until they were in their forties. Women born in 1946 to 1951 who had experienced sexual violence were more likely to be in paid employment than those who had not experienced sexual violence. This wasevident from when women were aged in their late forties until they were in their late sixties and early seventies.
Although education level and paid employment differed by age group, financial stress was consistently related to sexual violence across the three cohorts and over time. Past research has shown associations between sexual violence and financial hardship at particular points in time (Dillon et al., 2015; Loya, 2015; Showalter, 2016). The current research clearly shows that this is an enduring association that decreases over time but remains beyond retirement age.
Sexual violence and health behaviours
Findings of the current report showed a clear relationship between past sexual violence and recent illicit drug use, high-risk alcohol consumption, current tobacco use (smoking) and obesity among women in their twenties and forties. While past research had found relationships between sexual violence and these health behaviours in studies conducted overseas (Austin & Short, 2020; Bacchus et al., 2018; Clark et al., 2014; González-Chica et al., 2019; Stensland et al., 2015), the current research showed differences between generations. Women born in 1946 to 1951 who had experienced sexual violence were only slightly more likely to report high-risk alcohol consumption or obesity compared with those who had not experienced sexual violence. There were no differences for tobacco use in this cohort. Findings suggest that, with time, differences in adverse health behaviours attributable to experiencing sexual violence may be somewhat mitigated.However, the long-lasting nature of adverse health behaviours associated with sexual violence were clearly apparent for younger women. Given the health problems caused by substance use and misuse and obesity, early attention to the needs of women who have experienced sexual violence may prevent the onset of serious health problems in later life.
Little research has been conducted with regard to the presence of beneficial health behaviours among women who have experienced sexual violence. Analysis of ALSWH data revealed that despite the results for obesity, there were only slight differences in physical activity levels between women who had and had not experienced sexual violence. Results for screening were similar, with only slight differences in the uptake of cervical cancer screening and mammography (among women born in 1946 to 1951) in relation to sexual violence. While this has not been widely examined in past research, other population-based studies have reported similar findings with regard to screening behaviours. Previous analyses have suggested that women who have experienced intimate partner violence, including sexual violence, are less likely to undergo regular mammography and colorectal cancer screening than those who have not experienced intimate partner violence, althoughthese differences were small (Massetti et al., 2018; Watson-Johnson et al., 2012). Together the results suggest that sexual violence tends to be related to the presence of adverse or health-risk behaviours, rather than the absence of those behaviours that promote good health.
Sexual violence and health
Sexual violence was associated with an increased risk of poor mental and physical health across all of the measures included in this report. These findings were robust, even after adjusting for sociodemographic factors. Regardless of age or generation, women who had experienced sexual violence were more likely than women who had never experienced sexual violence to report fair to poor health, bodily pain, recent STIs, depression, anxiety, high stress and psychological distress (psychological distress was only measured in the 1989 to 1995 cohort). Differences between cohorts were minimal. The impact of sexual violence on general health and bodily pain were somewhat less and stress was slightly more apparent for older women. The findings strongly suggest a long-term detrimental health impact related to sexual violence.
Past research has indicated similar findings for both physical and mental health (Bacchus et al., 2018; Coles et al., 2014; Hailes et al., 2019; Reingle Gonzalez et al., 2018). The current study adds weight to current knowledge with the use of national, broadly representative data from three distinct generations. Using a measure of lifetime experiences of sexual violence that has been collected at multiple time points further permits the gravity of these health impacts to be considered and addressed.
Sexual violence and health services
Given the results for health, it might be expected that women who have experienced sexual violence would make high use of health services. However, previous results in this area have been inconclusive, with some studies reporting lower health service use (Graham et al., 2019; Massetti et al., 2018) in relation to sexual violence and others focusing on specific (Yang et al., 2014) rather than overall services.
Analysis of ALSWH data linked with Medicare data was conducted to provide an objective assessment of women’s use of health services in relation to self-reported sexual violence. We assessed government costs rather than including out-of-pocket costs that vary widely due to individual factors. Results showed that sexual violence was related to higher overall health service use costs for women born in 1989 to 1995 and 1973 to 1978 over the six-year and 21-year study periods, respectively. There was no difference in overall costs for women born 1946 to 1951 in relation to sexual violence. However, somewhat higher non-referred consultation costs were found across all three cohorts in relation to sexual violence.
With the higher prevalence of mental health issues among women who have experienced sexual violence, it was not surprising to note that there was higher uptake of Better Access initiative mental healthcare services for women who had experienced sexual violence. However, among women who accessed Better Access initiative mental health care services, costs were similar between women who had and had not experienced sexual violence. There were no differences in psychoactive prescription costs covered by the PBS in relation to sexual violence across the three cohorts.
The findings for health and health service use seem somewhat at odds with each other. It might have been expected that healthcare use and costs would be markedly higher for women who have experienced sexual violence. The lack of a cost difference related to mental health service use was particularly surprising, although we note that uptake was associated with sexual violence. One possible explanation concerns the perceived quality of the general practitioner services being provided. To access services through the Better Access initiative, a general practitioner must first be consulted. If this relationship is perceived as strained or not satisfactory, a patient may not pursue support (Rees et al., 2019). The findings of the current report showed that among women born in 1973 to 1978, those who had experienced sexual violence were less likely to report satisfaction with general practitioner services compared to women who had not experienced sexualviolence. This result is consistent with the results of a previously published analysis that showed women in this cohort who had experienced childhood sexual violence were less likely to be satisfied with general practitioner services than other women (Coles et al., 2015). It is also possible that healthcare needs are being provided through primary healthcare and other services not covered by Medicare, such as specialist counselling services and those subsidised through state government departments (e.g. counselling through NSW Department of Communities and Justice victim services). Nevertheless, these findings and the long-lasting health impact of sexual violence suggest possible unmet needs related to sexual violence. More research is needed in this area, particularly since our results showed a tendency for improvement in mental health related to mental health consultation uptake among women who had experienced sexual violence.
Wellbeing among women who have experienced sexual violence
To investigate the factors that might promote wellbeing, we analysed data from within the group of women who reported sexual violence and compared those who reported relatively good general and mental health with those who reported relatively fair to poor health. Factors that were associated with good general health included moderate to high levels of physical activity and social support – specifically emotional support and guidance, and affection and social interaction. Results were similar for factors associated with good mental health. There was a small positive impact for tangible or physical assistance and a positive impact among women born in 1989 to 1995 and 1946 to 1951 for the uptake of mental health consultations.
The findings build on past research that has shown the value of social support in women’s recovery from sexual violence (Dillon et al., 2015; Hunter et al., 2012) by identifying those aspects of support that might be the most valuable. Support offered through mental health services also appears promising in relation to recovery from sexual violence. Physical activity has previously been reported to assist with improvements in mental health (Hu et al., 2020; Yao et al., 2021). Our findings indicate that physical activity might also be useful in promoting better physical and mental health in the context of sexual violence.
Along with these positive impacts we found some factors that may impede wellbeing. High alcohol consumption, current smoking and obesity were found to impede wellbeing, as was difficulty managing on available income. All of these factors had also been found to be more common among women who had experienced sexual violence compared with those who had not. However, the effect sizes of these factors were small in relation to health, suggesting that a focus on the presence of a more strengths-based approach to recovery might be more beneficial for women who have experienced sexual violence than focusing on adverse health behaviours.
Strengths and limitations
This report uses the data from a large ongoing cohort study of Australian women spanning more than 21 years. With over 57,000 women in the study, the repeatedly collected data provide a solid base to investigate the interplay between health, wellbeing and other factors over time at the national level. The surveys have included questions about violence and trauma experienced over the life course, including experiencing violence during childhood, violence perpetrated by a partner and sexual violence. We were able to examine sexual violence across three generations: women born in 1989 to 1995, 1973 to 1978 and 1946 to 1951.
This places the study in a unique position to investigate sexual violence in relation to demographic, social, behavioural and economic factors using longitudinal analyses. This is often not possible as many studies investigating sexual violence are cross-sectional or do not collect comprehensive data on contextual or potentially confounding factors. Due to the rich data that have been collected, we were able to control for key factors in the analyses. Additionally, the survey data are linked to Medicare data, providing an opportunity to examine the impact of sexual violence on healthcare costs over time.
As with all surveys, there were some data limitations that must be noted. While the cohorts are broadly representative of Australian women of the same age (Dobson et al., 2015; Loxton, Tooth, et al., 2018), women who have tertiary qualifications are over-represented and some priority populations are likely to be under-represented (e.g. LGBTQA+ and intersex people and women from CALD backgrounds). It should be noted that, while Aboriginal and Torres Strait Islander women take part in the ALSWH, the data are not currently disaggregated by Indigenous status for historical and ethical reasons.[6] Due to legal and ethical considerations, it is not possible to ask for some specific details about acts of violence. This results in some limitations in the data, including precise timing, which in turn limits the ability to estimate duration of exposure tosexual violence. While this limitation made it difficult to determine the ideal time points for potential interventions, the long-lasting health impact of sexual violence makes this a moot point.
There were some differences in the available data by cohort and not all measurements were available at all time points for all cohorts. However, in several instances, similar measures were used to capture equivalent experiences (e.g. the Kessler Psychological Distress Scale used in the 1989 to 1995 cohort survey is comparable to the SF-36 mental health subscale used in the 1973 to 1978 and 1946 to 1951 cohort surveys). Questions on violence perpetrated by a partner were not available across multiple surveys for women in the 1946 to 1951 cohort; however, these data were consistently available for the 1989 to 1995 and 1973 to 1978 cohorts. Additionally, three topics addressed in the report were limited by low frequencies, which resulted in uncertainty around effect estimates. The low frequencies of women who had had a recent STI, who came from a CALD background or who identified as bisexual resulted in wide confidence intervals around the effectestimates. While PBS data were available prior to 2012, the earlier data excluded claims which were below the co-payment threshold; this restricted use of PBS data to that provided for 2012 onwards. Use of MBS data only includes information on formal health services under this scheme and does not account for informal and community health. Finally, we could not take account of unmeasured variables that warrant further attention – for example, whether women were involved in legal proceedings, the consequences for the perpetrator (e.g. incarceration) and the impact of this on wellbeing. Similarly, while we captured positive social interactions, adverse social interactions subsequent to sexual violence were not captured. These factors warrant future research and consideration.
Implications and recommendations for policy and practice
The National Plan consultation has identified sexual violence as an area in need of more policy development. Our results concur and offer some insight into the types of policy and practice responses that might assist women who have experienced sexual violence.
- A holistic response that takes account of women’s whole lives at both policy and practice levels is needed, given the high prevalence of sexual violence and its multiple impacts. Sexual violence impacts on many facets of women’s lives, including their economic wellbeing, health behaviour, physical health and mental health. Given the high prevalence of sexual violence and its multiple impacts, a holistic response that takes account of women’s whole lives at both the policy and practice level is needed. We recommend that sexual violence be considered a health risk within health policy development at every level of government.The scope of policy and practice responses needs to be expanded to encompass the number of women who have experienced sexual violence. We found that the lifetime prevalence of sexual violence may have been underestimated in previous research. At least one type of sexual violence was reported by 51 percent of women in their late twenties, 34 per cent of women in their early forties and 26 per cent of women in their sixties to early seventies.
- A clear focus on priority populations (e.g. LGBTQA+ and intersex people, women with disability, women from CALD backgrounds) is required in all policies addressing sexual violence. For example, we were able to ascertain that women who identify as lesbian, mainly lesbian or bisexual were at increased risk of sexual violence despite some limitations in the data, and the results clearly showed that women with disability, long-term illness or injury were at particular risk of sexual violence.
- There is a need for a broad, consistent definition of sexual violence. Our broad measures resulted in a much greater data capture of sexual violence and are in keeping with current national conversations concerning consent and current national and international definitions. Further consultation with stakeholder communities is needed, as noted in the next National Plan consultation process.
- Research should take a life course, longitudinal approach to estimating the prevalence of sexual violence. Prevalence of sexual violence differed by generation and over time. With consistent definitions, longitudinal data permit changes in prevalence to be captured and assessed in relation to policy initiatives.
- Service providers should employ a life course approach when delivering services to women who have experienced sexual violence. Health and social care providers have long reported that their clients have experienced violence more than once in their lives. The ALSWH data provide evidence at the population level that this is the case. Women who had experienced childhood sexual violence were more likely to experience violent acts in adulthood.
- Prevention programs and policies should be designed with consideration of potential behavioural drivers. A better understanding of alcohol and other drug uptake and use among women who have experienced sexual violence is necessary. However, the increased likelihood of adverse health behaviours among women who have experienced sexual violence indicates the need for a more nuanced lens in overall prevention program and policy development. For example, the National Obesity Strategy may have scope for the inclusion of trauma-informed policy within its remit, under the section concerned with determinants of health.
- Health and support services for women who have experienced sexual violence should be subsidised or free. There was a consistent association between sexual violence and financial stress. The strong association between sexual violence and poor health outcomes across all generations indicates a need for more health service support but the impact of financial stress might deter service access. It is noteworthy that in the context of sexual violence, better mental health was related to mental health service access.
- Health services can play a key role. Sexual violence was associated with health behaviour and with both mental and physical health outcomes that were long-lasting. Given its high prevalence, primary health practitioners are likely seeing women who have experienced sexual violence on a regular basis. Primary healthcare providers are, therefore, well placed to be the gateway to an intersectoral approach. While some training packages are available for general practitioners, a more coordinated approach is needed both within medical degree programs and as continuing education within the medical field. Furthermore, investment in primary healthcare and referral services will be needed to facilitate an intersectoral response to the health impact of sexual violence.
Directions for future research
Sexual violence has been the subject of a reasonable body of research. However, much of this has been conducted outside of the Australian context. The current report has filled gaps in national knowledge concerning prevalence and the impact of sexual violence on health and wellbeing, findings that underscore the need for a systemic response. More research is needed to expand this evidence base further, to assist with policy and practice development. While beyond the scope of the current report, there remains a need for research on prevention of sexual violence. This section includes the major areas where research is currently needed. Ongoing research is needed to assess the impact of initiatives designed to prevent sexual violence and to evaluate the rollout of programs designed to assist in recovery from sexual violence.
Distinct differences in prevalence were noted between generations, with sexual violence more commonly reported by younger women. There is a need to understand more fully what is driving these differences to assist in accurate prevalence ascertainment across the life course. Earlier work with ALSWH participants has revealed the value of qualitative interviews in understanding how and why women respond to questions about domestic violence (Loxton, Townsend, et al., 2017). This type of qualitative approach is likely to be the most useful in investigating generational differences in responses to questions that ask about sexual violence.
Other factors which may impact the wellbeing of women who have experienced violence include whether or not the woman was involved in legal proceedings and the consequences for the perpetrator (e.g. incarceration). The impact of the involvement of the legal system on women who have experienced sexual violence warrants further investigation.
We were able to ascertain that women who identify as lesbian, mainly lesbian or bisexual and women with disability were at particular risk of sexual violence, but the data were limited so results for women from CALD communities should be interpreted with caution. Research conducted in partnership with communities is needed to adequately describe and understand the contextual factors that influence disclosure of sexual violence, as well as the health and wellbeing of women who have experienced sexual violence and who belong to one or more priority populations.
There is no comprehensive understanding of why women who have experienced sexual violence at one stage of life are more likely to experience sexual and other forms of violence at later life stages. Research is needed in this area to provide the evidence base for policy and practice development, with a view to prevention of multiple experiences of violence over the life course.
The findings for economic wellbeing highlight the impact of sexual violence on education and paid work and the related impact on financial stress. It is easy to see how these factors are interrelated, but it is as yet unclear what could be done to alleviate these burdens. A mixed-methods study that uses qualitative data to investigate the nuances of economic impacts followed by quantitative scenario modelling of potential solutions could reveal potential interventions.
A better understanding of the drivers of adverse health behaviours for women who have experienced sexual violence is needed to inform prevention practice and policy development.
Findings suggested a potential unmet need for health services, and satisfaction with general practitioner services was lower for women who had experienced sexual violence. Long-term physical and mental health impacts and adverse health behaviours underscore the need for nuanced primary healthcare services and appropriate intersectoral referral networks that can address the needs of women who have experienced sexual violence. However, while our research clearly demonstrates the need for such services and provides some insight into what these needs are in a broad sense, the particulars of effective primary healthcare service provision have not been established (Hegarty et al., 2016). More research is needed into effective primary care service provision for women who have experienced sexual violence. Ideally, such research would take a co-production approach to permit the input of clinicians, researchers and women who have experienced sexual violenceto be incorporated into a scalable, testable model of primary healthcare.
Conclusion
Primary prevention is key to alleviating the traumatic and long-term impact of sexual violence; increasing awareness and the current public discussion about consent are promising. Yet, even with this progress, there are many women in our community, more than half of young women, who have already experienced sexual violence. The outcomes are grave and long-lasting, impacting economic security, health and wellbeing. There are reasons for hope – the next National Plan is under development with the promise of a focus on sexual violence, and findings here have shown the value of interpersonal support. Still, there is much work to be done in policy, practice and research, as we have also demonstrated.
The data provide a national picture of life for women who have experienced sexual violence. Findings emphasise the importance of accurate measurement, and the seriousness and longevity of adverse impacts. The results also indicate the need for a comprehensive understanding of and investment in primary healthcare and intersectoral support for women who have experienced sexual violence so that they can enjoy optimal wellbeing and avoid secondary traumatisation.
Author contributions
Deborah Loxton, Natalie Townsend and Peta Forder conceived and designed the research described in this report. The statistical analysis plan was drafted by Peta Forder and Nicholas Egan. Data analysis was conducted by Nicholas Egan. Deborah Loxton, Peta Forder, Nicholas Egan and Natalie Townsend interpreted the results. Isabelle Barnes reviewed relevant literature. Natalie Townsend, Isabelle Barnes and Emma Byrnes designed the summary infographics. All authors drafted, critically reviewed and approved content of the draft report.
References
Aakvaag, H. F., Thoresen, S., Strøm, I. F., Myhre, M., & Hjemdal, O. K. (2019). Shame predicts revictimization in victims of childhood violence: A prospective study of a general Norwegian population sample. Psychological Trauma, 11(1), 43–50. https://doi.org/10.1037/tra0000373
Alaggia, R., Collin-Vézina, D., & Lateef, R. (2017). Facilitators and barriers to child sexual abuse (CSA) disclosures: A research update (2000–2016). Trauma, Violence, & Abuse, 20(2), 260–283. https://doi.org/10.1177/1524838017697312
Austin, A. E., & Short, N. A. (2020). Sexual violence, mental health, and prescription opioid use and misuse. American Journal of Preventive Medicine, 59(6), 818–827. https://doi.org/10.1016/j.amepre.2020.06.019
Australia’s National Research Organisation for Women’s Safety. (2019). Intimate partner sexual violence: Research synthesis (2nd Ed.; ANROWS Insights, 08/2019). ANROWS
Australian Bureau of Statistics. (2012). Information paper: Use of the Kessler Psychological Distress Scale in ABS health surveys, Australia, 2007–08. https://www.abs.gov.au/ausstats/abs@.nsf/lookup/4817.0.55.001chapter92007-08
Australian Bureau of Statistics. (2017). Personal Safety Survey, Australia, 2016, ABS cat. no. 4906.0. https://www.abs.gov.au/ausstats/abs@.nsf/mf/4906.0
Australian Bureau of Statistics. (2021). Understanding full-time and part-time work. https://www.abs.gov.au/articles/understanding-full-time-and-part-time-work
Australian Government Department of Health. (2019). Pharmaceutical Benefits Scheme collection of under co-payment data. https://www.pbs.gov.au/info/statistics/under-co-payment/under-co-payment-data
Australian Institute of Health and Welfare. (2018). Family, domestic and sexual violence in Australia, 2018. https://www.aihw.gov.au/reports/domestic-violence/family-domestic-sexual-violence-in-australia-2018
Australian Institute of Health and Welfare. (2019a). Family, domestic and sexual violence in Australia: Continuing the national story. https://www.aihw.gov.au/getmedia/b0037b2d-a651-4abf-9f7b-00a85e3de528/aihw-fdv3-FDSV-in-Australia-2019.pdf.aspx?inline=true
Australian Institute of Health and Welfare. (2019b). People with disability in Australia. https://www.aihw.gov.au/reports/disability/people-with-disability-in-australia
Australian Institute of Health and Welfare. (2020). Sexual assault in Australia, Cat. no. FDV 5. https://www.aihw.gov.au/getmedia/0375553f-0395-46cc-9574-d54c74fa601a/aihw-fdv-5.pdf.aspx?inline=true
Australian Longitudinal Study on Women’s Health. (2019). Technical report #42. https://alswh.org.au/wp-content/uploads/2020/10/ALSWH-Technical-Report-42_Final_March-2020.pdf
Bacchus, L. J., Ranganathan, M., Watts, C., & Devries, K. (2018). Recent intimate partner violence against women and health: A systematic review and meta-analysis of cohort studies. BMJ Open, 8(7), e019995. https://doi.org/10.1136/bmjopen-2017-019995
Baigorria, J., Warmling, D., Magno Neves, C., Delziovo, C. R., & Salema Coelho, E. B. (2017). Prevalence and associated factors with sexual violence against women: Systematic review. Revista de salud publica (Bogota, Colombia), 19(6), 818–826. https://doi.org/10.15446/rsap.v19n6.65499
Baker, M. R., Frazier, P. A., Greer, C., Paulsen, J. A., Howard, K., Meredith, L. N., Anders, S. L., & Shallcross, S. L. (2016). Sexual victimization history predicts academic performance in college women. Journal of Counseling Psychology, 63(6), 685–692. https://doi.org/10.1037/cou0000146
Bidarra, Z. S., Lessard, G., & Dumont, A. (2016). Co-occurrence of intimate partner violence and child sexual abuse: Prevalence, risk factors and related issues. Child Abuse & Neglect, 55, 10–21. https://doi.org/10.1016/j.chiabu.2016.03.007
Black, M. C., Basile, K.C., Breiding, M.J., Smith, S.G., Walters, M.L., Merrick, M.T., Chen, J., & Stevens, M.R. (2011). The National Intimate Partner and Sexual Violence Survey (NISVS): 2010 summary report. https://www.cdc.gov/ViolencePrevention/pdf/NISVS_Report2010-a.pdf
Bone, C. W., Goodfellow, A. M., Vahidi, M., & Gelberg, L. (2018). Prevalence of sexual violence and its association with depression among male and female patients with risky drug use in urban federally qualified health centers. Journal of Urban Health, 95(1), 111–115. https://doi.org/10.1007/s11524-017-0213-7
Bonomi, A., Nichols, E., Kammes, R., & Green, T. (2018). Sexual violence and intimate partner violence in college women with a mental health and/or behavior disability. Journal of Women’s Health, 27(3), 359–368. https://doi.org/10.1089/jwh.2016.6279
Bradel, L., Rosenbaum, A., & Orcutt, H. (2019). The prevalence and co-occurrence of the forms of violence against women. Journal of Aggression, Maltreatment & Trauma, 28(7), 870–887. https://doi.org/10.1080/10926771.2018.1463338
Breiding, M.J. (2015). Prevalence and characteristics of sexual violence, stalking, and intimate partner violence victimization: National Intimate Partner and Sexual Violence Survey, United States, 2011. American Journal of Public Health, 105(4), e11–e12.
Brener, N. D., McMahon, P. M., Warren, C. W., & Douglas, K. A. (1999). Forced sexual intercourse and associated health-risk behaviors among female college students in the United States. Journal of Consulting and Clinical Psychology, 67(2), 252–259. https://doi.org/10.1037/0022-006X.67.2.252
Brown, W. J., Bauman, A., Bull, F., & Burton, N. W. (2013). Development of evidence-based physical activity recommendations for adults (18–64 years). Australian Government Department of Health and Aged Care https://www.health.gov.au/resources/publications/development-of-evidence-based-physical-activity-for-adults-18-to-64-years
Brown, W. J., Bryson, L., Byles, J. E., Dobson, A. J., Lee, C., Mishra, G., & Schofield, M. (1998). Women’s Health Australia: Recruitment for a national longitudinal cohort study. Women & Health, 28(1), 23–40.
Campo, M., & Tayton, S. (2015). Intimate partner violence in lesbian, gay, bisexual, trans, intersex and queer communities: Key issues, CFCA Practitioner Resource. Australian Institute of Family Studies. https://aifs.gov.au/cfca/publications/intimate-partner-violence-lgbtiq-communities
Carr, A., Duff, H., & Craddock, F. (2020). A systematic review of the outcome of child abuse in long-term care. Trauma, Violence, & Abuse, 21(4), 660–677. https://doi.org/10.1177/1524838018789154
Clark, C. J., Spencer, R. A., Everson-Rose, S. A., Brady, S. S., Mason, S. M., Connett, J. E., Henderson, K. M., To, M., & Suglia, S. F. (2014). Dating violence, childhood maltreatment, and BMI from adolescence to young adulthood. Pediatrics, 134(4), 678–685. https://doi.org/10.1542/peds.2014-1179
Coles, J., Lee, A., Taft, A., Mazza, D., & Loxton, D. (2014). Childhood sexual abuse and its association with adult physical and mental health: Results from a national cohort of young Australian women. Journal of Interpersonal Violence, 30(11), 1929–1944. https://doi.org/10.1177/0886260514555270
Coles, J., Lee, A., Taft, A., Mazza, D., & Loxton, D. (2015). General practice service use and satisfaction among female survivors of childhood sexual abuse. Australian Family Physician, 44(1–2), 71–76.
Conley, A. H., Overstreet, C. M., Hawn, S. E., Kendler, K. S., Dick, D. M., & Amstadter, A. B. (2017). Prevalence and predictors of sexual assault among a college sample. Journal of American College Health, 65(1), 41–49. https://doi.org/10.1080/07448481.2016.1235578
Cox, P. (2015). Sexual assault and domestic violence in the context of co-occurrence and re-victimisation: State of knowledge paper (ANROWS Landscapes, 13/2015). ANROWS https://www.anrows.org.au/publication/sexual-assault-and-domestic-violence-in-the-context-of-co-occurrence-and-re-victimisation-state-of-knowledge-paper/
Craner, J. R., Martinson, A. A., Sigmon, S. T., & McGillicuddy, M. L. (2015). Prevalence of sexual trauma history using behaviorally specific methods of assessment in first year college students. Journal of Child Sexual Abuse, 24(5), 484–505. https://doi.org/10.1080/10538712.2015.1026014
Davidson, S. K., Dowrick, C. F., & Gunn, J. M. (2016). Impact of functional and structural social relationships on two year depression outcomes: A multivariate analysis. Journal of Affective Disorders, 193, 274–281. https://doi.org/10.1016/j.jad.2015.12.025
Department of Social Services. (2019). Fourth Action Plan: National Plan to Reduce Violence against Women and their Children 2010–2022. https://www.dss.gov.au/women-publications-articles-reducing-violence/fourth-action-plan
Dillon, G., Hussain, R., & Loxton, D. (2015). Intimate partner violence in the young cohort of the Australian longitudinal study on women’s health: urban/rural comparison and demographic associations. Advances in Mental Health, 13(1), 18–29. https://doi.org/10.1080/18374905.2015.1039752
Dobson, A. J., Hockey, R., Brown, W. J., Byles, J. E., Loxton, D. J., McLaughlin, D., Tooth, L. R., & Mishra, G. D. (2015). Cohort profile update: Australian Longitudinal Study on Women’s Health. International Journal of Epidemiology, 44(5), 1547–1547f. https://doi.org/10.1093/ije/dyv110
Elder, G. H., Johnson, M. K., & Crosnoe, R. (2003). The emergence and development of life course theory. In J. T. Mortimer & M. J. Shanahan (Eds.), Handbook of the life course (pp. 3–19). Springer US. https://doi.org/10.1007/978-0-306-48247-2_1
Ellsberg, M., Arango, D. J., Morton, M., Gennari, F., Kiplesund, S., Contreras, M., & Watts, C. (2015). Prevention of violence against women and girls: What does the evidence say? Lancet, 385(9977), 1555–1566. https://doi.org/10.1016/s0140-6736(14)61703-7
Felitti, V. J., Anda, R. F., Nordenberg, D., Williamson, D. F., Spitz, A. M., Edwards, V., Koss, M. P., & Marks, J. S. (1998). Relationship of childhood abuse and household dysfunction to many of the leading causes of death in adults: The Adverse Childhood Experiences (ACE) Study. American Journal of Preventive Medicine, 14(4), 245–258. https://doi.org/10.1016/s0749-3797(98)00017-8
Finkelhor, D., Shattuck, A., Turner, H., & Hamby, S. (2014). The lifetime prevalence of child sexual abuse and sexual assault assessed in late adolescence. Journal of Adolescent Health, 55. https://doi.org/10.1016/j.jadohealth.2013.12.026
Fitzgerald, D. (2022). GP Satisfaction. ALSWH https://alswh.org.au/wp-content/uploads/2020/08/DDSSection2.4GPSatisfaction_1.pdf
Gartland, D., Woolhouse, H., Giallo, R., McDonald, E., Hegarty, K., Mensah, F., Herrman, H., & Brown, S. J. (2016). Vulnerability to intimate partner violence and poor mental health in the first 4-year postpartum among mothers reporting childhood abuse: An Australian pregnancy cohort study. Archives of Women’s Mental Health, 19(6), 1091–1100. https://doi.org/10.1007/s00737-016-0659-8
González-Chica, D. A., Licinio, J., Musker, M., Wong, M., Bowden, J., Hay, P., Chittleborough, C., & Stocks, N. (2019). Bullying and sexual abuse and their association with harmful behaviours, antidepressant use and health-related quality of life in adulthood: A population-based study in South Australia. BMC Public Health, 19(1), 26. https://doi.org/10.1186/s12889-018-6367-8
Graham, A. C., Mallinson, R. K., Krall, J. R., & Annan, S. L. (2019). Sexual assault, campus resource use, and psychological distress in undergraduate women. Journal of Interpersonal Violence, 36(21-22), 10361–10382. https://doi.org/10.1177/0886260519884689
Hailes, H. P., Yu, R., Danese, A., & Fazel, S. (2019). Long-term outcomes of childhood sexual abuse: An umbrella review. Lancet Psychiatry, 6(10), 830–839. https://doi.org/10.1016/s2215-0366(19)30286-x
Harris, M. L., Loxton, D., Sibbritt, D. W., & Byles, J. E. (2013). The influence of perceived stress on the onset of arthritis in women: Findings from the Australian Longitudinal Study on Women’s Health. Annals of Behavioral Medicine, 46(1), 9–18. https://doi.org/10.1007/s12160-013-9478-6
Hegarty, K., Tarzia, L., Hooker, L., & Taft, A. (2016). Interventions to support recovery after domestic and sexual violence in primary care. International Review of Psychiatry, 28(5), 519–532. https://doi.org/10.1080/09540261.2016.1210103
Hellman, A. (2014). Examining sexual assault survival of adult women: responses, mediators, and current theories. Journal of Forensic Nursing, 10(3), 175–184 https://doi.org/10.1097/jfn.0000000000000037
Herbert, A., Heron, J., Barter, C., Szilassy, E., Barnes, M., Howe, L., Feder, G., & Fraser, A. (2021). Risk factors for intimate partner violence and abuse among adolescents and young adults: Findings from a UK population-based cohort. Wellcome Open Research, 5(176). https://doi.org/10.12688/wellcomeopenres.16106.1
Heywood, W., Myers, P., Powell, A., Meikle, G., & Nguyen, D. (2022). Report on the prevalence of sexual harassment and sexual assault among university students in 2021, National Student Safety Survey [Report]. Social Research Centre. https://apo.org.au/node/317074
Hu, M. X., Turner, D., Generaal, E., Bos, D., Ikram, M. K., Ikram, M. A., Cuijpers, P., & Penninx, B. W. J. H. (2020). Exercise interventions for the prevention of depression: A systematic review of meta-analyses. BMC Public Health, 20(1), 1255. https://doi.org/10.1186/s12889-020-09323-y
Hugo Centre for Migration and Population Research. (2018). Accessibility/Remoteness Index of Australia (ARIA). The University of Adelaide. https://able.adelaide.edu.au/hugo-centre/services/aria
Hunter, B. A., Robison, E., & Jason, L. A. (2012). Characteristics of sexual assault and disclosure among women in substance abuse recovery homes. Journal of Interpersonal Violence, 27(13), 2627–2644. https://doi.org/10.1177/0886260512436389
Kennedy, A. C., Bybee, D., Moylan, C. A., McCauley, H. L., & Prock, K. A. (2021). Predictors of sexual violence across young women’s relationship histories. Journal of Interpersonal Violence, 36(11–12), Np5944–np5964. https://doi.org/10.1177/0886260518811439
Kessler, R. C., Andrews, G., Colpe, L. J., Hiripi, E., Mroczek, D. K., Normand, S. L. T., Walters, E. E., & Zaslavsky, A. M. (2002). Short screening scales to monitor population prevalences and trends in non-specific psychological distress. Psychological Medicine, 32(6), 959–956. https://doi.org/10.1017/S0033291702006074
Khadr, S., Clarke, V., Wellings, K., Villalta, L., Goddard, A., Welch, J., Bewley, S., Kramer, T., & Viner, R. (2018). Mental and sexual health outcomes following sexual assault in adolescents: A prospective cohort study. Lancet Child & Adolescent Health, 2(9), 654–665. https://doi.org/10.1016/s2352-4642(18)30202-5
Kisely, S., Strathearn, L., & Najman, J. M. (2020). Child maltreatment and mental health problems in 30-year-old adults: A birth cohort study. Journal of Psychiatric Research, 129, 111–117. https://doi.org/10.1016/j.jpsychires.2020.06.009
Lewis, R. J., Padilla, M. A., Milletich, R. J., Kelley, M. L., Winstead, B. A., Lau-Barraco, C., & Mason, T. B. (2015). Emotional distress, alcohol use, and bidirectional partner violence among lesbian women. Violence Against Women, 21(8), 917–938. https://doi.org/10.1177/1077801215589375
Loxton, D., Dolja-Gore, X., Anderson, A. E., & Townsend, N. (2017). Intimate partner violence adversely impacts health over 16 years and across generations: A longitudinal cohort study. PLoS One, 12(6), e0178138. https://doi.org/10.1371/journal.pone.0178138
Loxton, D., Powers, J., Anderson, A. E., Townsend, N., Harris, M. L., Tuckerman, R., Pease, S., Mishra, G., & Byles, J. (2015). Online and offline recruitment of young women for a longitudinal health survey: Findings From the Australian Longitudinal Study on Women’s Health 1989-95 cohort. Journal of Medical Internet Research, 17(5), e109. https://doi.org/10.2196/jmir.4261
Loxton, D., Powers, J., Fitzgerald, D., Forder, P., Anderson, A., Taft, A., & Hegarty, K. (2013). The Community Composite Abuse Scale: Reliability and validity of a measure of intimate partner violence in a community survey from the ALSWH. Journal of Women’s Health, Issues and Care, 2(4), 1–7. https://doi.org/10.4172/2325-9795.1000115
Loxton, D., Tooth, L., Harris, M. L., Forder, P. M., Dobson, A., Powers, J., Brown, W., Byles, J., & Mishra, G. (2018). Cohort profile: The Australian Longitudinal Study on Women’s Health (ALSWH) 1989–95 cohort. International Journal of Epidemiology, 47(2), 391–392e. https://doi.org/10.1093/ije/dyx133
Loxton, D., Townsend, N., Barnes, I., & Forder, P. (2019). Family, Domestic and Sexual Violence: Mini report of infographics –Findings from the Australian Longitudinal Study on Women’s Health. Australian Government Department of Social Services.
Loxton, D., Townsend, N., Cavenagh, D., & Green, L. (2017). Measuring domestic violence in longitudinal research. Australian Government Department of Social Services. https://plan4womenssafety.dss.gov.au/wp-content/uploads/2018/07/Measuring-Domestic-Violence-in-Longitudinal-Research.pdf
Loxton, D., Townsend, N., Forder, P., & Coombe, J. (2018). Domestic violence, risk factors and health: Report prepared for the Australian Government Department of Social Services. Australian Government Department of Social Services. https://plan4womenssafety.dss.gov.au/wp-content/uploads/2019/03/domestic-violence-risk-factors-and-health-2018.pdf
Loya, R. (2015). Rape as an economic crime: The impact of sexual violence on survivors’ employment and economic well-being. Journal of Interpersonal Violence, 30(16), 2793–2813. https://doi.org/10.1177/0886260514554291
Lysova, A., Dim, E., & Dutton, D. (2019). Prevalence and consequences of intimate partner violence in canada as measured by the National Victimization Survey. Partner Abuse, 10(2), 199–221. https://doi.org/10.1891/1946-6560.10.2.199
Machado, C., Martins, C., & Caridade, S. (2014). Violence in intimate relationships: A comparison between married and dating couples. Journal of Criminology, 2014, 897093. https://doi.org/10.1155/2014/897093
Massetti, G. M., Townsend, J. S., Thomas, C. C., Basile, K. C., & Richardson, L. C. (2018). Healthcare access and cancer screening among victims of intimate partner violence. Journal of Women’s Health, 27(5), 607–614. https://doi.org/10.1089/jwh.2017.6402
Mathews, B., Bromfield, L., Walsh, K., Cheng, Q., & Norman, R. E. (2017). Reports of child sexual abuse of boys and girls: Longitudinal trends over a 20-year period in Victoria, Australia. Child Abuse & Neglect, 66, 9–22. https://doi.org/10.1016/j.chiabu.2017.01.025
Melka, A., Chojenta, C., Holliday, E., & Loxton, D. (2019). Adverse childhood experiences and electronic cigarette use among young Australian women. Preventive Medicine, 126, 105759. https://doi.org/10.1016/j.ypmed.2019.105759
Merrick, M. T., Ford, D. C., Ports, K. A., & Guinn, A. S. (2018). Prevalence of adverse childhood experiences from the 2011–2014 behavioral risk factor surveillance system in 23 states. JAMA Pediatrics, 172(11), 1038–1044. https://doi.org/10.1001/jamapediatrics.2018.2537
Miller-Graff, L. E., Howell, K. H., Grein, K., & Keough, K. (2021). Women’s cigarette and marijuana use in pregnancy: Identifying the role of past versus recent violence exposure. Journal of Interpersonal Violence, 36(7–8), Np3982–np3998. https://doi.org/10.1177/0886260518779068
Mills, R., Kisely, S., Alati, R., Strathearn, L., & Najman, J. (2016). Self-reported and agency-notified child sexual abuse in a population-based birth cohort. Journal of Psychiatric Research, 74, 87–93. https://doi.org/10.1016/j.jpsychires.2015.12.021
Mishra, G., Hockey, R., Powers, J., Loxton, D., Tooth, L., Rowlands, I., Byles, J., & Dobson, A. J. (2014). Recruitment via the internet and social networking sites: The 1989–1995 cohort of the Australian Longitudinal Study on Women’s Health. Journal of Medical Internet Research, 16(12), e279. https://doi.org/10.2196/jmir.3788
Mokdad, A. H., Forouzanfar, M. H., Daoud, F., Mokdad, A. A., El Bcheraoui, C., Moradi-Lakeh, M., Kyu, H. H., Barber, R. M., Wagner, J., Cercy, K., Kravitz, H., Coggeshall, M., Chew, A., O’Rourke, K. F., Steiner, C., Tuffaha, M., Charara, R., Al-Ghamdi, E. A., Adi, Y., … Murray, C. J. (2016). Global burden of diseases, injuries, and risk factors for young people’s health during 1990–2013: A systematic analysis for the Global Burden of Disease Study 2013. Lancet, 387(10036), 2383–2401. https://doi.org/10.1016/s0140-6736(16)00648-6
Mørk, T., Andersen, P. T., & Taket, A. (2014). Barriers among Danish women and general practitioners to raising the issue of intimate partner violence in general practice: a qualitative study. BMC Women’s Health, 14, 74. https://doi.org/10.1186/1472-6874-14-74
Moulding, N., Franzway, S., Wendt, S., Zufferey, C., & Chung, D. (2021). Rethinking women’s mental health after intimate partner violence. Violence Against Women, 27(8), 1064–1090. https://doi.org/10.1177/1077801220921937
Muldoon, K., Smith, G., Talarico, R., Heimerl, M., McLean, C., Sampsel, K., & Manuel, D. (2019). A 15-year population-based investigation of sexual assault cases across the province of Ontario, Canada, 2002–2016. American Journal of Public Health, 109(9), 1280–1287. https://doi.org/10.2105/AJPH.2019.305179
Nemeth, J. M., Bonomi, A. E., Lu, B., Lomax, R. G., & Wewers, M. E. (2016). Risk factors for smoking in rural women: The role of gender-based sexual and intimate partner violence. Journal of Women’s Health, 25(12), 1282–1291. https://doi.org/10.1089/jwh.2015.5640
Neves, A., & Almeida, I. (2020). Beliefs about intimate partner violence: Gender and generation effects. In Psychology and law: Research for practice (pp. 63–74). Sciendo. https://doi.org/10.2478/9788395669682-006
Nikischer, A. B. (2014). Dreams deferred: The impact of sexual assault during adolescence on the educational outcomes and life choices of women. Adult Education Research Conference. https://newprairiepress.org/aerc/2014/papers/58,
Norman, G. R., Sloan, J. A., & Wyrwich, K. W. (2003). Interpretation of changes in health-related quality of life: The remarkable universality of half a standard deviation. Medical Care, 41(5), 582–592. https://doi.org/10.1097/01.MLR.0000062554.74615.4C
Öberg, M., Skalkidou, A., & Heimer, G. (2019). Experiences of sexual violence among women seeking services at a family planning unit in Sweden. Upsala Journal of Medical Sciences, 124(2), 135–139. https://doi.org/10.1080/03009734.2019.1604587
Öberg, M., Skalkidou, A., Heimer, G., & Lucas, S. (2021). Sexual violence against women in Sweden: Associations with combined childhood violence and sociodemographic factors. Scandinavian Journal of Public Health, 49(3), 292–300. https://doi.org/10.1177/1403494820939015
Oram, S., Khalifeh, H., & Howard, L. M. (2017). Violence against women and mental health. The Lancet Psychiatry, 4(2), 159–170. https://doi.org/10.1016/s2215-0366(16)30261-9
Parliament of Australia. (2006). Measuring domestic violence and sexual assault against women. https://www.aph.gov.au/about_parliament/parliamentary_departments/parliamentary_library/publications_archive/archive/violenceagainstwomen
Pols, R. G., Hawks, D., National Health and Medical Research Council (Australia), & National Health and Medical Research Council (Australia) Health Care Committee. (1992). Is there a safe level of daily consumption of alcohol for men and women? Recommendations regarding responsible drinking behaviour. Australian Government Publication Service.
Rees, S., Simpson, L., McCormack, C. A., Moussa, B., & Amanatidis, S. (2019). Believe #metoo: Sexual violence and interpersonal disclosure experiences among women attending a sexual assault service in Australia: A mixed-methods study. BMJ Open, 9(7), e026773. https://doi.org/10.1136/bmjopen-2018-026773
Reingle Gonzalez, J. M., Jetelina, K. K., Olague, S., & Wondrack, J. G. (2018). Violence against women increases cancer diagnoses: Results from a meta-analytic review. Preventive Medicine, 114, 168–179. https://doi.org/10.1016/j.ypmed.2018.07.008
Relyea, M., & Ullman, S. E. (2017). Predicting sexual assault revictimization in a longitudinal sample of women survivors: Variation by type of assault. Violence Against Women, 23(12), 1462–1483. https://doi.org/10.1177/1077801216661035
Sanz-Barbero, B., Barón, N., & Vives-Cases, C. (2019). Prevalence, associated factors and health impact of intimate partner violence against women in different life stages. PLoS One, 14(10), e0221049. https://doi.org/10.1371/journal.pone.0221049
Sherbourne, C. D., & Stewart, A. L. (1991). The MOS social support survey. Social Science and Medicine, 32(6), 705–714. https://doi.org/10.1016/0277-9536(91)90150-b
Showalter, K. (2016). Women’s employment and domestic violence: A review of the literature. Aggression and Violent Behavior, 31, 37–47. https://doi.org/10.1016/j.avb.2016.06.017
Sigurvinsdottir, R., & Ullman, S. E. (2016). Sexual orientation, race, and trauma as predictors of sexual assault recovery. Journal of Family Violence, 31(7), 913–921. https://doi.org/10.1007/s10896-015-9793-8
Silva, F. C. d., Monge, A., Landi, C. A., Zenardi, G. A., Suzuki, D. C., & Vitalle, M. S. d. S. (2020). The effects of sexual violence experienced in childhood and adolescence on undergraduate students. Revista de saude publica, 54, 134–134. https://doi.org/10.11606/s1518-8787.2020054002576
Stark, M., Kirk, A., & Bruhn, R. (2012). Generational differences as a determinant of women’s perspectives on commitment. Adultspan Journal, 11. https://doi.org/10.1002/j.2161-0029.2012.00010.x
Stensland, S., Thoresen, S., Wentzel-Larsen, T., & Dyb, G. (2015). Interpersonal violence and overweight in adolescents: The HUNT study. Scandinavian Journal of Public Health, 43(1), 18–26. https://doi.org/10.1177/1403494814556176
Sutherland, M. A., Fantasia, H. C., & Hutchinson, M. K. (2016). Screening for intimate partner and sexual violence in college women: Missed opportunities. Women’s Health Issues, 26(2), 217–224. https://doi.org/10.1016/j.whi.2015.07.008
Szalacha, L. A., Hughes, T. L., McNair, R., & Loxton, D. (2017). Mental health, sexual identity, and interpersonal violence: Findings from the Australian Longitudinal Women’s Health Study. BMC Women’s Health, 17(1), 94. https://doi.org/10.1186/s12905-017-0452-5
Tarzia, L., Maxwell, S., Valpied, J., Novy, K., Quake, R., & Hegarty, K. (2017). Sexual violence associated with poor mental health in women attending Australian general practices. Australian and New Zealand Journal of Public Health, 41(5), 518–523. https://doi.org/10.1111/1753-6405.12685
Tarzia, L., Thuraisingam, S., Novy, K., Valpied, J., Quake, R., & Hegarty, K. (2018). Exploring the relationships between sexual violence, mental health and perpetrator identity: A cross-sectional Australian primary care study. BMC Public Health, 18(1), 1410. https://doi.org/10.1186/s12889-018-6303-y
Taylor, J., & Shrive, J. (2021). “I thought it was just a part of life”: Understanding the scale of violence committed against women in the UK since birth. Victim Focus. https://irp.cdn-website.com/f9ec73a4/files/uploaded/Key-Facts-Document-VAWG-VictimFocus-2021a.pdf
Taylor, S.C., Pugh J., Goodwach R., & Coles J. (2012). Sexual trauma in women: The importance of identifying a history of sexual violence. Australian Family Physician, 41(7), 538–541. https://doi.org/10.3316/informit.582009099454887
Ussher, J. M., Hawkey, A., Perz, J., Liamputtong, P., Marjadi, B., Schmied, V., Dune, T., Sekar, J. A., Ryan, S., Charter, R., Thepsourinthone, J., Noack-Lundberg, K., & Brook, E. (2020). Crossing the line: Lived experience of sexual violence among trans women of colour from culturally and linguistically diverse (CALD) backgrounds in Australia (Research report, 14/2020). https://20ian81kynqg38bl3l3eh8bf-wpengine.netdna-ssl.com/wp-content/uploads/2019/01/RP.17.03-Experiences-of-trans_women-and-DV_RR.1.pdf
Walsh, K., Gilmore, A. K., Schumacher, J. A., Coffey, S. F., Frazier, P. A., Ledray, L., Acierno, R., Ruggiero, K. J., Kilpatrick, D. G., & Resnick, H. S. (2020). Post-sexual assault cigarette smoking: Findings from a randomized clinical trial of a video-based intervention. Addictive Behaviors, 100, 106121. https://doi.org/10.1016/j.addbeh.2019.106121
Ware, J. E., & Sherbourne, C. D. (1992). The MOS 36-Item Short-Form Health Survey (SF-36): Conceptual framework and item selection. Medical Care, 30(6), 473–483.
Watson-Johnson, L. C., Townsend, J. S., Basile, K. C., & Richardson, L. C. (2012). Cancer screening and history of sexual violence victimization among US adults. Journal of Women’s Health, 21(1), 17–25. https://doi.org/10.1089/jwh.2011.2751
Willis, M. (2011). Non-disclosure of violence in Australian Indigenous communities. Trends & issues in crime and criminal justice. Australian Institute of Criminology. https://www.aic.gov.au/publications/tandi/tandi405
Wincentak, K., Connolly, J., & Card, N. (2016). Teen dating violence: A meta-analytic review of prevalence rates. Psychology of Violence, 7(2), 224–241. https://doi.org/10.1037/a0040194
Woolhouse, H., Gartland, D., Mensah, F., & Brown, S. J. (2015). Maternal depression from early pregnancy to 4 years postpartum in a prospective pregnancy cohort study: Implications for primary health care. BJOG, 122(3), 312–321. https://doi.org/10.1111/1471-0528.12837
World Health Organization. (2014). Child maltreatment global estimates. https://apps.who.int/gho/data/view.main.VIOLENCECHILDMALTREATMENTv
World Health Organization. (2017). Violence against women. https://www.who.int/news-room/fact-sheets/detail/violence-against-women
World Health Organization, Department of Reproductive Health and Research, London School of Hygiene and Tropical Medicine, & South African Medical Research Council. (2013). Global and regional estimates of violence against women: Prevalence and health effects of intimate partner violence and nonpartner sexual violence. WHO. https://www.who.int/reproductivehealth/publications/violence/9789241564625/en/
World Health Organization, & London School of Hygiene and Tropical Medicine. (2010). Preventing intimate partner and sexual violence against women: Taking action and generating evidence. WHO. https://www.who.int/reproductivehealth/publications/violence/9789241564007/en/
Yang, J., Miller, T. R., Zhang, N., LeHew, B., & Peek-Asa, C. (2014). Incidence and cost of sexual violence in Iowa. American Journal of Preventive Medicine, 47(2), 198–202. https://doi.org/10.1016/j.amepre.2014.04.005
Yao, L., Fang, H., Leng, W., Li, J., & Chang, J. (2021). Effect of aerobic exercise on mental health in older adults: A meta-analysis of randomized controlled trials [Review]. Frontiers in Psychiatry, 12. https://doi.org/10.3389/fpsyt.2021.748257
Ybarra, M. L., Espelage, D. L., Langhinrichsen-Rohling, J., Korchmaros, J. D., & Boyd, d. (2016). Lifetime prevalence rates and overlap of physical, psychological, and sexual dating abuse perpetration and victimization in a national sample of youth. [References]. Archives of Sexual Behavior, 45(5), 1083–1099. https://doi.org/10.1007/s10508-016-0748-9
Yon, Y., Ramiro-Gonzalez, M., Mikton, C. R., Huber, M., & Sethi, D. (2019). The prevalence of elder abuse in institutional settings: A systematic review and meta-analysis. European Journal of Public Health, 29(1), 58–67. https://doi.org/10.1093/eurpub/cky093
Zou, G. (2004). A modified poisson regression approach to prospective studies with binary data. American Journal of Epidemiology, 159(7), 702–706. https://doi.org/10.1093/aje/kwh090
Endnotes
-
For the purposes of this report, a life course approach examines a person’s life history and investigates, for example, how early life events influence later life events and decisions (Elder et al., 2003).
-
For details, please see alswh.org.au/for-researchers/indigenous-policy
-
For more information on measures, please see https://alswh.org.au/for-data-users/data-documentation
-
Women did not need to have completed all surveys to be included in these analyses. An experience of sexual violence was considered enduring, so those women who indicated that they had experienced sexual violence in adulthood in one survey were included as having experienced sexual violence in following surveys.
-
Note that the ALSWH is under-representative of women from CALD backgrounds.
-
For details please see alswh.org.au/for-researchers/indigenous-policy
Research Report
ISSUE 14 | AUGUST 2022
ANROWS acknowledgement
This material was produced with funding from the Australian Government Department of Social Services. Australia’s National Research Organisation for Women’s Safety (ANROWS) gratefully acknowledges the financial and other support it has received from the government, without which this work would not have been possible. The findings and views reported in this paper are those of the authors and cannot be attributed to the Australian Government Department of Social Services.
Acknowledgement of Country
ANROWS acknowledges the Traditional Owners of the land across Australia on which we live and work. We pay our respects to Aboriginal and Torres Strait Islander Elders past, present and emerging. We value Aboriginal and Torres Strait Islander histories, cultures and knowledge. We are committed to standing and working with First Nations peoples, honouring the truths set out in the Warawarni-gu Guma Statement.
Peer review process
The quality of ANROWS publications is ensured through a rigorous peer review process that is consistent with the principles of the Committee on Publication Ethics (COPE) Ethical Guidelines for Peer Review. This report has been assessed by at least two peer reviewers with relevant academic expertise.
© ANROWS 2022
![]()
With the exception of the ANROWS branding, content provided by third parties, and any material protected by a trademark, all material presented in this publication is licensed under a Creative Commons Attribution-NonCommercial 3.0 Australia (CC BY-NC 3.0 AU) licence.
The full licence terms are available at creativecommons.org/licenses/by-nc/3.0/au/legalcode
Published by
Australia’s National Research Organisation for Women’s Safety Limited (ANROWS)
PO Box Q389, Queen Victoria Building, NSW 1230 | www.anrows.org.au | Phone +61 2 8374 4000
ABN 67 162 349 171
ISBN: 978-1-922645-45-6 (paperback)
ISBN: 978-1-922645-46-3 (PDF)
Please note that there is the potential for minor revisions of this report.
Please check the online version at www.anrows.org.au for any amendment.
Natalie Townsend
Research Program Manager, Centre for Women’s Health Research and Australian Longitudinal Study on Women’s Health, University of Newcastle
Professor Deborah Loxton
Director, Centre for Women’s Health Research and Australian Longitudinal Study on Women’s Health,
University of Newcastle
Nicholas Egan
Statistician, Centre for Women’s Health Research and Australian Longitudinal Study on Women’s Health,
University of Newcastle
Isabelle Barnes
Senior Research Officer, Centre for Women’s Health Research and Australian Longitudinal Study on Women’s Health,
University of Newcastle
Emma Byrnes
Research Officer, Centre for Women’s Health Research and Australian Longitudinal Study on Women’s Health,
University of Newcastle
Peta Forder
Senior Statistician, Centre for Women’s Health Research and Australian Longitudinal Study on Women’s Health,
University of Newcastle
This report addresses work covered in the ANROWS research project 4AP.4 “A life course approach to determining the prevalence and impact of sexual violence in Australia: The Australian Longitudinal Study on Women’s Health”. Please consult the ANROWS website for more information on this project.
ANROWS research contributes to the six National Outcomes of the National Plan to Reduce Violence against Women and their Children 2010–2022. This research addresses National Plan Outcome 1 – Communities are safe and free from violence and Outcome 4 – Services meet the needs of women and their children experiencing violence.
Suggested citation:
Townsend, N., Loxton, D., Egan, N., Barnes, I., Byrnes, E., & Forder, P. (2022). A life course approach to determining the prevalence and impact of sexual violence in Australia: Findings from the Australian Longitudinal Study on Women’s Health (Research report, 14/2022). ANROWS.
University of Newcastle
University Drive
Callaghan NSW 2308
Author acknowledgement
The research on which this report is based was conducted as part of the Australian Longitudinal Study on Women’s Health by researchers from the University of Queensland and the University of Newcastle. We are grateful to the Australian Government Department of Health for funding and to the women who provided the data. The authors also acknowledge the Australian Government Department of Health for providing Medicare Benefits Schedule and Pharmaceutical Benefits Scheme data, and the Australian Institute of Health and Welfare (AIHW) as the integrating authority.
Note: the authors acknowledge that “family and domestic violence” is the preferred terminology of ANROWS. However, in this report, the term “domestic violence” has been used where violence pertained to violence between intimate partners. This reflects the measures used in collecting the data, which were focused on violence between intimate partners.
Acknowledgement of lived experiences of violence
ANROWS acknowledges the lives and experiences of the women and children affected by domestic, family and sexual violence who are represented in this report. We recognise the individual stories of courage, hope and resilience that form the basis of ANROWS research.
Caution: Some people may find parts of this content confronting or distressing. Recommended support services include 1800RESPECT (1800 737 732), Lifeline (13 11 14) and, for Aboriginal and Torres Strait Islander people, 13YARN (13 92 76
Executive summary
Background
The Australian Government Department of Social Services (2019, p. 60) defines sexual violence as
sexual actions without consent, which may include coercion, physical force, rape, sexual assault with implements, being forced to watch or engage in pornography, enforced prostitution or being made to have sex with other people.
While there is a growing body of international evidence on sexual violence, its prevalence and impact has not been extensively examined in the Australian context. The existing evidence base is largely limited to data sources that are likely to underestimate the prevalence of sexual violence or to apply only to discrete groups of women (e.g. clinical samples). Further, while international and national estimates of sexual violence prevalence are available, these rarely capture experiences and outcomes across the life span.
The Australian Longitudinal Study on Women’s Health (ALSWH) has collected sexual violence data since its inception in 1996 and offers an ideal opportunity to examine sexual violence over the life span. The ALSWH has captured a broad range of data on women’s health, which are crucial for understanding the economic, social, physical and mental health trajectories of women who have experienced sexual violence. This report was developed in consultation with ANROWS to address the limitations of the existing evidence by utilising ALSWH data.
Aims
The purpose of this report was to assess the prevalence of sexual violence over the life course and the impacts of experiencing sexual violence on health and wellbeing among Australian women using national, longitudinal data. The research had the following specific aims:
- Determine the prevalence of sexual violence across the life course, including sexual violence experienced in childhood and adulthood, perpetrated both within an intimate relationship and outside of such a relationship.
- Determine the role of sexual violence during childhood as a risk factor for experiences of multiple forms of violence later in life.
- Identify the impact of sexual violence on socio-economic factors over time, such as education, paid employment and financial stress.
- Determine the nature of associations between sexual violence experienced by women at different life stages and subsequent health behaviours.
- Assess the impact of sexual violence on women’s physical and mental health.
- Measure health service use in relation to sexual violence, including costs of selected health services and satisfaction with general practitioner services.
- Identify factors associated with the general health and wellbeing of women who have experienced sexual violence.
Method
The ALSWH is an ongoing, national cohort study that investigates factors influencing the health and wellbeing of Australian women. The study began in 1996 and now includes data from more than 57,000 women across four age cohorts (born in 1921 to 1926, 1946 to 1951, 1973 to 1978, and 1989 to 1995). ALSWH surveys collect data on women’s physical and mental health as well as demographics, health behaviours and attributes, lifestyle factors, use of health services and experiences of violence. ALSWH data are linked with national and state-based administrative health datasets such as the Medicare Benefits Schedule (MBS) and the Pharmaceutical Benefits Scheme (PBS), as well as hospital admission, perinatal and cancer registry datasets.
Key ALSWH variables analysed for this report in relation to sexual violence included measures of domestic and physical violence, socio-demographic factors, financial outcomes, health behaviours, mental health, physical health and social support. Data on healthcare costs and mental health consultations were sourced from MBS and PBS datasets linked to ALSWH participant data, to investigate the associations between health service use and sexual violence.
Results
Overall findings indicated that women experience sexual violence at a much higher prevalence than has been previously reported at the national level, especially among younger women. Sexual violence in childhood was found to be a risk factor for experiencing later violence. Experiencing sexual violence at any stage increased the risk of financial stress, adverse health behaviours (among women in their twenties and forties), and poor physical and mental health. Social support, mental health service use and physical activity were indicated as potentially beneficial to wellbeing among women who had experienced sexual violence. A summary of the main results is presented below and highlights are included in the accompanying infographic package.
Aim 1: Prevalence of sexual violence
The lifetime prevalence of experiencing sexual violence was:
- 51 per cent of women in their twenties
- 34 per cent of women in their forties
- 26 per cent of women aged 68 to 73.
The prevalence of sexual violence during childhood was 12 to 15 per cent of women, depending on the age cohort.
The lifetime prevalence of sexual violence in adulthood was 39 per cent of women in their twenties, 18 per cent of women in their forties and 12 per cent of women aged 68 to 73.
The differences in prevalence by age may reflect generational differences in understanding, personal feelings about disclosing sexual violence and the time since the violence occurred (Loxton, Townsend et al., 2017)
Women identifying as bisexual or as mainly or exclusively lesbian were more likely to report having experienced sexual violence in their lifetime than those who identified as mainly or exclusively heterosexual. For example, 76 per cent of women aged 24 to 30 identifying as bisexual, 55 per cent of those identifying as mainly or exclusively lesbian, and 48 per cent of women identifying as mainly or exclusively heterosexual reported having experienced sexual violence in their lifetime. This is in line with previous international research in this area (Black, 2011). However, the low number of women in the ALSWH cohorts who identify as bisexual limits the generalisability of our findings.
Women with disability or illness were more likely to report having experienced sexual violence in their lifetime than those without disability or illness (73% versus 51% for women aged 24 to 30; 55% versus 34% for women aged 40 to 45; 34% versus 26% for women aged 68 to 73). We have previously reported similar results in relation to domestic violence (Loxton, Townsend et al., 2018). The findings were also in line with those of the 2016 Personal Safety Survey, which estimated a higher prevalence of sexual violence after the age of 15 among women living with disability compared to those without disability (16% versus 9.6%; Australian Bureau of Statistics, 2017).
Aim 2: Sexual violence during childhood as a risk factor for further violence
Compared with women of the same age who did not report experiencing sexual violence in childhood:
- Women aged 24 to 30 in 2019 who had experienced childhood sexual violence were twice as likely to have experienced recent sexual violence, 59 per cent more likely to have experienced recent domestic violence and approximately 60 per cent more likely to have experienced recent physical violence.
- Women aged 40 to 45 in 2018 who had experienced childhood sexual violence were twice as likely to have experienced recent sexual violence, 33 per cent more likely to have experienced recent domestic violence and 63 per cent more likely to have experienced recent physical violence.
Aim 3: Lifetime sexual violence and economic factors
Compared with women of the same age who did not experience sexual violence in their lifetime:
- Women aged 24 to 30 in 2019 who had experienced sexual violence were less likely to have completed Year 12 and less likely to be in full-time employment.
- Women aged 40 to 45 in 2018 who had experienced sexual violence were less likely to have completed Year 12.
- Women aged 68 to 73 in 2019 to 2020 who had experienced sexual violence were more likely to have completed further study after Year 12 and more likely to have been in full-time employment.
Despite differences between cohorts regarding education and employment, sexual violence was consistently associated with high financial stress over time for all three cohorts (women were 30% to 45% more likely to experience high financial stress if they had experienced sexual violence).
Aim 4: Sexual violence and health behaviours
Experiencing sexual violence was associated with illicit drug use, high-risk alcohol consumption, current tobacco use, less physical activity and obesity among women in their twenties and forties.
Women aged 68 to 73 in 2019 to 2020 were slightly less likely to have had a mammogram or cervical cancer screening in the previous two years if they had experienced sexual violence in their lifetime. Conversely, women aged 24 to 30 in 2019 were slightly more likely to have had a cervical cancer screening in the previous two years if they had experienced sexual violence.
Aim 5: Sexual violence and health
Regardless of age or generation, women who had experienced sexual violence reported worse physical and mental health than women who had never experienced sexual violence. This included poorer general health and increased risk of chronic conditions, sexually transmitted infections, anxiety, depression and psychological distress.
Aim 6: Sexual violence and health services
Across all cohorts, women who had experienced sexual violence had higher average annual costs for non-referred health services (such as a consultation with a general practitioner or registered doctor) than women who had not experienced sexual violence. Over time, this difference in annual costs increased.
There was higher uptake of at least one mental health consultation for women who had experienced sexual violence compared to those who had not experienced sexual violence. However, for women who had at least one mental health consultation, the total number of consultations and government-subsidised costs for mental health services were similar between women who had and had not experienced sexual violence.
Aim 7: Wellbeing among women who have experienced sexual violence
Two forms of social support (emotional support and guidance, and affection and social interaction) and physical activity were related to good health among women who had experienced sexual violence. Three forms of social support (emotional support and guidance, affection and social interaction, and tangible or physical assistance), physical activity and mental health service use were related to better mental health among women who had experienced sexual violence.
Conclusion
Primary prevention is key to alleviating the traumatic and long-term impact of experiencing sexual violence but there are many women in our community who have already experienced sexual violence. The outcomes are grave and long lasting, impacting economic security and physical and mental health. There are reasons for hope, as the findings here have shown the value of interpersonal support and mental health services. Still, there is much work to be done in policy, practice and research.
The data provide a national picture of life for women who have experienced sexual violence. Findings emphasise the importance of accurate measurement and the seriousness and longevity of adverse impacts. The results also indicate the need for a comprehensive understanding and investment in primary healthcare and intersectoral support for women who have experienced sexual violence so that they can enjoy optimal wellbeing and avoid secondary traumatisation.
Implications and recommendations for policy and practice
- A holistic response that takes account of women’s whole lives at both policy and practice levels is needed, given the high prevalence of sexual violence and its multiple impacts. We recommend that sexual violence be considered a health risk within policy development at all levels of government.
- A clear focus on priority populations (e.g. LGBTQA+ and intersex people, women with disability, women from culturally and linguistically diverse backgrounds) is required in all policies addressing sexual violence.
- There is a need for a broad, consistent definition of sexual violence. Our broad measures resulted in a much greater data capture of sexual violence and are in keeping with current national conversations concerning consent. Further consultation with stakeholder communities is needed.
- Research should take a life course, longitudinal approach to estimating the prevalence of sexual violence. With consistent definitions, longitudinal data permit changes in prevalence to be captured and assessed in relation to policy initiatives.
- Service providers should employ a life course approach when delivering services to women who have experienced sexual violence. Women who had experienced childhood sexual violence were more likely to experience violent acts in adulthood.
- Prevention programs and policies should be designed with consideration of potential behavioural drivers. The increased likelihood of adverse health behaviours among women who have experienced sexual violence indicates the need for a more nuanced lens in overall prevention program and policy development. For example, obesity prevention tends to focus on nutrition and physical activity, with potentially insufficient attention given to the drivers of adverse health behaviours.
- Health and support services for women who have experienced sexual violence should be subsidised or free. The strong association between sexual violence and poor health outcomes across all generations indicates a need for more health service support, but the impact of financial stress might deter service access.
- Health services can play a key role. Primary healthcare providers are well placed to be the gateway to an intersectoral approach. Evidence-based training and investment in primary healthcare and referral services are needed to facilitate an intersectoral response to the health impact of sexual violence.
Directions for future research
To continue to develop the evidence base in Australia, the following directions are recommended for future research:
- Distinct differences in prevalence were noted between generations. There is a need to understand more fully what is driving these differences for more accurate prevalence data across the life course.
- Research conducted in partnership with communities is needed to describe and understand the factors that influence disclosure of sexual violence and the health and wellbeing of women who have experienced sexual violence who belong to priority populations.
- There is no comprehensive understanding of why women who have experienced sexual violence at one stage of life are more likely to experience sexual and other forms of violence at later life stages. Research is needed in this area to provide the evidence base for policy and practice development, with a view to prevention of multiple experiences of violence.
- A mixed-methods study that uses qualitative data to investigate the nuances of the economic impact of sexual violence followed by quantitative scenario modelling could reveal potential interventions designed to alleviate the economic burdens associated with sexual violence.
- A better understanding of the drivers of risky health behaviour for women who have experienced sexual violence is needed to inform prevention practice and policy development.
- Long-term physical and mental health impacts and behavioural risk factors underscore the need for nuanced primary healthcare services and intersectoral referral networks that can address the needs of women who have experienced sexual violence. More research is needed into effective primary care service provision for those who have experienced sexual violence.
- While beyond the scope of the current report, there remains a need for research on prevention of sexual violence.
Introduction
Sexual violence is a pervasive issue that affects women and is primarily perpetrated by men (World Health Organization, 2017; World Health Organization & London School of Hygiene and Tropical Medicine, 2010). The World Health Organization (WHO) defines sexual violence as
any sexual act, attempt to obtain a sexual act or other act directed against a person’s sexuality using coercion, by any person regardless of their relationship to the victim, in any setting. (World Health Organization & London School of Hygiene and Tropical Medicine, 2010, p. 11)
Within an Australian context, the Australian Government Department of Social Services adopts a similar definition, as stated in the Fourth Action Plan of the National Plan to Reduce Violence against Women and their Children 2010–2022 (Department of Social Services, 2019, p. 60):
Sexual violence refers to sexual actions without consent, which may include coercion, physical force, rape, sexual assault with implements, being forced to watch or engage in pornography, enforced prostitution or being made to have sex with other people.
Similarly, the Australian Institute of Health and Welfare refers to sexual violence as “behaviours of a sexual nature carried out against a person’s will”, specifying that it may be perpetrated by current or previous partners, other known people or strangers (Australian Institute of Health and Welfare, 2019a, p. 2). It should be noted that states and territories in Australia adopt different definitions of sexual violence, often resulting in various jurisdictional datasets (Australian Institute of Health and Welfare, 2018; Parliament of Australia, 2006). The need for consistent definitions to improve the measurement and understanding of sexual violence has been highlighted (Australian Institute of Health and Welfare, 2018).
It is widely documented that women who have experienced sexual violence suffer adverse health, economic and social outcomes (Bacchus et al., 2018; Carr et al., 2020; Dillon et al., 2015; Nikischer, 2014; Sanz-Barbero et al., 2019). It has also been suggested that experiencing sexual violence may increase women’s likelihood of experiencing further violence throughout their lives (Aakvaag et al., 2019; Conley et al., 2017; Cox, 2015; Gartland et al., 2016; Öberg et al., 2019; Öberg et al., 2021; Relyea & Ullman, 2017). Further, there is evidence to indicate differential risks of victimisation among diverse groups of women, including ethnic minorities, LGBTQA+ and intersex communities, and women with disability (Australian Institute of Health and Welfare, 2019b; Bonomi et al., 2018; Campo & Tayton, 2015; Heywood et al., 2022). To address these issues and effectively support women in their recovery from sexual violence, it isnecessary to understand how they are affected by sexual violence across the life course.[1] The following section provides a review of previous research on the prevalence and impact of sexual violence, as well as findings on potential factors that may assist women in recovering from sexual violence.
Literature review
The prevalence of sexual violence
To address the impact of sexual violence, it is important to understand the prevalence of the issue. This requires accurate and reliable data on multiple forms of sexual violence across women’s lives (World Health Organization, 2017). In recent years, the prevalence of sexual violence has been widely reported across the global, international and national literature.
A broad range of data sources have captured women’s experiences of sexual violence at various stages of life including childhood, adolescence, young adulthood, adulthood and older age. There is significant variation in the figures reported which can be attributed to the endorsement of different definitions of sexual violence, heterogeneity in data collection methods and the different settings in which the research is conducted (Cox, 2015; Davidson et al., 2016; Taylor & Shrive, 2021). It is important to consider the individual contexts from which these findings have been drawn.
Global estimates of the prevalence of sexual violence
Global estimates from the WHO indicate that 35 per cent of women have experienced physical and/or sexual intimate partner violence or non-partner sexual violence. Worldwide, nearly one third of women who have been in a relationship have experienced physical and/or sexual violence by their intimate partner. Moreover, 7 per cent of women have experienced sexual assault by someone other than their partner (World Health Organization et al., 2013). Sexual violence also affects a large proportion of children. In 2014, approximately 18 per cent of females worldwide had experienced sexual violence before the age of 18, according to a meta-analysis of population-based prevalence studies (World Health Organization, 2014).
International estimates of the prevalence of sexual violence
Estimates of the prevalence of sexual violence have been reported across a range of international studies. Recently, the United Kingdom Women’s Experiences of Violence and Abuse Study (Taylor & Shrive, 2021) examined experiences of sexual violence and abuse in a sample of over 22,000 women. Prevalence was higher than reported elsewhere, with 99 per cent of women aged 18 and over subjected to at least one sexual offence in their lifetime (Taylor & Shrive, 2021). Additionally, more than half of women (51%) reported having woken up to their male partner performing sexual acts on them while they were asleep; 80 per cent were sexually touched without consent by someone; 36 per cent were sent an unsolicited nude picture of a male; and nearly one third (30%) of women reported being forced to engage in sex acts by someone before the age of 13 years old (Taylor & Shrive, 2021). The survey also captured multiple experiences ofsexual violence, with results suggesting that women will be subjected to at least 26 acts of sexual violence in their lifetime, with 13 of these occurring before the age of 18 (Taylor & Shrive, 2021). In this study, “sexual offence” included multiple forms of sexual harassment, sexual assault and rape. In addition, terms such as “abuse”, “rape”, “sexual violence” and “sexual abuse” were omitted from survey items as this improved accuracy of responses (Taylor & Shrive, 2021). These results suggested a potential underestimation of the prevalence of sexual violence against women among other studies that use more conservative measures (Taylor & Shrive, 2021).
In comparison, findings from the United States National Intimate Partner and Sexual Violence Survey included that 19 per cent of women aged 18 years and over had been raped and more than two fifths (44%) had experienced other forms of sexual violence during their lifetime (Breiding, 2015). Findings from the Canadian National Victimization Survey revealed that approximately 2 per cent of women reported experiencing physical and/or sexual intimate partner violence in their current relationships in the past five years (Lysova et al., 2019).
Other studies have utilised linkage to administrative health databases to estimate the frequency of sexual assaults. For example, Muldoon et al. (2019) conducted a 15-year retrospective analysis of substantiated sexual assault cases in Canada. The highest rate was seen among the 15 to 19 years age group, with approximately 187 per 100,000 females having experienced sexual assault, followed by 127 per 100,000 females aged 20 to 24 (Muldoon et al., 2019).
While much of the literature on sexual violence in adulthood draws from samples over the age of 18, few studies have examined experiences of sexual violence among older women. A recent systematic review and meta-analysis of predominately high-income countries estimated that 2 per cent of adults in institutional settings had experienced sexual violence, however, there is a paucity of evidence applicable to the general population (Yon et al., 2019).
Much of the United States-based research on the prevalence of sexual violence among women has also utilised college sampling due to higher rates of assault often reported by college-aged women compared to other age groups (Bradel et al., 2019; Brener et al., 1999; Conley et al., 2017). For example, Conley et al. (2017) reported that 23 per cent of women experienced sexual assault while in college, defined as rape, attempted rape, being made to perform any type of sexual act through force or threat of harm, or any other unwanted or uncomfortable sexual experience.
International studies have also examined the prevalence of sexual violence in childhood years (Craner et al., 2015; Finkelhor et al., 2014; Herbert et al., 2021; Merrick et al., 2018; Wincentak et al., 2016). Using data from the United Kingdom Avon Longitudinal Study of Parents and Children, Herbert et al. (2021) estimated the lifetime prevalence of intimate partner sexual violence victimisation among women aged 17 to be 9 per cent (Herbert et al., 2021). Similarly, findings from an online survey of youth in the United States indicated that 11 per cent of females aged 14 to 15, 12 per cent of females aged 16 to 17, and 15 per cent of females aged 18 to 21 had experienced sexual adolescent dating violence, including unwanted kissing, unwanted touching, other unwanted sexual activity, attempted forced sex and forced sex by a partner (Ybarra et al., 2016).
National estimates of the prevalence of sexual violence
Estimates of sexual violence prevalence have also been reported at the national level in Australia. According to the Australian Bureau of Statistics’ 2016 Personal Safety Survey (PSS; Australian Bureau of Statistics, 2017), approximately one in five Australian women have experienced sexual violence. In 2016, it was estimated that 18 per cent of Australian women over the age of 18 had experienced sexual violence since the age of 15. The PSS also indicated that just under 2 per cent of Australian women had experienced sexual violence in the last 12 months. Eleven percent of women had been sexually abused before the age of 15, with more than half of these experiencing sexual violence for the first time before the age of 10. Further, of those who had experienced sexual violence before the age of 15, nearly half (47%) reported that the perpetrator was a non-familial known person (Australian Bureau of Statistics, 2017).
Australian cross-sectional studies have also captured prevalence data on sexual violence, although there is variation reported across the literature (Gartland et al., 2016; González-Chica et al., 2019; Kisely et al., 2020; Mills et al., 2016; Tarzia et al., 2017; Tarzia et al., 2018). A recent South Australian population-based study reported that 17 per cent of females had been sexually abused during their lifetimes (González-Chica et al., 2019). According to a different study conducted in general practice clinics, 41 per cent of women had experienced sexual violence since 15 years of age and 11 per cent had experienced sexual violence in the past 12 months (Tarzia et al., 2018). This study also documented large proportions of those who had experienced rape or sexual assault (16%), coercion into sexual acts or in reproductive control (18%), and unwanted sexual contact (e.g. groping, harassment, flashing or touching; 18%; Tarzia etal., 2018).
As reflected in the international literature, the body of research on the prevalence of sexual violence among young women often utilises university or college sampling, due to the disproportionate numbers of sexual assaults in these settings. Within an Australian setting, the 2021 National Safety Survey revealed that 21.3 per cent of female Australian students had been sexually harassed and 6 per cent had been sexually assaulted in an Australian university context (Heywood et al., 2022).
A number of Australian studies have also examined the prevalence of sexual violence within childhood (Gartland et al., 2016; Kisely et al., 2020; Mills et al., 2016; Tarzia et al., 2017; Tarzia et al., 2018). Data from a clinical sample revealed that 27 per cent of women had experienced a form of childhood sexual violence (Tarzia et al., 2017). Similarly, findings from a Melbourne pregnancy cohort indicated that nearly one in four (23%) women had a self-reported history of childhood sexual violence (Gartland et al., 2016). Additionally, much of the Australian literature on childhood sexual violence has reported on data captured from the Mater–University of Queensland Study of Pregnancy (Mills et al., 2016). According to a 2016 analysis, 31 per cent of females followed up at age 21 had a self-reported history of childhood sexual violence (Mills et al., 2016). More recently, state child protection agency data were used todetermine history of exposure to suspected childhood maltreatment at the 30-year follow-up phase. Although this analysis did not permit reporting of childhood sexual violence among females, 2 per cent of young adults had notifications of childhood sexual violence (Kisely et al., 2020).
Further, Australian studies have demonstrated that women from diverse groups and communities often experience sexual violence at higher rates (Dillon et al., 2015; Heywood et al., 2022; Ussher et al., 2020). For example, the 2021 National Safety Survey found higher rates of sexual assault and sexual harassment in an Australian university context among gay/lesbian, bisexual, nonbinary and transgender students compared to heterosexual students. Similarly, students with disability were more than twice as likely to experience sexual assault in an Australian university context, compared to those without disability (Heywood et al., 2022). Finally, previous research using ALSWH data found that women from inner regional and other rural areas were more likely to report lifetime intimate partner violence than those from major cities (Dillon et al., 2015).
The cumulative risk of violence
Associations between experiencing violence earlier in life and then again later in life have been documented, although these are not well understood (Aakvaag et al., 2019; Gartland et al., 2016; Relyea & Ullman, 2017). It has been suggested that women with a history of experiencing sexual violence are more likely to experience further violence throughout their lives (Aakvaag et al., 2019; Conley et al., 2017; Öberg et al., 2019; Öberg et al., 2021; Relyea & Ullman, 2017). This is important to understand in order to identify those at an increased risk of violence and address the potential cumulative impact of violence (Cox, 2015; Öberg et al., 2019). While there is a paucity of longitudinal studies examining trends over time, the available evidence reveals potential avenues to explore in future analyses.
Sexual violence and domestic violence co-occurrence and revictimisation has previously been examined in the ANROWS Landscapes Series (Cox, 2015). A review of the international literature from middle- and high-income countries suggested that women who have experienced childhood sexual violence are more likely to experience intimate partner sexual violence in adulthood than those without a history of childhood sexual violence. Further, the severity of the violence during childhood was shown to mediate the relationship to a certain degree. A similar association was found between childhood sexual violence and domestic violence in adulthood. It was noted that the lack of longitudinal studies of revictimisation limited the authors’ ability to draw conclusions on causal factors. Additionally, the lack of samples representative of the general population affected the external validity of the results (Cox, 2015).
Similarly, other international studies have demonstrated a strong link between experiencing violence in childhood and later in adulthood (Aakvaag et al., 2019; Bradel et al., 2019; Conley et al., 2017; Öberg et al., 2021; Relyea & Ullman, 2017). However, many of these do not differentiate between the types of violence experienced at both timepoints, and thus there is uncertainty surrounding the cumulative risk of sexual violence specifically (Aakvaag et al., 2019; Bradel et al., 2019; Relyea & Ullman, 2017).
Another review, conducted by Bidarra et al. (2016), demonstrated a link between exposure to parental intimate partner violence in childhood and experiencing childhood sexual violence. It was found that children exposed to intimate partner violence within their parents’ or caregivers’ relationships were at greater risk of being sexually abused during childhood, with the prevalence of the co-occurrence ranging from 12 to 70 per cent (Bidarra et al., 2016).
Within an Australian context, there is a paucity of evidence concerning women’s experiences of violence subsequent to an experience of sexual violence. Gartland et al. (2016) investigated patterns of violence and trauma among a prospective pregnancy cohort. Among women who had never given birth, 41 per cent reported a history of childhood violence. When followed up four years from baseline, 28 per cent of women reported having experienced intimate partner violence. Women with a history of childhood sexual or physical violence had a two- to three-fold risk of intimate partner violence during the study period compared to those without such a history (Gartland et al., 2016).
The relationship between experiencing sexual violence and socioeconomic factors
It is well known that lower socioeconomic status can impact on physical health and mental health, as can sexual violence (Bacchus et al., 2018; Carr et al., 2020; Hailes et al., 2019; Tarzia et al., 2017). Yet, the interplay between these factors is not well understood. Sexual violence has been shown to have an impact on various socioeconomic factors, including education, paid employment and financial stress (Baigorria et al., 2017). It is important to understand the relationship between women’s experiences of sexual violence at different stages of life and their socioeconomic status to ascertain the degree and length of this impact (Dillon et al., 2015; Sanz-Barbero et al., 2019). This will allow for tailored strategies to assist women in recovering from sexual violence (Kennedy et al., 2021; Nikischer, 2014).
International research has highlighted an inverse relationship between women experiencing sexual violence and educational attainment (Baigorria et al., 2017; Kennedy et al., 2021; Sanz-Barbero et al., 2019). Recently, a review found that low educational level was associated with experience of sexual violence among adolescent and adult women (Baigorria et al., 2017). Similarly, low educational status, as determined by the highest educational grade of participants’ primary caregivers, has been shown to predict sexual intimate partner violence (Kennedy et al., 2021).
There is also evidence to suggest that a history of sexual violence predicts poor academic performance in tertiary education settings (Baker et al., 2016). Baker et al. (2016) showed that a history of childhood sexual violence and adolescent/adult sexual assault predicted a poorer grade point average both at the end of the semester and at the four-year follow-up among college students. Experiencing sexual violence was also associated with a higher likelihood of dropping out of college, underscoring the need to address adverse educational outcomes of those who have experienced sexual violence and assess for sexual violence in college settings to identify women at risk of poor performance or leaving their studies.
A United States qualitative study provided insight into the interplay between experiencing sexual violence and educational outcomes (Nikischer, 2014). Participants reported drops in grades during high school and university degree programs, and this was attributed to a lack of confidence following sexual assault, fear of violence occurring at the educational setting, and difficulties with mental health and health behavioural factors that also followed experiencing violence. Further, women described a “ripple effect” on employment and career goals, indicating that socioeconomic challenges persisted in the long term (Nikischer, 2014).
Associations have also been drawn between women experiencing sexual violence and disruptions to employment and income hardship (Dillon et al., 2015; Showalter, 2016). A 2016 systematic review of the literature explored the co-occurrence of domestic violence, including sexual violence, and employment instability (Showalter, 2016). Many of the included studies documented higher rates of unemployment for women who had experienced domestic violence, compared to those who had not. Additional findings showed a correlation between experiencing domestic violence and job performance, inability to concentrate at work, fewer hours in paid work and job loss by termination or resignation. Direct workplace disruptions from women’s abusers were also observed and shown to negatively impact women’s employment stability. These included on-the-job harassment in person or via telephone, being prevented from going to work by the abuser and being late to work as aresult of violence. Finally, some of these relationships were mediated by mental health factors, highlighting a potential interaction between sexual violence, socioeconomic status and mental health (Showalter, 2016).
A number of studies have also observed differences in income and financial hardship between those with a history of sexual violence and their counterparts (Dillon et al., 2015; Loya, 2015; Showalter, 2016). However, there is a paucity of evidence demonstrating this relationship over time. Therefore, it is difficult to ascertain the extent of this association and fully understand women’s experiences of financial disadvantage in relation to sexual violence.
The relationship between experiencing sexual violence and health behaviours
Exposure to sexual violence has been widely associated with adverse health behaviours, including drug use, excessive alcohol use and tobacco use (Bacchus et al., 2018; Baigorria et al., 2017; González-Chica et al., 2019; Miller-Graff et al., 2021; Nemeth et al., 2016). It is important to understand the relationships between these variables to identify those who may benefit from referral to support services (Bone et al., 2018). Further, it is necessary to gain insight into these factors to understand and respond to the needs of women exposed to sexual violence (Bacchus et al., 2018; Bone et al., 2018).
Drug use has been consistently linked to experiencing sexual violence within the international literature, although the mechanisms underlying this relationship remain unclear (Austin & Short, 2020; Bacchus et al., 2018; Silva et al., 2020). A systematic review examined the associations between intimate partner violence, including sexual violence in the previous 12 months, and health risk behaviours (Bacchus et al., 2018). Intimate partner violence was shown to be associated with the use of cocaine, crack, heroin and marijuana among women aged 15 and over. This review highlighted the uncertainty surrounding the relationships over time, underscoring the need for longitudinal studies in this area (Bacchus et al., 2018).
Recently, data from the National Longitudinal Study of Adolescent to Adult Health in the Netherlands were used to examine the association between prescription opioid use and misuse and sexual violence over a decade (Austin & Short, 2020). Participants with a history of sexual violence were nearly 70 per cent more likely to use prescription opioids than those with no such history. An increased risk was also observed for past-30-day prescription opioid misuse, with a 20 per cent higher likelihood for women who had experienced sexual violence (Austin & Short, 2020).
There is variation within the literature regarding the link between alcohol consumption and experiencing violence (Bacchus et al., 2018; González-Chica et al., 2019). The associations have not been widely examined over time due to the paucity of longitudinal data (Bacchus et al., 2018; Massetti et al., 2018). A study using data from the 2006 United States Behavioral Risk Factor Surveillance System (BRFSS) examined the risk of binge drinking among those with a history of experiencing intimate partner violence, including sexual violence (Massetti et al., 2018). Those reporting intimate partner violence victimisation were more likely to have engaged in binge drinking in the past month compared to those without a history of intimate partner violence (Massetti et al., 2018). In contrast, a recent Australian study reported no significant association between experiencing sexual violence among adolescents and excessive alcoholintake (González-Chica et al., 2019).
There is also evidence to suggest a relationship between cigarette use and sexual violence (González-Chica et al., 2019; Melka et al., 2019; Nemeth et al., 2016). For example, an Australian study found that participants who had experienced sexual violence were more likely to indicate smoking dependence (defined as smoking three or more cigarettes every day) than those without a history of sexual violence (González-Chica et al., 2019).
International research has also highlighted a link between body mass index (BMI) and sexual violence in childhood and adolescence (Clark et al., 2014; Stensland et al., 2015). Clark et al. (2014) examined data from the United States National Longitudinal Study of Adolescent Health, finding that the occurrence of violence within a relationship predicted an increase in BMI. Further, stratified results showed a magnification of the increase in BMI for those with a history of childhood sexual violence. Stensland et al. (2015) found a robust and significant relationship between interpersonal violence, including sexual violence, and increased BMI within a cohort of Norwegian youth. This remained after adjustment for socioeconomic and health behavioural factors and was more evident among female participants compared to males (Stensland et al., 2015).
The relationship between experiencing sexual violence and health
Experiencing violence has been linked to a plethora of negative health outcomes (Bacchus et al., 2018; Felitti et al., 1998). Globally, intimate partner violence has been shown to result in a higher burden of disease and has been linked to a lower life expectancy (Mokdad et al., 2016). Regarding sexual violence, there are consistent reports of an association with mental health, including depression, anxiety, psychological distress and post-traumatic stress disorder (PTSD; Bacchus et al., 2018; Coles et al., 2014; Hailes et al., 2019). The relationship between sexual violence and physical health has not been thoroughly examined, although links to cancer diagnoses, bodily pain and general health have been documented (Coles et al., 2014; Reingle Gonzalez et al., 2018). Studies have also reported links between experiencing sexual violence and socioeconomic status, health behaviours and health. However, the mechanisms through which thesefactors interact are not well understood. It is necessary to determine the health outcomes of women who have experienced sexual violence as a means to improve the identification of who may present to services and address the impact of violence on their health and wellbeing (Oram et al., 2017).
Physical health
A recent systematic review examined the long-term health and psychosocial outcomes of child maltreatment within long-term care settings, including experiencing childhood sexual violence (Carr et al., 2020). Participants of the included studies had retrospectively reported violence in residential care centres and in foster care settings. There were significant associations between child violence and physical health outcomes across the life span, including physical illness, being on long-term sick leave from work, chronic medical complaints (particularly headaches, back pain and joint pain), allergies and asthma (Carr et al., 2020).
The relationship between sexual violence and cancer diagnoses has also been examined. Reingle Gonzalez et al. (2018) conducted a meta-analysis and demonstrated a significant, positive relationship between violence against women and cancer diagnoses. Women who had experienced intimate partner violence, including sexual violence, were more likely to be diagnosed with cancer compared to those who had not. Associations were particularly strong for cervical cancer (Reingle Gonzalez et al., 2018).
Previous cross-sectional research using ALSWH data has investigated the relationship between childhood sexual violence and physical health (Coles et al., 2014). Among women in their late twenties and early thirties, those who had experienced childhood sexual violence were more likely to report bodily pain and poor general health than those who had not. Further, those who experienced childhood sexual violence and adult violence were more than twice as likely to experience poor general health compared to those without a history of violence (Coles et al., 2014).
Mental health
It is well documented that poor mental health and psychiatric conditions are common among those with a history of experiencing violence (Bacchus et al., 2018; Bone et al., 2018; Coles et al., 2014; Hailes et al., 2019; Khadr et al., 2018; Tarzia et al., 2017; Tarzia et al., 2018). However, the extent to which this persists over time is unclear. For example, in a study of adolescents accessing sexual assault services in Greater London, 88 per cent of participants were at risk of depression, 71 per cent were at risk of anxiety and 91 per cent were at risk of PTSD. Furthermore, more than half of the sample were at risk of experiencing multiple mental health conditions, highlighting the need for comprehensive support following sexual assault (Khadr et al., 2018).
Additionally, a recent systematic review collated findings on the relationship between recent intimate partner violence, including sexual violence, and depressive symptoms as reported in cohort studies (Bacchus et al., 2018). Women reporting recent intimate partner violence were 76 per cent more likely to experience subsequent depressive symptoms than those reporting no violence. Similarly, those reporting depressive symptoms had a 72 per cent increased risk of subsequent intimate partner violence. Additionally, results from cohorts of pregnant women revealed more than a two-fold risk of subsequent postpartum depression among those who had experienced recent intimate partner violence. The review noted significant differences in measurement between the studies, while also highlighting the need for longitudinal studies that consider the differential effects of recent versus historical exposure to intimate partner violence (Bacchus et al.,2018).
Another systematic review examined the association between childhood sexual violence and mental health (Hailes et al., 2019). Childhood sexual violence was shown to be associated with schizophrenia, borderline personality disorder, anxiety and depression, with odds ratios ranging from 2.2 to 3.3. (Hailes et al., 2019).
At the national level, many Australian studies have also provided evidence for the link between sexual violence and poor mental health (Coles et al., 2014; Gartland et al., 2016; Tarzia et al., 2017; Tarzia et al., 2018). Previous ALSWH research has examined mental health and childhood sexual violence within a cross-sectional study of the 1973 to 1978 cohort, when aged 28 to 33 (Coles et al., 2014). Findings revealed that women who experienced childhood sexual violence were 40 per cent more likely to have been depressed and 40 per cent more likely to have had anxiety in the previous three years than those who had not experienced childhood sexual violence (Coles et al., 2014).
An Australian pregnancy cohort study has also demonstrated greater odds of anxiety among those with a history of child maltreatment (Gartland et al., 2016). Similarly, Tarzia et al. (2017) examined this using a clinical sample, finding that women attending Australian general practice clinics who had experienced sexual violence in adulthood were more likely to experience anxiety than those who had not experienced sexual violence in adulthood. A later analysis from the same study highlighted the effect of perpetrator identity on the relationship between mental health and sexual violence (Tarzia et al., 2018). Sexual violence perpetrated by an intimate partner was associated with higher scores for PTSD and depression compared to those for women who had experienced sexual violence perpetrated by a stranger or a person known to them (Tarzia et al., 2018).
Service use, cost of selected services and satisfaction with general practitioners in relation to experiencing sexual violence
International studies have also investigated experiencing sexual violence in relation to use of different health services (Massetti et al., 2018; Mørk et al., 2014; Sutherland et al., 2016; Watson-Johnson et al., 2012; Yang et al., 2014). Some cross-sectional analyses have demonstrated a lower uptake of health services among those with a history of sexual violence, although there is a paucity of longitudinal data to examine long-term trends and potential reasons for this (Graham et al., 2019). The current evidence base highlights shortfalls in screening for a history of sexual violence in healthcare settings (Sutherland et al., 2016) and suggests a need for improved responses by practitioners to disclosures of sexual violence (Mørk et al., 2014; Taylor et al., 2012). Some studies have also revealed a significant cost to women accessing services following sexual assault, highlighting a potential barrier to accessingsupport (Yang et al., 2014). It is important to determine the differences in service use, cost and satisfaction between those who have experienced sexual violence and those who have not, to improve service provision (Taylor et al., 2012). It should be noted that much of the available evidence is drawn from countries with non-comparable health systems to Australia, such as the United States.
Data from the large-scale United States BRFSS have been used to show that fewer women reporting intimate partner violence had health insurance, a personal doctor or healthcare provider, or regular check-ups within the previous two years compared to those not reporting intimate partner violence. Massetti et al. (2018) suggested that these findings may partially explain the link between violence and chronic disease. It was also noted that these associations were likely affected by sociodemographic differences (Massetti et al., 2018). Watson-Johnson et al. (2012) demonstrated a link to cancer screening using these data, reporting that women with a history of sexual violence were less likely to undergo regular mammography screening for breast cancer than those without such history (74% versus 77%; Watson-Johnson et al., 2012). Lower rates of mammography and colorectal cancer screening were also reported among women who hadexperienced intimate partner violence compared to those who had not (66% versus 77% and 49% versus 55%, respectively; Massetti et al., 2018). These findings support the notion that sexual violence may be associated with reduced healthcare use.
The costs of service use in relation to sexual violence have not been extensively examined. A large, population-based study in Iowa investigated the incidence and cost of sexual violence, including health service expenses (Yang et al., 2014). Yang et al. (2014) utilised data from population surveys and government agencies, among other sources, to calculate direct costs of sexual violence against 55,340 people in the state. These costs included medical care and mental healthcare expenses, among other non-health-related expenses (e.g. property damage and indirect expenses for loss of work). The estimated total cost of sexual violence in Iowa in 2009 was US$4.7 billion, which equated to US$1,580 per resident (Yang et al., 2014).
Recovery from sexual violence
Despite some variation in the strength of associations, the literature consistently demonstrates the significant and long-lasting impact of sexual violence on women. This underscores the need to address the increased vulnerability to further violence, sociodemographic differences and health deficits shown to exist among women who have experienced sexual violence (Ellsberg et al., 2015). It is important to understand the factors that might assist in improving women’s recovery from sexual violence, to inform potential services and policies (Hellman, 2014). There is a paucity of evidence regarding sexual violence specifically; however, some studies have identified potential factors for future research to focus on. In particular, the recent literature highlights the influence of social support for assisting women with a history of sexual violence in their recovery from mental health and health behavioural issues (Dillon et al., 2015; Hunteret al., 2012; Rees et al., 2019), although the relationship between sexual violence and social support remains unclear (Hunter et al., 2012; Rees et al., 2019).
A number of studies have assessed the effectiveness of programs and psychological services designed to assist women’s recovery from domestic violence, however, there is a need for research into services specific to supporting those who have experienced sexual violence. A recent review of previous systematic reviews was conducted to identify interventions relevant to recovery from domestic and sexual violence in primary care (Hegarty et al., 2016). Findings revealed limited evidence regarding effective interventions. However, the following interventions showed strong potential:
- nurse home visiting advocacy programs
- mother–child psychotherapeutic interventions
- specific psychological treatments (including cognitive behaviour therapy, trauma-informed cognitive behaviour therapy and eye movement desensitisation and reprocessing interventions; Hegarty et al., 2016).
A recent mixed-methods study demonstrated the negative impact of intimate partner violence on women’s sense of self (Moulding et al., 2021). Moulding et al. (2021) outlined the losses in relation to income, work, housing and social participation that were seen to undermine women’s recovery from violence in the long term. This study highlighted the influence of socioeconomic factors on psychological distress in response to experiencing violence and highlighted the potential role of these factors in assisting with women’s recovery (Moulding et al., 2021).
Furthermore, some services have demonstrated improvements in health behaviour linked to sexual violence. For example, for a sample of 233 girls, Walsh et al. (2020) reported on the effectiveness of a brief video delivered to victims during medical forensic examination of sexual assault. The video intervention, designed to reduce psychopathology, was shown to prevent uptake of cigarette smoking following sexual assault. Notably, this intervention focused on preventing further impact of sexual violence rather than recovery (Walsh et al., 2020).
In addition, a recent Australian study followed a mixed-methods approach to identify contextual factors and mediating emotional responses associated with experiences of mental health conditions following sexual violence (Rees et al., 2019). The qualitative component of the study highlighted the impact of negative responses to violence disclosure by parents and other family members, as well as barriers to support, validation and trust among women who had experienced sexual violence as a child. Women with a history of childhood sexual violence reported being ignored, not being believed and being threatened with retribution following disclosure to adult family members. Other themes that emerged included self-blame, betrayal and psychosocial vulnerability. These findings underscored the need for further research in this area to gain deeper understanding of potential factors that support women’s recovery from the long-term impacts of sexualviolence (Rees et al., 2019).
Policy context: The National Plan to Reduce Violence Against Women and Their Children 2010–2022
The Australian Government Department of Social Services highlights sexual violence as a national priority area in the Fourth Action Plan of the National Plan to Reduce Violence against Women and Their Children 2010–2022 (Department of Social Services, 2019). In addition, the Fourth Action Plan underscores the need to respond to diverse experiences of violence, identifying priority populations of women who experience higher rates of violence, experience more barriers to help-seeking and accessing support, and/or are at higher risk of experiencing violence at particular life stages (Department of Social Services, 2019). To address these national priorities, there is a need for high-quality research into the prevalence and impact of sexual violence across the life course. This requires accurate and comprehensive longitudinal data.
Evidence gap
Despite the pervasive nature of sexual violence, data in Australia are largely confined to those collected at a single point in time. This approach is limited due to its inability to capture experiences of violence across the life course. Thus, there is uncertainty surrounding the true prevalence of sexual violence throughout women’s lives. Previous ALSWH research highlights the importance of collecting longitudinal data on violence to capture the complexity of women’s experiences. In addition, it is suggested that repeated data collection of experiences of violence across time may mitigate the effects of potential under-reporting (Loxton, Townsend et al., 2017).
Some of the variation within the available literature on prevalence likely reflects heterogeneity between sample characteristics. Non-population-based samples, such as those in the general practice setting and among pregnant women, can affect external validity by limiting the applicability of findings to the general population (Cox, 2015; Davidson et al., 2016; Gartland et al., 2016; Tarzia et al., 2017; Tarzia et al., 2018; Woolhouse et al., 2015). A number of studies have also reported on data collected using conservative measures of violence, such as cases captured from child protection data (Mathews et al., 2017). As experiencing violence is often under-reported, studies using administrative data sources are likely to underestimate true prevalence (Alaggia et al., 2017). Further, this is exacerbated for various cohorts of women, including First Nations women, migrant and refugee women, women in rural and remote communities, womenwith disability, and LGBTQA+ and intersex communities (Australian Institute of Health and Welfare, 2019b; Bonomi et al., 2018; Dillon et al., 2015; Heywood et al., 2022; Szalacha et al., 2017; Ussher et al., 2020; Willis, 2011). Population-based surveys capturing self-reported data from people who have experienced sexual violence offer the most accurate estimates of sexual violence prevalence (World Health Organization, 2017).
Research suggests that women with a history of sexual violence are more likely to experience further violence throughout the life course compared to those without such history (Aakvaag et al., 2019; Conley et al., 2017; Cox, 2015; Gartland et al., 2016; Öberg et al., 2019; Öberg et al., 2021; Relyea & Ullman, 2017). However, as previously highlighted in the ANROWS Landscapes Series (Cox, 2015), this is yet to be examined using longitudinal data from nationally representative samples in Australia. Thus, there is also a large degree of uncertainty surrounding the potential links between sexual violence at different life stages and vulnerability to violence.
There is also limited understanding about the ways sexual violence impacts women over time. The trajectory of economic, social, physical and mental health of women who have experienced sexual violence is unknown (Bacchus et al., 2018; Carr et al., 2020; Dillon et al., 2015; Nikischer, 2014; Sanz-Barbero et al., 2019). It is important to better understand this to identify factors that might assist in recovery from sexual violence. Service use, cost and satisfaction has not been examined at the national level in Australia, nor have potentially helpful social factors. In addition to education and paid employment, services and social factors might have the capacity to help improve women’s quality of life after sexual violence, but empirical evidence is lacking. There is a crucial need to identify factors that improve women’s recovery from sexual violence.
A recent ANROWS research synthesis on intimate partner sexual violence underscored the current need for studies that accurately capture multiple experiences of violence across the life course within samples that are representative of the general population (Australia’s National Research Organisation for Women’s Safety, 2019). The ALSWH offers a unique opportunity to fill this gap, providing data on sexual violence that are comprehensive, accurate, broadly representative and span a period of more than 20 years. Recent findings from the study indicate that almost one in two (46%) women born in 1989 to 1995 had experienced sexual violence (Loxton et al., 2019). The present study builds on these results by examining sexual violence prevalence and impact across multiple time points and for women in three distinct age cohorts (those born in 1989 to 1995, 1973 to 1978 and 1946 to 1951), covering ages 18 to 74.
Further, previous research findings have indicated that those from certain groups and communities may experience sexual violence at higher rates, however these have not been extensively examined (Australian Institute of Health and Welfare, 2019b; Bonomi et al., 2018; Dillon et al., 2015; Heywood et al., 2022; Lewis et al., 2015; Sanz-Barbero et al., 2019; Sigurvinsdottir & Ullman, 2016; Szalacha et al., 2017; Ussher et al., 2020). This study considers differences in the prevalence and impact of sexual violence among priority populations. For the purposes of this report, this includes those identified as belonging to priority populations in the Fourth Action Plan of the National Plan to Reduce Violence Against Women and Their Children 2010–2022 (Department of Social Services, 2019), for whom data are available. This includes women living in regional and remote areas; women who are from CALD backgrounds; women with disability;and women who are lesbian, gay and bisexual.
It should be noted that, while Aboriginal and Torres Strait Islander women take part in the ALSWH, the data are not currently disaggregated by Indigenous status for historical and ethical reasons.[2] Due to requests from Aboriginal and Torres Strait Islander communities to access this data, this policy is under review and consultations with representatives from Aboriginal and Torres Strait Islander communities are underway.
Aims of project
The purpose of this report was to assess the prevalence of sexual violence over the life course and the impact of sexual violence on health and wellbeing among Australian women by analysing national, longitudinal data. The research had the following specific aims:
- Determine the prevalence of sexual violence across the life course, including sexual violence experienced in childhood and adulthood, experienced both within an intimate relationship and outside of such a relationship.
- Determine the role of sexual violence during childhood as a risk factor for experiences of multiple forms of violence later in life.
- Identify the impact of sexual violence on socioeconomic factors over time, such as education, paid employment and financial stress.
- Determine the nature of associations between sexual violence experienced by women at different life stages and subsequent health behaviours.
- Assess the impact of sexual violence on women’s physical and mental health.
- Measure health service use in relation to sexual violence, including costs of selected health services and satisfaction with general practitioner services.
- Identify factors associated with the general health and wellbeing of women who have experienced sexual violence.
Methods
Study setting
The ALSWH is an ongoing, national cohort study that investigates factors influencing the health and wellbeing of Australian women. The study began in 1996, and now includes data from more than 57,000 women across four age cohorts (born in 1989 to 1995, 1973 to 1978, 1946 to 1951 and 1921 to 1926). The ALSWH collects data on women’s physical and mental health, as well as demographics, health behaviours and attributes, lifestyle factors, social circumstances and use of health services. ALSWH data are linked with national and state-based administrative health datasets, such as the Medicare Benefits Schedule (MBS) and the Pharmaceutical Benefits Scheme (PBS), as well as hospital admission, perinatal and cancer registry datasets.
In 1996, the cohorts from 1973 to 1978, 1946 to 1951 and 1921 to 1926 were randomly selected from the Medicare database and recruited via mailed surveys (Brown et al., 1998). The three original cohorts were selected to follow women through life stages which are critical to women’s health and wellbeing. Sampling from the population was random within each age group, except that women from rural and remote areas were sampled at twice the rate of women in urban areas. This was done so that the numbers of women living outside major urban areas were large enough to allow statistical comparisons based on location.
In 2012 to 2013, a new cohort of women aged 18 to 23 years (born 1989 to 1995) was recruited using traditional methods (e.g. referral, print and commercial media), social media and social marketing campaigns (Loxton et al., 2015). In the first online survey, participants indicated their consent to participate by completing the survey, consenting to data linkage and providing their personal details. Information was validated by the Australian Government’s Services Australia.
Participants
The cohorts have been compared with Australian Census data of women of the same age and are found to be broadly representative of Australian women of the same age, with some over-representation of tertiary-educated women and some under-representation of women from non-English speaking backgrounds (Dobson et al., 2015; Mishra et al., 2014). This ANROWS report includes data from the three youngest ALSWH cohorts (born 1989 to 1995, 1973 to 1978 and 1946 to 1951). Participants from the 1973 to 1978 and 1946 to 1951 cohorts have been surveyed approximately every three years since 1996, while participants in the 1989 to 1995 cohort have been surveyed annually from 2013 to 2017 and then again in 2019 (Table 1).
Table 1: Schedule of surveys across the three ALSWH cohorts born 1989 to 1995, 1973 to 1978 and 1946 to 1951, detailing year, age range and number of respondents at each survey
| Survey | 1989 to 1995 cohort | 1973 to 1978 cohort | 1946 to 1951 cohort |
|---|---|---|---|
| 1 | 2013 Aged 18 to 23 N=17,010 | 1996 Aged 18 to 23 N=14,247 | 1996 Aged 45 to 50 N=13,714 |
| 2 | 2014 Aged 19 to 24 N=11,345 | 2000 Aged 22 to 27 N=9,688 | 1998 Aged 47 to 52 N=12,338 |
| 3 | 2015 Aged 20 to 25 N=8,961 | 2003 Aged 25 to 30 N=9,081 | 2001 Aged 50 to 55 N=11,226 |
| 4 | 2016 Aged 21 to 26 N=7,287 | 2006 Aged 28 to 33 N=9,145 | 2004 Aged 53 to 58 N=10,905 |
| 5 | 2017 Aged 22 to 27 N=8,495 | 2009 Aged 31 to 36 N=8,200 | 2007 Aged 56 to 61 N=10,638 |
| 6 | 2019 Aged 24 to 30 N=8,346 | 2012 Aged 34 to 39 N=8,009 | 2010 Aged 59 to 64 N=10,011 |
| 7 | 2015 Aged 37 to 42 N=7,186 | 2013 Aged 62 to 67 N=9,151 | |
| 8 | 2018 Aged 40 to 45 N=7,121 | 2016 Aged 65 to 70 N=8,622 | |
| 9 | 2021 Aged 43 to 48 in progress | 2019 to 2020 Aged 68 to 73 N=7,956 |
The ALSWH has approval from the Human Research Ethics Committees from the University of Newcastle (H-076-0795, H-2012-0256 and H-2011-0371) and the University of Queensland (2004/HE000224, 2012/HE000950 and 2012/HE000132).
Measures
The measures included in each ALSWH survey are decided on in consultation with the Australian Government Department of Health, which funds data collection for the study, and various stakeholders. All measures are not able to be included in every survey and in all cohorts, as survey length has to be maintained to minimise the burden on participants.[3]
Sexual violence
The current report includes measures of 1) sexual violence experienced during childhood; 2) sexual violence experienced within an intimate relationship (i.e. sexual violence perpetrated by a spouse or partner); and 3) sexual violence where the perpetrator was not specified in the survey question. The schedule of data collection for these measures is shown in Table 2.
Table 2: Collection of sexual violence data across surveys for the ALSWH cohorts born 1989 to 1995, 1973 to 1978 and 1946 to 1951
Born 1989 to 1995
| Survey | Survey year | During childhood | By partner | Unspecified perpetrator |
|---|---|---|---|---|
| 1 | 2013 | The measure of sexual violence was included | ||
| 2 | 2014 | The measure of sexual violence was included | The measure of sexual violence was included | |
| 3 | 2015 | The measure of sexual violence was included | The measure of sexual violence was included | |
| 4 | 2016 | The measure of sexual violence was included | ||
| 5 | 2017 | Captured at this survey if not captured at previous surveys The measure of sexual violence was included | The measure of sexual violence was included | The measure of sexual violence was included |
| 6 | 2019 | Captured at this survey if not captured at previous surveys The measure of sexual violence was included | The measure of sexual violence was included | The measure of sexual violence was included |
Born 1973 to 1978
| Survey | Survey year | During childhood | By partner | Unspecified perpetrator |
|---|---|---|---|---|
| 1 | 1996 | |||
| 2 | 2000 | The measure of sexual violence was included | ||
| 3 | 2003 | The measure of sexual violence was included | ||
| 4 | 2006 | The measure of sexual violence was included | ||
| 5 | 2009 | The measure of sexual violence was included | The measure of sexual violence was included | |
| 6 | 2012 | The measure of sexual violence was included | The measure of sexual violence was included | |
| 7 | 2015 | The measure of sexual violence was included | The measure of sexual violence was included | The measure of sexual violence was included |
| 8 | 2018 | The measure of sexual violence was included | The measure of sexual violence was included |
Born 1946 to 1951
| Survey | Survey year | During childhood | By partner | Unspecified perpetrator |
|---|---|---|---|---|
| 1 | 1996 | |||
| 2 | 1998 | The measure of sexual violence was included | ||
| 3 | 2001 | The measure of sexual violence was included | ||
| 4 | 2004 | The measure of sexual violence was included | ||
| 5 | 2007 | The measure of sexual violence was included | ||
| 6 | 2010 | The measure of sexual violence was included | ||
| 7 | 2013 | The measure of sexual violence was included | ||
| 8 | 2016 | The measure of sexual violence was included | The measure of sexual violence was included | |
| 9 | 2019 | The measure of sexual violence was included |
* Captured at this survey if not captured at previous surveys.
Shaded cells indicate that the measure of sexual violence was included at that survey.
Sexual violence during childhood
The Adverse Childhood Experiences Scale (Felitti et al., 1998) was used to retrospectively measure childhood abuse. This instrument includes four items that measure sexual violence experienced during childhood (Table 3), with participants asked to indicate those experiences that applied to them, providing a minimum summed score of zero and a maximum summed score of four. A score greater than zero indicates a history of sexual violence during childhood.
Table 3: Childhood sexual violence items from the Adverse Childhood Experiences Scale
| While you were growing up during your first 18 years of life, did an adult or person at least 5 years older than you: (mark all that apply) |
|---|
| Touch or fondle you in a sexual way? |
| Have you touch their body in a sexual way? |
| Attempt oral, anal or vaginal intercourse with you? |
| Actually have oral, anal or vaginal intercourse with you? |
Sexual violence perpetrated by a partner
For the 1989 to 1995 and 1973 to 1978 cohorts, women were asked: “This question asks about situations you may have experienced with current or past partners: being forced to take part in unwanted sexual activity”, with response options: “In the last 12 months”, “More than 12 months ago” or “Never”. Note that at Survey 4 of the 1973 to 1978 cohort, the response options were “Only once”, “Several times”, “Once per month”, “Once per week”, “Daily” or “Never.” These response options were collapsed as required to match the categories used in the later survey measures.
Sexual violence perpetrated by an unspecified perpetrator
Women in all cohorts were asked, “Have you experienced any of the following events: being forced to take part in unwanted sexual activity” with response options: “In the last 12 months”, “More than 12 months ago” or “Never”. Note that at Survey 1 of the 1973 to 1978 and 1946 to 1951 cohorts, the question was phrased: “In the last 12 months, have you experienced any of the following events: being forced to take part in unwanted sexual activity” with response options “Yes” and “No”.
Cumulative sexual violence
We defined a composite variable for whether or not women had ever experienced any sexual violence at each time point (yes or no). In models examining the effect of sexual violence, we used the lag of this variable as the exposure, so that the sexual violence exposure preceded the outcome/s used in the analyses.
Domestic violence
Women in all cohorts were asked at all surveys (except Survey 2 and Survey 3 of the 1973 to 1978 and 1946 to 1951 cohorts), “Have you ever been in a violent relationship with a partner/spouse?”, with response options “Yes” and “No”. An affirmative response was considered indicative of a history of domestic violence.
For the 1989 to 1995 and 1973 to 1978 cohorts, women could also have reported a history of domestic violence via the Community Composite Abuse Scale (CCAS) or the Abbreviated Community Composite Abuse Scale (abCCAS), respectively (Loxton et al., 2013). These scales include questions related to four domains of behaviour by a partner or spouse: emotional abuse, physical abuse, harassment and sexual abuse. The following response options were available: “Never”, “Yes – in the last 12 months” and “Yes – more than 12 months ago”. Note that at Survey 4 of the 1973 to 1978 cohort, the response options were “Only once”, “Several times”, “Once per month”, “Once per week”, “Daily” or “Never”. These response options were collapsed to “In the last 12 months” or “Never”. An affirmative response for any item on the CCAS or abCCAS instruments was considered indicative of a history of domestic violence, except for the CCAS item “Became upset ifdinner/housework wasn’t done” and the abCCAS item “Became upset if dinner/housework wasn’t done when they thought it should be”. In a similar manner, a response to “Yes – in the last 12 months” was considered indicative of recent domestic violence (excluding the dinner/housework item).
Physical violence
Women in all cohorts were asked “Have you experienced the following events: being pushed, grabbed, shoved, kicked or hit?”, with response options: “No”, “Yes – in the last 12 months” and “Yes – more than 12 months ago”. An affirmative response was considered indicative of a history of physical violence (in the last 12 months or more than 12 months ago). A response to “Yes – in the last 12 months” was considered indicative of recent physical violence.
Similarly, an affirmative response to any of the items in the physical abuse domain of the CCAS or abCCAS was considered indicative of a history of physical violence by a partner. A response to “Yes – in the last 12 months” for any of the physical violence items was considered indicative of recent physical violence.
All the physical violence items were combined to form a single physical violence item, which includes lifetime physical violence and recent physical violence variants.
Socio-demographic factors
Age
Age was calculated at each survey by obtaining the difference between the survey completion date and the participant’s date of birth. Models that controlled for age treated age as a continuous variable.
Area of residence
Available for each survey, area of residence was based on the Accessibility/Remoteness Index of Australia (ARIA+), which indicates remoteness from service centres (Hugo Centre for Migration and Population Research, 2018). ARIA+ scores were grouped into “Major cities”, “Inner regional” and “Outer regional/remote/very remote”.
Educational status
Educational status was based on the highest qualification reported by the participant. The response options varied across the three cohorts but were broadly similar. Women’s responses were grouped into “Year 12 or below”, “Trade/apprenticeship/certificate/diploma” and “Tertiary qualification”. In Chapter 3, where specified, an alternative categorisation of “Year 12 or below”, “Year 12” and “More than Year 12” was used.
Relationship status
Relationship status was reported by each participant at each survey and was measured consistently across all three cohorts. Women’s responses were grouped into “Partnered” (married or de facto) and “Non-partnered” (separated, divorced, widowed or single).
Ability to manage on available income
Participants were asked at all surveys (except Survey 2 for women born 1973 to 1978), “How do you manage on the income you have available?” Responses were grouped into “Impossible/difficult all the time”, “Difficult some of the time” and “Not too bad/easy”. Further details on this survey item, including internal validation, can be found in the ALSWH Technical Reports (Australian Longitudinal Study on Women’s Health, 2019).
Cultural and linguistic diversity
Two measures were used to identify women from culturally and linguistically diverse (CALD) backgrounds. These measures captured information on country of birth and language. Women were classified as having a CALD background if they indicated that 1) they were born in a country where English was not the national language; 2) they did not speak fluent English; or 3) they usually spoke a language at home which was not English.
Women in all three cohorts were asked about their country of birth. Responses were categorised to indicate countries that are English-speaking versus those that are not. This measure was included in Survey 1, for women born 1973 to 1978 and 1946 to 1951, and Survey 2 for women born 1989 to 1995. At their first survey, all three cohorts were asked if they spoke fluent English and to indicate the language they spoke at home.
Financial outcomes
Full-time employment
Full-time employment was defined as working 35 or more hours per week, as per the Australian Bureau of Statistics definition (Australian Bureau of Statistics, 2021).
Financial stress
Financial stress was measured using the question “Over the last 12 months, how stressed have you felt about the following areas of your life?” for the item “Money”, with the following response options: “Not applicable”, “Not at all stressed”, “Somewhat stressed”, “Moderately stressed”, “Very stressed” and “Extremely stressed”. A dichotomous variable (yes/no) was subsequently derived to indicate high financial stress (very stressed or extremely stressed).
Sexual orientation
Sexual orientation was measured using the question “Which of these most closely describes your sexual orientation?”, with the following response options: “I am exclusively heterosexual”, “I am mainly heterosexual”, “I am bisexual”, “I am mainly homosexual”, “I am exclusively homosexual (lesbian)”, “I don’t know” and “I don’t want to answer”. These responses were then collapsed into three categories: “Exclusively/mainly heterosexual”, “Bisexual” and “Exclusively/mainly lesbian”.
Health behaviours
Smoking status
Smoking status was measured at each survey in each cohort. Women were classified as either “Non-smokers” (including ex-smokers) or “Current smokers”.
Alcohol consumption
Alcohol consumption was measured at each survey in each cohort according to NHMRC guidelines (Pols et al., 1992) and women were classified as either “Non-drinkers”, “Low-risk drinkers”, “Infrequent drinkers”, “Risky drinkers” or “High-risk drinkers”. In Chapter 4, these responses were then dichotomised as “Low-risk drinkers” (non-drinkers, low-risk drinkers and infrequent drinkers) and “High-risk drinkers” (risky drinkers and high-risk drinkers).
Physical activity
Physical activity was measured at each survey in each cohort according to Australian guidelines (Brown et al., 2013) and women were classified as having nil, low, moderate or high physical activity. In Chapter 4, these responses were then dichotomised as “Low physical activity” (nil and low) and “High physical activity” (moderate and high).
Illicit drug use
Women born 1989 to 1995 and 1973 to 1978 were defined as having recent illicit drug use if they indicated that they had used illicit drugs in the last 12 months in response to the questions “Have you tried marijuana/cannabis?”, “Have you tried any other illicit drugs?” or “In the last 12 months how often did you use marijuana/cannabis for recreational use?” Illicit drug use was not measured among women born 1946 to 1951.
Physical health
Self-rated general health
Women in each cohort at each survey were asked “In general, would you say your health is?” with the possible responses: “Excellent”, “Very good”, “Good”, “Fair” or “Poor” (Ware & Sherbourne, 1992). In Chapter 5, these responses were then dichotomised to create an indicator variable for women who reported “Fair” or “Poor” health.
Number of physical conditions
The number of physical conditions was dichotomised as multimorbidity (yes/no), which was defined as two or more chronic conditions. The conditions measured varied by cohort. The list of physical conditions included for each cohort was selected to maximise measurement consistency across the longitudinal surveys and is tailored to the age of the cohort. Women born 1989 to 1995 were treated as having multimorbidity if they had two or more of the following conditions: diabetes, asthma, endometriosis and polycystic ovarian syndrome. Women born 1973 to 1978 were treated as having multimorbidity if they had two or more of the following conditions: diabetes, heart disease, non-gestational hypertension, asthma, cancer (excluding skin cancer) and endometriosis. Women born 1946 to 1951 were treated as having multimorbidity if they had two or more of the following conditions: diabetes, heart disease, non-gestational hypertension, stroke, thrombosis, asthma,osteoporosis, cancer (excluding skin cancer) and arthritis.
Bodily pain
Bodily pain was measured using the question “How much bodily pain have you had during the past four weeks?”, with response options on a six-point scale from “None” to “Very severe”, and the question “During the past four weeks, how much did pain interfere with your normal work (including both work outside the home and housework)?”, with response options on a five-point scale from “Not at all” to “Extremely” (Ware & Sherbourne, 1992). Women who responded to the first question with “Severe” or “Very severe” and women who responded to the second question with “Quite a bit” or “Extremely” were classified as having “High bodily pain”. Women who selected other response options were classified as having “Low bodily pain”.
Sexually transmitted infections
Women were classified as having had a recent sexually transmitted infection (STI) if they reported having recently had any of the following STIs: chlamydia, genital herpes, genital warts, HIV or AIDS, hepatitis B or C, gonorrhoea or other unspecified STI. There was some variation between cohorts and surveys as to which STI options could be selected.
Mental health
Depression
Women were classified as having recently experienced depression if they indicated that they had been diagnosed with or treated for depression in the last 12 months (for women born 1989 to 1995) or in the last three years (for women born 1973 to 1978 and 1946 to 1951). The different time intervals align with the timing of survey deployment within each cohort.
Anxiety
Women were classified as having recently experienced anxiety if they indicated that they had been diagnosed with or treated for anxiety in the last 12 months (for women born 1989 to 1995) or in the last three years (for women born 1973 to 1978 and 1946 to 1951).
Perceived stress
Perceived stress was measured in all three groups of women at each survey using the question “Over the last 12 months, how stressed have you felt about the following areas of your life?” for 10 to 12 domains (depending on the cohort and survey), such as “Own health”, “Work/employment” and “Relationships with partner/spouse”. Responses were recorded on a five-point scale from “Not stressed at all” to “Extremely stressed”. The mean of the multi-item summed score for perceived stress was calculated and then dichotomised as either “None/minimal” (score ≤1) or “Moderate/high” (score >1 and ≤4; Harris et al., 2013).
Psychological distress
Psychological distress was measured among women born 1989 to 1995 using the Kessler Psychological Distress Scale (K10; Kessler et al., 2002). Women were asked 10 questions about their psychological distress over the last four weeks such as “How often did you feel depressed?” and “How often did you feel tired for no good reason?” Responses were recorded on a five-point scale from “None of the time” to “All of the time”. These responses were summed to generate an overall score between 10 and 50. Total scores were then dichotomised as “Low/moderate” (score <22) or “High/very high” (score ≥22; Australian Bureau of Statistics, 2012). Psychological distress was not measured longitudinally among women born 1973 to 1978 and 1946 to 1951.
Satisfaction with general practitioner services
Data about general practitioner services and satisfaction (Fitzgerald, 2022) was analysed for women born 1973 to 1978. Women were asked five questions about their satisfaction with general practitioner services, including items such as “The doctor’s explanation of your problem and treatment” and “The doctor’s interest in how you felt about having the tests, treatment or the advice given”. Responses were recorded on a five-point scale from “Poor” to “Excellent”. The average score was calculated for women who answered at least three of the five items and this value was subtracted from six to give the final score. Higher scores indicate higher satisfaction. Scores were then dichotomised, with the bottom 20 per cent of general practitioner satisfaction scores at each survey treated as “Dissatisfied” and “Not dissatisfied” otherwise.
Costs of health services
Costs of health services were analysed in Chapter 6 using MBS and PBS data. Costs were aggregated according to financial year (1 July to 30 June). Costs presented are the benefit paid by government (if any). MBS services between 1 July 1996 and 30 June 2020 were analysed. Complete data on drugs available below the co-payment threshold first became available on 1 April 2012 (Australian Government Department of Health, 2019). Consequently, PBS services between 1 July 2012 and 30 June 2020 were analysed.
All values were presented in Australian dollars and were unadjusted for inflation. Private medication scripts were not included in the PBS datasets analysed. Average costs presented were among women who had at least one service of that type. For example, the average cost of psychoactive medications in the 2019 to 2020 financial year was the average of the costs of psychoactive medications among women who had at least one psychoactive medication in the 2019 to 2020 financial year (i.e. women with zero cost were excluded from the calculation of the average).
Throughout Chapter 6, mean values were presented rather than median values to simplify the interpretation. However, it should be noted that the distribution of annual costs in the MBS and PBS was right-skewed and so the mean was not always similar to the median. The impact is negligible for the overall interpretation of our findings, as similar conclusions would have been made if using means or medians (i.e. is there an effect of sexual violence on healthcare costs).
Social support
Social support was measured using the Medical Outcomes Study social support survey (Sherbourne & Stewart, 1991), which has the question stem “How often is each of the following kind[s] of support available to you if you need it?” and then items such as “Someone to help you if you are confined to bed” and “Someone to give you good advice about a crisis”, with five Likert-scale response options ranging from “None of the time” to “All of the time”. Responses to these items were used to calculate subscale scores for tangible or physical assistance, affection and social interaction, and emotional support and guidance.
Improvement in mental health
In Chapter 7, we examined the association between use of mental health services and reported improvements in mental health. An improvement in mental health over time was defined according to the recommendation for a minimal important difference of half a standard deviation (Norman et al., 2003). Using our data, half a standard deviation corresponded to four units on the K10 scale (1989 to 1995 cohort) and 10 units on the SF-36 MHI-5 scale (1973 to 1978 and 1946 to 1951 cohorts).
Mental health consultations
Participants were asked “Have you consulted the following services for your own health in the last 12 months?”, which included an item for “A counsellor or other mental health worker”. There were some slight variations in the wording of this question between surveys.
Analysis strategy
Descriptive statistics (counts or percentages) were presented, often using figures to illustrate groups. The Poisson approximation to log-binomial regression models was used in Chapters 2, 3, 4, 5 and 7 to estimate risk ratios with corresponding 95 per cent confidence intervals (Zou, 2004). The models were constructed using the outcome and exposure of interest for each model and a set of pre-specified sociodemographic covariates.
Each model (unless otherwise stated) was controlled for whether the participant was from a CALD background, age (as a continuous variable), area of residence, highest qualification, relationship status, ability to manage on available income (as a surrogate measure of socioeconomic status) and the effect of time (time in years since first survey for each cohort, as a continuous variable).
The longitudinal models presented in Chapter 6 were generalised linear models with a gamma distribution and a logarithmic link function that accounted for correlated observations within the same individual by treating participant ID as a random effect. The effect estimates presented in the same chapter were not adjusted for any covariates.
All analyses were conducted in Stata 15. Confidence intervals were established using standard methods provided by modelling procedures in Stata.
Results
Please note that causation should not be inferred for associations found in the results presented below.
Chapter 1:
Prevalence of sexual violence
Lifetime sexual violence
More than half (51%) of women born in 1989 to 1995 indicated that they had experienced sexual violence in their lifetime by the time they were aged 24 to 30.
One third (34%) of women born in 1973 to 1978 reported that they had experienced sexual violence in their lifetime by the time they were aged 40 to 45.
One quarter (26%) of women born in 1946 to 1951 reported that they had experienced sexual violence in their lifetime by the time they were aged 68 to 73.
Figure 1: Prevalence of any sexual violence (including sexual violence during childhood) over time
Data table for figure 1
Born 1989 to 1995
| Year | Prevalence |
|---|---|
| Aged 18 to 24 2013 | 31% |
| Aged 19 to 25 2014 | 37% |
| Aged 20 to 26 2015 | 39% |
| Aged 21 to 27 2016 | 41% |
| Aged 22 to 28 2017 | 47% |
| Aged 24 to 30 2019 | 51% |
Born 1973 to 1978
| Year | Prevalence |
|---|---|
| Aged 18 to 23 1996 | 11% |
| Aged 22 to 27 2000 | 17% |
| Aged 25 to 30 2003 | 21% |
| Aged 28 to 33 2006 | 23% |
| Aged 31 to 36 2009 | 27% |
| Aged 34 to 39 2012 | 29% |
| Aged 37 to 42 2015 | 33% |
| Aged 40 to 45 2018 | 34% |
Born 1946 to 1951
| Year | Prevalence |
|---|---|
| Aged 45 to 50 1996 | 10% |
| Aged 47 to 52 1998 | 14% |
| Aged 50 to 55 2001 | 16% |
| Aged 53 to 58 2004 | 17% |
| Aged 56 to 61 2007 | 19% |
| Aged 59 to 64 2010 | 20% |
| Aged 62 to 67 2013 | 23% |
| Aged 65 to 70 2016 | 25% |
| Aged 68 to 73 2019 | 26% |
Sexual violence during childhood
Across the three cohorts, 13 per cent of women reported experiencing sexual violence during childhood perpetrated by an adult or person at least five years older:
- One in eight (12%) women reported being touched or fondled in a sexual way.
- Six per cent reported touching someone else’s body in a sexual way.
- Four per cent reported that someone attempted to have intercourse with them as a child.
- Three per cent reported that someone had intercourse with them as a child.
One in eight (12%) women born in 1989 to 1995 reported sexual violence during their childhood. Approximately 15 per cent of women born in 1973 to 1978 reported sexual violence during childhood. One in seven (14%) women born in 1946 to 1951 indicated that they had experienced childhood sexual violence. Results for particular acts of childhood sexual violence by cohort are summarised in Table 4. The most common form of childhood sexual violence across all cohorts was being touched or fondled in a sexual way, with oral, anal or vaginal intercourse being the least common.
Table 4: Sexual violence during childhood among Australian women born in 1989 to 1995 (N=10,816), 1973 to 1978 (N=7,186) and 1946 to 1951 (N=8,622)
Childhood sexual violence
| Women born 1989 to 1995 N | Women born 1989 to 1995 % (95% CI) | Women born 1973 to 1978 N | Women born 1973 to 1978 % (95% CI) | Women born 1946 to 1951 N | Women born 1946 to 1951 % (95% CI) | |
|---|---|---|---|---|---|---|
| Any childhood sexual violence | 1,312 | 12.1 (11.5, 12.7) | 1,070 | 14.9 (14.1, 15.7) | 1,206 | 14.0 (13.3, 14.7) |
| Did an adult or person at least 5 years older ever touch or fondle you in a sexual way? | 1,182 | 10.9 (10.3, 11.5) | 993 | 13.8 (13.0, 14.6) | 1,098 | 12.7 (12.0, 13.4) |
| Did an adult or person at least 5 years older ever have you touch their body in a sexual way? | 626 | 5.8 (5.3, 6.2) | 505 | 7.0 (6.4, 7.6) | 435 | 5.1 (4.6, 5.5) |
| Did an adult or person at least 5 years older attempt oral, anal or vaginal intercourse with you? | 499 | 4.6 (4.2, 5.0) | 330 | 4.6 (4.1, 5.1) | 340 | 3.9 (3.5, 4.4) |
| Did an adult or person at least 5 years older actually have oral, anal or vaginal intercourse with you? | 439 | 4.1 (3.7, 4.4) | 244 | 3.4 (3.0, 3.8) | 233 | 2.7 (2.4, 3.0) |
Sexual violence by a partner
1989 to 1995 cohort
When aged 18 to 24 years in 2013, 15 per cent of women reported that they had experienced sexual violence by a partner (Figure 2). Six years later, in 2019, this had increased to 33 per cent of women who were then aged 24 to 30.
Figure 2: Lifetime prevalence of sexual violence by a partner among Australian women born in 1989 to 1995
Data table for figure 2
| Survey | Cohort | Prevalence | Lower limit | Upper limit |
|---|---|---|---|---|
| Aged 18 to 24 (2013) | Born 1989 to 1995 | 14.80% | 14.26% | 15.33% |
| Aged 19 to 25 (2014) | Born 1989 to 1995 | 19.37% | 18.64% | 20.09% |
| Aged 20 to 26 (2015) | Born 1989 to 1995 | 23.32% | 22.45% | 24.20% |
| Aged 21 to 27 (2016) | Born 1989 to 1995 | 26.81% | 25.90% | 27.73% |
| Aged 22 to 28 (2017) | Born 1989 to 1995 | 29.82% | 28.84% | 30.79% |
| Aged 24 to 30 (2019) | Born 1989 to 1995 | 33.29% | 32.27% | 34.30% |
1973 to 1978 cohort
The lifetime prevalence of sexual violence by a partner among women born in 1973 to 1978 increased from 1 per cent when women were aged 28 to 33 in 2006 to 14 per cent when aged 40 to 45 in 2018 (Figure 3).
Figure 3: Lifetime prevalence of sexual violence by a partner among Australian women born in 1973 to 1978
Data table for figure 3
| Survey | Cohort | Prevalence | Lower limit | Upper limit |
|---|---|---|---|---|
| Aged 28 to 33 (2006) | Born 1973 to 1978 | 1.29% | 1.06% | 1.52% |
| Aged 31 to 36 (2009) | Born 1973 to 1978 | 7.11% | 6.55% | 7.67% |
| Aged 34 to 39 (2012) | Born 1973 to 1978 | 9.61% | 8.97% | 10.26% |
| Aged 37 to 42 (2015) | Born 1973 to 1978 | 11.90% | 11.15% | 12.65% |
| Aged 40 to 45 (2018) | Born 1973 to 1978 | 14.44% | 13.62% | 15.25% |
Sexual violence during adulthood [4]
1989 to 1995 cohort
Approximately one in five women (18%) aged 18 to 24 in 2013 had experienced sexual violence in adulthood (Figure 4). This prevalence increased over time to 39 per cent in 2019 when women were aged 24 to 30.
Figure 4: Prevalence of sexual violence experienced during adulthood among women born in 1989 to 1995
Data table for figure 4
| Survey | Cohort | Prevalence | Lower limit | Upper limit |
|---|---|---|---|---|
| Aged 18 to 24 (2013) | Born 1989 to 1995 | 18.32% | 17.59% | 19.05% |
| Aged 19 to 25 (2014) | Born 1989 to 1995 | 24.43% | 23.55% | 25.31% |
| Aged 20 to 26 (2015) | Born 1989 to 1995 | 26.40% | 25.49% | 27.32% |
| Aged 21 to 27 (2016) | Born 1989 to 1995 | 28.36% | 27.38% | 29.33% |
| Aged 22 to 28 (2017) | Born 1989 to 1995 | 33.55% | 32.54% | 34.55% |
| Aged 24 to 30 (2019) | Born 1989 to 1995 | 38.51% | 37.41% | 39.60% |
1973 to 1978 cohort
The prevalence of sexual violence experienced during adulthood among women born in 1973 to 1978 increased over time from 2 per cent when aged 18 to 23 in 1996 to 18 per cent when aged 40 to 45 in 2018 (Figure 5).
Figure 5: Prevalence of sexual violence experienced during adulthood among women born in 1973 to 1978
Data table for figure 5:
| Survey | Cohort | Prevalence | Lower limit | Upper limit |
|---|---|---|---|---|
| Aged 18 to 23 (1996) | Born 1973 to 1978 | 2.28% | 1.94% | 2.63% |
| Aged 22 to 27 (2000) | Born 1973 to 1978 | 6.14% | 5.54% | 6.74% |
| Aged 25 to 30 (2003) | Born 1973 to 1978 | 8.58% | 7.87% | 9.28% |
| Aged 28 to 33 (2006) | Born 1973 to 1978 | 10.06% | 9.32% | 10.80% |
| Aged 31 to 36 (2009) | Born 1973 to 1978 | 12.14% | 11.33% | 12.94% |
| Aged 34 to 39 (2012) | Born 1973 to 1978 | 13.95% | 13.11% | 14.79% |
| Aged 37 to 42 (2015) | Born 1973 to 1978 | 15.82% | 14.98% | 16.67% |
| Aged 40 to 45 (2018) | Born 1973 to 1978 | 17.90% | 16.94% | 18.85% |
1946 to 1951 cohort
The prevalence of sexual violence experienced during adulthood among women born in 1946 to 1951 increased over time from 1 per cent when aged 45 to 50 in 1996 to 12 per cent when aged 68 to 73 in 2019 (Figure 6).
Figure 6: Prevalence of sexual violence experienced during adulthood among women born in 1946 to 1951
Data table for figure 6:
| Survey | Cohort | Prevalence | Lower limit | Upper limit |
|---|---|---|---|---|
| Aged 45 to 50 (1996) | Born 1946 to 1951 | 1.06% | 0.84% | 1.27% |
| Aged 47 to 52 (1998) | Born 1946 to 1951 | 3.65% | 3.24% | 4.05% |
| Aged 50 to 55 (2001) | Born 1946 to 1951 | 5.04% | 4.56% | 5.51% |
| Aged 53 to 58 (2004) | Born 1946 to 1951 | 6.09% | 5.57% | 6.61% |
| Aged 56 to 61 (2007) | Born 1946 to 1951 | 6.69% | 6.15% | 7.23% |
| Aged 59 to 64 (2010) | Born 1946 to 1951 | 7.31% | 6.75% | 7.87% |
| Aged 62 to 67 (2013) | Born 1946 to 1951 | 9.66% | 9.01% | 10.30% |
| Aged 65 to 70 (2016) | Born 1946 to 1951 | 10.65% | 10.00% | 11.30% |
| Aged 68 to 73 (2019) | Born 1946 to 1951 | 11.84% | 11.10% | 12.57% |
Recent sexual violence
Recent sexual violence is defined as sexual violence that occurred in the 12 months prior to the survey.
1989 to 1995 cohort
The prevalence of recent sexual violence among women born in 1989 to 1995 varied from 4 per cent to 6 per cent over the study period (Figure 7).
Figure 7: Prevalence of recent sexual violence among women born in 1989 to 1995
Note: Consistently measured recent sexual violence data were not available in 2015 and 2016 (Surveys 3 and 4).
Data table for figure 7:
| Survey | Cohort | Prevalence | Lower limit | Upper limit |
|---|---|---|---|---|
| Aged 18 to 24 (2013) | Born 1989 to 1995 | 5.74% | 5.39% | 6.09% |
| Aged 19 to 25 (2014) | Born 1989 to 1995 | 5.07% | 4.67% | 5.47% |
| Aged 20 to 26 (2015) | Born 1989 to 1995 | No data | No data | No data |
| Aged 21 to 27 (2016) | Born 1989 to 1995 | No data | No data | No data |
| Aged 22 to 28 (2017) | Born 1989 to 1995 | 4.50% | 4.06% | 4.94% |
| Aged 24 to 30 (2019) | Born 1989 to 1995 | 3.58% | 3.18% | 3.98% |
1973 to 1978 cohort
The prevalence of recent sexual violence among women born in 1973 to 1978 varied slightly over time, from 4 per cent when aged 18 to 23 in 1996 to 1 per cent when aged 22 to 27 in 2000, remaining relatively constant thereafter (Figure 8).
Figure 8: Prevalence of recent sexual violence among women born in 1973 to 1978
Data table for figure 8:
| Survey | Cohort | Prevalence | Lower limit | Upper limit |
|---|---|---|---|---|
| Aged 18 to 23 (1996) | Born 1973 to 1978 | 3.68% | 3.37% | 3.99% |
| Aged 22 to 27 (2000) | Born 1973 to 1978 | 1.53% | 1.28% | 1.77% |
| Aged 25 to 30 (2003) | Born 1973 to 1978 | 1.04% | 0.83% | 1.24% |
| Aged 28 to 33 (2006) | Born 1973 to 1978 | 1.27% | 1.04% | 1.50% |
| Aged 31 to 36 (2009) | Born 1973 to 1978 | 1.16% | 0.93% | 1.39% |
| Aged 34 to 39 (2012) | Born 1973 to 1978 | 0.95% | 0.74% | 1.16% |
| Aged 37 to 42 (2015) | Born 1973 to 1978 | 1.03% | 0.80% | 1.26% |
| Aged 40 to 45 (2018) | Born 1973 to 1978 | 1.31% | 1.04% | 1.57% |
1946 to 1951 cohort
The prevalence of recent sexual violence among women born in 1946 to 1951 was reasonably consistent, with less than 2 per cent of women in this cohort reporting recent sexual violence over the study period (Figure 9).
Figure 9: Prevalence of recent sexual violence among women born in 1946 to 1951
Data table for figure 9:
| Survey | Cohort | Prevalence | Lower limit | Upper limit |
|---|---|---|---|---|
| Aged 45 to 50 (1996) | Born 1946 to 1951 | 1.75% | 1.53% | 1.97% |
| Aged 47 to 52 (1998) | Born 1946 to 1951 | 0.75% | 0.60% | 0.91% |
| Aged 50 to 55 (2001) | Born 1946 to 1951 | 0.58% | 0.44% | 0.72% |
| Aged 53 to 58 (2004) | Born 1946 to 1951 | 0.44% | 0.32% | 0.56% |
| Aged 56 to 61 (2007) | Born 1946 to 1951 | 0.41% | 0.29% | 0.54% |
| Aged 59 to 64 (2010) | Born 1946 to 1951 | 0.35% | 0.23% | 0.47% |
| Aged 62 to 67 (2013) | Born 1946 to 1951 | 0.35% | 0.23% | 0.47% |
| Aged 65 to 70 (2016) | Born 1946 to 1951 | 0.34% | 0.21% | 0.46% |
| Aged 68 to 73 (2019) | Born 1946 to 1951 | 0.25% | 0.14% | 0.36% |
Priority populations
Sexual identification
Three in four (76%) women aged 24 to 30 who identified as bisexual reported that they had experienced sexual violence in their lifetime (Table 5). Around one in two women aged 24 to 30 who identified as mainly or exclusively heterosexual (48%) and those who identified as mainly or exclusively lesbian (55%) reported that they had experienced sexual violence in their lifetime.
Three in five (60%) women aged 40 to 45 who identified as bisexual reported that they had experienced sexual violence in their lifetime, however caution should be used in interpreting this result due to the low frequency of women who identified as bisexual in this age group. One in three (34%) women aged 40 to 45 who identified as mainly or exclusively heterosexual and two in five (42%) of those who identified as mainly or exclusively lesbian reported that they had experienced sexual violence in their lifetime.
One in four (26%) women aged 68 to 73 who identified as mainly or exclusively heterosexual and one in two (49%) of those who identified as mainly or exclusively lesbian reported that they had experienced sexual violence in their lifetime. Very few women in this age group identified as bisexual.
Cultural and linguistic diversity
There were few differences in the prevalence of sexual violence between women from CALD backgrounds and those who were not from CALD backgrounds (Table 5).[5]
Disability or illness
Three in four (73%) women aged 24 to 30 with disability or illness reported that they had experienced sexual violence, compared to one in two (51%) women without disability or illness (Table 5). Among women aged 40 to 45, 55 per cent of women with disability or illness reported that they had experienced sexual violence compared to 34 per cent of women without disability or illness. Among women aged 68 to 73, 34 per cent of those with disability or illness reported that they had experienced sexual violence compared to 26 per cent of women without disability or illness.
Area of residence
There were few differences in the prevalence of sexual violence by area of residence (major cities, inner regional areas and outer regional, remote or very remote areas; Table 5).
Table 5: Prevalence of any sexual violence among Australian women aged 24 to 30, 40 to 45 and 68 to 73 at most recent survey, by priority populations
Sexual identification
| Women born 1989 to 1995 N a | Women born 1989 to 1995 Count | Women born 1989 to 1995 % (95% CI) | |
|---|---|---|---|
| Exclusively/mainly heterosexual | 6,264 | 3,019 | 48.2 (46.4, 50.0) |
| Bisexual | 714 | 544 | 76.2 (72.6, 79.8) |
| Exclusively/mainly lesbian | 158 | 87 | 55.1 (44.6, 65.5) |
| Women born 1973 to 1978 N | Women born 1973 to 1978 Count | Women born 1973 to 1978 % (95% CI) | |
|---|---|---|---|
| Exclusively/mainly heterosexual | 6,689 | 2,265 | 33.9 (31.9, 35.8) |
| Bisexual | 53 | 32 | 60.4 (43.4, 77.3) |
| Exclusively/mainly lesbian | 102 | 43 | 42.2 (27.4, 56.9) |
| Women born 1946 to 1951 N | Women born 1946 to 1951 Count | Women born 1946 to 1951 % (95% CI) | |
|---|---|---|---|
| Exclusively/mainly heterosexual | 7,028 | 1,856 | 26.4 (24.4, 28.4) |
| Bisexual | 9 | 5 | 55.6 (12.0, 99.1) |
| Exclusively/mainly lesbian | 83 | 41 | 49.4 (34.1, 64.7) |
Cultural and linguistic diversity
| Women born 1989 to 1995 N | Women born 1989 to 1995 Count | Women born 1989 to 1995 % (95% CI) | |
|---|---|---|---|
| Culturally and linguistically diverse | 355 | 173 | 48.7 (41.3, 56.2) |
| Not culturally and linguistically diverse | 7,975 | 4,116 | 51.6 (50.1, 53.1) |
| Women born 1973 to 1978 N | Women born 1973 to 1978 Count | Women born 1973 to 1978 % (95% CI) | |
|---|---|---|---|
| Culturally and linguistically diverse | 518 | 153 | 29.5 (22.3, 36.8) |
| Not culturally and linguistically diverse | 6,590 | 2,263 | 34.3 (32.4, 36.3) |
| Women born 1946 to 1951 N | Women born 1946 to 1951 Count | Women born 1946 to 1951 % (95% CI) | |
|---|---|---|---|
| Culturally and linguistically diverse | 675 | 152 | 22.5 (15.9, 29.2) |
| Not culturally and linguistically diverse | 7,264 | 1,938 | 26.7 (24.7, 28.6) |
Disability or illness status
| Women born 1989 to 1995 N | Women born 1989 to 1995 Count | Women born 1989 to 1995 % (95% CI) | |
|---|---|---|---|
| Disability or illness | 216 | 157 | 72.7 (65.7, 79.7) |
| No disability or illness | 8,081 | 4,117 | 50.9 (49.4, 52.5) |
| Women born 1973 to 1978 N | Women born 1973 to 1978 Count | Women born 1973 to 1978 % (95% CI) | |
|---|---|---|---|
| Disability or illness | 162 | 89 | 54.9 (44.6, 65.3) |
| No disability or illness | 6,661 | 2,245 | 33.7 (31.7, 35.7) |
| Women born 1946 to 1951 N | Women born 1946 to 1951 Count | Women born 1946 to 1951 % (95% CI) | |
|---|---|---|---|
| Disability or illness | 338 | 114 | 33.7 (25.0, 42.4) |
| No disability or illness | 7,556 | 1,964 | 26.0 (24.1, 27.9) |
Area of residence
| Women born 1989 to 1995 N | Women born 1989 to 1995 Count | Women born 1989 to 1995 % (95% CI) | |
|---|---|---|---|
| Major cities | 6,033 | 3,079 | 51.0 (49.3, 52.8) |
| Inner regional | 1,362 | 710 | 52.1 (48.5, 55.8) |
| Outer regional, remote or very remote | 645 | 362 | 56.1 (51.0, 61.2) |
| Women born 1973 to 1978 N | Women born 1973 to 1978 Count | Women born 1973 to 1978 % (95% CI) | |
|---|---|---|---|
| Major cities | 3,877 | 1,271 | 32.8 (30.2, 35.4) |
| Inner regional | 1,870 | 684 | 36.6 (33.0, 40.2) |
| Outer regional, remote or very remote | 971 | 344 | 35.4 (30.4, 40.5) |
| Women born 1946 to 1951 N | Women born 1946 to 1951 Count | Women born 1946 to 1951 % (95% CI) | |
|---|---|---|---|
| Major cities | 3,118 | 791 | 25.4 (22.3, 28.4) |
| Inner regional | 3,254 | 880 | 27.0 (24.1, 30.0) |
| Outer regional, remote or very remote | 1,549 | 409 | 26.4 (22.1, 30.7) |
Notes: a N = number of women in total sample (i.e. denominator).
b Count = number of women reporting sexual violence (i.e. numerator).
Prevalence of sexual violence
Findings from the Australian Longitudinal Study on Women’s Health
Reported having experienced sexual violence in their lifetime
- 51% of women born 1989 to 1995 (aged 24 to 30 in 2019)
- 34% of women born 1973 to 1978 (aged 40 to 45 in 2018)
- 26% of women born 1946 to 1951 (aged 68 to 73 in 2019)
Reported having experienced sexual violence in childhood
- 12% of women born 1989 to 1995 (aged 24 to 30 in 2019)
- 15% of women born 1973 to 1978 (aged 40 to 45 in 2018)
- 14% of women born 1946 to 1951(aged 68 to 73 in 2019)
Reported having experienced sexual violence by a partner
- 33% of women born 1989 to 1995 (aged 24 to 30 in 2019)
- 14% of women born 1973 to 1978 (aged 40 to 45 in 2018)
Prevalence of sexual violence: Priority populations
Findings from the Australian Longitudinal Study on Women’s Health
Women who identified as bisexual or exclusively/mainly lesbian were more likely to have reported sexual violence than those who identified as exclusively/mainly heterosexual.
Women born 1989 to 1995 (aged 24 to 30 in 2019)
- 48% of women who identified as exclusively/mainly heterosexual.
- 55% of women who identified as exclusively/mainly lesbian.
- 76% of women who identified as exclusively/mainly bisexual.
Women born 1973 to 1978 (aged 40 to 45 in 2018)
- 34% of women who identified as exclusively/mainly heterosexual.
- 42% of women who identified as exclusively/mainly lesbian.
- 60% of women who identified as exclusively/mainly bisexual.
Women born 1946 to 1951 (aged 68 to 73 in 2019)
- 26% of women who identified as exclusively/mainly heterosexual.
- 49% of women who identified as exclusively/mainly lesbian.
Women who had disability or illness were more likely to have reported experiencing sexual violence than those who did not have disability or illness.
Women born 1989 to 1995 (aged 24 to 30 in 2019)
- 51% of women not living with disability or illness.
- 73% of women living with disability or illness.
Women born 1973 to 1978 (aged 40 to 45 in 2018)
- 34% of women not living with disability or illness.
- 55% of women living with disability or illness.
Women born 1946 to 1951 (aged 68 to 73 in 2019)
- 26% of women not living with disability or illness.
- 34% of women living with disability or illness.
There were very few differences in the prevalence of sexual violence between women who lived in:
- Major cities.
- Inner regional areas.
- Outer regional/remote/very remote areas.
Chapter 2: Sexual violence during childhood as a risk factor for further violence
Sexual violence during childhood as a risk factor for further violence
Women born in 1989 to 1995 and 1973 to 1978 were approximately 50 per cent more likely to have experienced recent violence if they had experienced sexual violence during childhood, compared to women who had not experienced sexual violence during childhood, after adjusting for confounding variables (Figure 10).
Figure 10: Effect estimates of sexual violence during childhood on risk of recent violence (sexual, domestic or physical)
Note: Longitudinal models in Figure 10 were controlled for CALD status, age, highest qualification, area of residence, relationship status and ability to manage on available income. Data from women born 1946 to 1951 were not analysed due to low frequencies.
Data table for figure 10:
| Risk ratio | Lower limit | Upper limit | |
|---|---|---|---|
| Born 1989 to 1995 | 1.55 | 1.44 | 1.67 |
| Born 1973 to 1978 | 1.47 | 1.35 | 1.60 |
Almost a quarter (23%) of women aged 24 to 30 in 2019 who had experienced sexual violence during childhood had also experienced recent violence (sexual, domestic or physical). In comparison, 15 per cent of women who had not experienced sexual violence during childhood had experienced recent violence. Among women aged 40 to 45 in 2018, almost one in five (19%) who had experienced sexual violence during childhood had also experienced recent violence (sexual, domestic or physical), compared to 13 per cent of women who had not experienced sexual violence during childhood.
Among women born in 1989 to 1995 and 1973 to 1978, experiences of recent violence mainly included domestic violence and physical violence. Sexual violence was less common. Among women aged 24 to 30 in 2019 who experienced recent violence, 70 per cent experienced recent domestic violence, 63 per cent experienced recent physical violence and 21 per cent experienced recent sexual violence. Among women aged 40 to 45 in 2018 who experienced recent violence, 85 per cent experienced recent domestic violence, 46 per cent experienced recent physical violence and 9 per cent experienced recent sexual violence.
Sexual violence during childhood as a risk factor for further sexual violence
Women who had experienced sexual violence during childhood were twice as likely to report recent sexual violence compared to women who had not experienced sexual violence during childhood, after adjusting for confounding variables (Figure 11).
Figure 11: Effect estimates of sexual violence during childhood on risk of recent sexual violence in adulthood
Note: Longitudinal models in Figure 11 were controlled for CALD status, age, highest qualification, area of residence, relationship status and ability to manage on available income. Data from women born 1946 to 1951 were not able to be analysed due to insufficient cell sizes.
Data table for Figure 11
| Risk ratio | Lower limit | Upper limit | |
|---|---|---|---|
| Born 1989 to 1995 | 1.99 | 1.75 | 2.26 |
| Born 1973 to 1978 | 2.01 | 1.66 | 2.43 |
Among women aged 24 to 30 in 2019, 6 per cent who had experienced sexual violence during childhood reported recent sexual violence compared to 3 per cent of women who had not experienced sexual violence during childhood.
Similarly, among women aged 40 to 45 in 2018, 2 per cent who had experienced sexual violence during childhood reported recent sexual violence compared to 1 per cent of women who had not experienced sexual violence during childhood.
Sexual violence during childhood as a risk factor for recent domestic violence
Women who had experienced sexual violence during childhood were 33 to 59 per cent more likely to report recent domestic violence than women who had not experienced sexual violence during childhood, after controlling for confounding variables (Figure 12).
Figure 12: Effect estimates of sexual violence during childhood on risk of recent domestic violence
Note: Longitudinal models in Figure 12 were controlled for CALD status, age, highest qualification, area of residence, relationship status and ability to manage on available income. Data from women born 1946 to 1951 were not able to be analysed as recent domestic violence was not measured in this cohort.
Data table for figure 12:
| Risk ratio | Lower limit | Upper limit | |
|---|---|---|---|
| Born 1989 to 1995 | 1.59 | 1.46 | 1.72 |
| Born 1973 to 1978 | 1.33 | 1.19 | 1.49 |
Among women aged 24 to 30 in 2019, 16 per cent who had experienced sexual violence during childhood reported recent domestic violence, compared to 10 per cent of women who had not experienced sexual violence during childhood. Women aged 24 to 30 who reported recent domestic violence were most likely to have reported emotional abuse (79%), followed by physical violence (44%), harassment (31%) and sexual violence (18%).
Similarly, 15 per cent of women aged 40 to 45 in 2018 who had experienced sexual violence during childhood reported recent domestic violence, compared to 11 per cent of those who had not experienced sexual violence during childhood.
Women aged 40 to 45 who reported recent domestic violence were most likely to have reported emotional abuse (91%), followed by physical violence (31%), harassment (25%) and sexual violence (6%).
Sexual violence during childhood as a risk factor for recent physical violence
Women born in 1989 to 1995 and 1973 to 1978 were approximately 60 per cent more likely to have reported recent physical violence if they had experienced sexual violence during childhood compared to women who had not experienced sexual violence during childhood, after adjusting for confounding variables (Figure 13).
Figure 13: Effect estimates of sexual violence during childhood on risk of recent physical violence
Note: Longitudinal models in Figure 13 were controlled for CALD status, age, highest qualification, area of residence, relationship status and ability to manage on available income. Data from women born 1946 to 1951 were not able to be analysed as recent physical violence by a partner was not measured and recent physical violence by an unspecified person had very low frequencies.
Data table for figure 13:
| Risk ratio | Lower limit | Upper limit | |
|---|---|---|---|
| Born 1989 to 1995 | 1.59 | 1.46 | 1.74 |
| Born 1973 to 1978 | 1.63 | 1.48 | 1.81 |
Approximately 16 per cent of women aged 24 to 30 in 2019 who experienced sexual violence during childhood reported recent physical violence, compared to 9 per cent of women who had not experienced sexual violence during childhood. Among women aged 40 to 45 in 2018, 10 per cent of women who experienced sexual violence during childhood reported recent physical violence compared to 5 per cent of women who had not experienced sexual violence during childhood.
Sexual violence in childhood as a risk factor for other violence
Findings from the Australian Longitudinal Study on Women’s Health
Women born 1989 to 1995 (aged 24 to 30 in 2019) and 1973 to 1978 (aged 40 to 45 in 2018) who had experienced sexual violence during childhood were 50% more likely to have reported recent violence* compared to those who had not experienced sexual violence during childhood.
Women who had experienced sexual violence during childhood were:
- 2x more likely to have reported recent sexual violence* compared to those who had not experienced sexual violence during childhood compared to those who had not experienced sexual violence during childhood.
- 33 to 59% more likely to have reported recent domestic violence* compared to those who had not experienced sexual violence during childhood.
Women born 1989 to 1995 (aged 24 to 30 in 2019) and 1973 to 1978 (aged 40 to 45 in 2018) who had experienced sexual violence during childhood were 60% more likely have reported recent physical violence* compared to those who had not experienced sexual violence during childhood.
* Risk ratios varied for women born 1989 to 1995, 1973 to 1978, and 1946 to 1951.
Chapter 3: Lifetime sexual violence and economic factors
Association between sexual violence and education
Women born in 1989 to 1995 and 1973 to 1978 were 46 to 63 per cent more likely to have not completed Year 12 if they had ever experienced sexual violence compared to those who had not experienced sexual violence (Figure 14). Women born in 1989 to 1995 were also 34 per cent less likely to have attained a qualification beyond Year 12 if they had ever experienced sexual violence compared to those who had not experienced sexual violence. However, women born in 1946 to 1951 who had experienced sexual violence were 33 per cent more likely to have attained a qualification beyond Year 12 than those who had not experienced sexual violence.
Figure 14: Effect estimates of any sexual violence on education
Note: Reference category is “Completed Year 12 only”. Cross-sectional models in Figure 14 were unadjusted. Caution must be used when interpreting effect estimates due to lack of information on when sexual violence occurred and when the decision not to attain higher qualifications occurred. These effects are complex and causation should not be inferred.
Data table for figure 14:
Born 1989 to 1995
| Risk ratio | Lower limit | Upper limit | |
|---|---|---|---|
| Less than Year 12 | 1.63 | 1.15 | 2.33 |
| More than Year 12 | 0.66 | 0.56 | 0.78 |
Born 1973 to 1978
| Risk ratio | Lower limit | Upper limit | |
|---|---|---|---|
| Less than Year 12 | 1.46 | 1.11 | 1.93 |
| More than Year 12 | 1.11 | 0.92 | 1.33 |
Born 1946 to 1951
| Risk ratio | Lower limit | Upper limit | |
|---|---|---|---|
| Less than Year 12 | 0.93 | 0.80 | 1.08 |
| More than Year 12 | 1.33 | 1.16 | 1.54 |
Among women aged 24 to 30 in 2019 to 2020, 3 per cent had not completed Year 12, 9 per cent had completed Year 12 only and 84 per cent had attained qualifications beyond Year 12. Similarly, among women aged 40 to 45 in 2018, 6 per cent had not completed Year 12, 8 per cent had completed Year 12 only and 81 per cent had attained qualifications beyond Year 12. In contrast, among women aged 68 to 73 in 2019, 32 per cent had not completed Year 12, 17 per cent had completed Year 12 only and 45 per cent had attained qualifications beyond Year 12.
Association between sexual violence and full-time employment
Women born 1989 to 1995 were 7 per cent less likely to be in full-time employment if they had experienced sexual violence, compared to those who had not experienced sexual violence (Figure 15). Conversely, women born 1946 to 1951 were 8 per cent more likely to be in full-time employment if they had experienced sexual violence compared to women who had not experienced sexual violence. There was no evidence for an effect among women born 1973 to 1978.
Figure 15: Effect estimates of any sexual violence on full-time employment
Note: Longitudinal models in Figure 15 were controlled for CALD status, age, highest qualification, area of residence and relationship status.
Data table for figure 15:
| Risk ratio | Lower limit | Upper limit | |
|---|---|---|---|
| Born 1989 to 1995 | 0.93 | 0.89 | 0.96 |
| Born 1973 to 1978 | 1.02 | 0.98 | 1.05 |
| Born 1946 to 1951 | 1.08 | 1.03 | 1.14 |
Overall, the prevalence of full-time employment increased over time among women born in 1989 to 1995 (Figure 16). Women who had experienced sexual violence had lower prevalence of full-time employment than those who had not experienced sexual violence and this discrepancy increased over time.
Figure 16: Prevalence of full-time employment among women born in 1989 to 1995, according to whether sexual violence had been experienced
Note: Employment was not measured among women born 1989 to 1995 in 2013.
Data table for figure 16:
| Age and year | Experience with sexual violence | Prevalence | Lower bound | Upper bound |
|---|---|---|---|---|
| Aged 18 to 24 2013 | Never experienced sexual violence | No data | No data | No data |
| Aged 19 to 25 2014 | Never experienced sexual violence | 28% | 27% | 29% |
| Aged 20 to 26 2015 | Never experienced sexual violence | 35% | 34% | 36% |
| Aged 21 to 27 2016 | Never experienced sexual violence | 46% | 45% | 47% |
| Aged 22 to 28 2017 | Never experienced sexual violence | 54% | 53% | 55% |
| Aged 24 to 30 2019 | Never experienced sexual violence | 62% | 61% | 64% |
| Aged 18 to 24 2013 | Experienced sexual violence | No data | No data | No data |
| Aged 19 to 25 2014 | Experienced sexual violence | 26% | 25% | 28% |
| Aged 20 to 26 2015 | Experienced sexual violence | 32% | 30% | 34% |
| Aged 21 to 27 2016 | Experienced sexual violence | 39% | 37% | 41% |
| Aged 22 to 28 2017 | Experienced sexual violence | 45% | 43% | 47% |
| Aged 24 to 30 2019 | Experienced sexual violence | 54% | 52% | 55% |
The prevalence of full-time employment among women born in 1973 to 1978 gradually decreased from age 22 to 27 until age 34 to 39 and then increased again as women entered their 40s (Figure 17). The full-time employment trend was similar for women who had and had not experienced sexual violence.
Figure 17: Prevalence of full-time employment among women born in 1973 to 1978, according to whether they experienced sexual violence
Note: Employment was not measured among women born 1973 to 1978 in 1996.
Data table for figure 17:
| Age and year | Experience with sexual violence | Prevalence | Lower bound | Upper bound |
|---|---|---|---|---|
| Aged 18 to 23 1996 | Never experienced sexual violence | No data | No data | No data |
| Aged 22 to 27 2000 | Never experienced sexual violence | 70% | 69% | 71% |
| Aged 25 to 30 2003 | Never experienced sexual violence | 56% | 55% | 57% |
| Aged 28 to 33 2006 | Never experienced sexual violence | 51% | 50% | 53% |
| Aged 31 to 36 2009 | Never experienced sexual violence | 43% | 41% | 44% |
| Aged 34 to 39 2012 | Never experienced sexual violence | 40% | 38% | 41% |
| Aged 37 to 42 2015 | Never experienced sexual violence | 45% | 44% | 47% |
| Aged 40 to 45 2018 | Never experienced sexual violence | 55% | 53% | 56% |
| Aged 18 to 23 1996 | Experienced sexual violence | No data | No data | No data |
| Aged 22 to 27 2000 | Experienced sexual violence | 66% | 63% | 69% |
| Aged 25 to 30 2003 | Experienced sexual violence | 54% | 52% | 57% |
| Aged 28 to 33 2006 | Experienced sexual violence | 51% | 48% | 53% |
| Aged 31 to 36 2009 | Experienced sexual violence | 45% | 43% | 47% |
| Aged 34 to 39 2012 | Experienced sexual violence | 43% | 40% | 45% |
| Aged 37 to 42 2015 | Experienced sexual violence | 49% | 47% | 51% |
| Aged 40 to 45 2018 | Experienced sexual violence | 56% | 54% | 58% |
Overall, the prevalence of full-time employment among women born in 1946 to 1951 decreased after 2004, when the women were aged 53 to 58 (Figure 18). Women who had experienced sexual violence had slightly higher prevalence of full-time employment than those who had not experienced sexual violence.
Figure 18: Prevalence of full-time employment among women born in 1946 to 1951, according to whether sexual violence had been experienced
Note: Employment was not measured among women born 1946 to 1951 in 1996.
Data table for figure 18:
| Age and year | Experience with sexual violence | Prevalence | Lower bound | Upper bound |
|---|---|---|---|---|
| Aged 45 to 50 1996 | Never experienced sexual violence | No data | No data | No data |
| Aged 47 to 52 1998 | Never experienced sexual violence | 40% | 39% | 41% |
| Aged 50 to 55 2001 | Never experienced sexual violence | 41% | 40% | 42% |
| Aged 53 to 58 2004 | Never experienced sexual violence | 35% | 34% | 36% |
| Aged 56 to 61 2007 | Never experienced sexual violence | 31% | 30% | 32% |
| Aged 59 to 64 2010 | Never experienced sexual violence | 23% | 22% | 24% |
| Aged 62 to 67 2013 | Never experienced sexual violence | 15% | 14% | 15% |
| Aged 65 to 70 2016 | Never experienced sexual violence | 8% | 7% | 8% |
| Aged 68 to 73 2019 | Never experienced sexual violence | 4% | 4% | 5% |
| Aged 45 to 50 1996 | Experienced sexual violence | No data | No data | No data |
| Aged 47 to 52 1998 | Experienced sexual violence | 44% | 41% | 47% |
| Aged 50 to 55 2001 | Experienced sexual violence | 43% | 40% | 45% |
| Aged 53 to 58 2004 | Experienced sexual violence | 36% | 34% | 39% |
| Aged 56 to 61 2007 | Experienced sexual violence | 34% | 31% | 36% |
| Aged 59 to 64 2010 | Experienced sexual violence | 27% | 25% | 29% |
| Aged 62 to 67 2013 | Experienced sexual violence | 18% | 16% | 19% |
| Aged 65 to 70 2016 | Experienced sexual violence | 9% | 8% | 10% |
| Aged 68 to 73 2019 | Experienced sexual violence | 5% | 4% | 6% |
Association between sexual violence and financial stress
Women born in 1989 to 1995, 1973 to 1978 and 1946 to 1951 who had experienced sexual violence were approximately 40 per cent more likely to report high financial stress compared to those who had not experienced sexual violence (Figure 19).
Figure 19: Effect estimates of any sexual violence on high financial stress
Note: Longitudinal models in Figure 19 were controlled for CALD status, age, highest qualification, area of residence and relationship status.
Data table for figure 19:
| Risk ratio | Lower limit | Upper limit | |
|---|---|---|---|
| Born 1989 to 1995 | 1.43 | 1.37 | 1.49 |
| Born 1973 to 1978 | 1.30 | 1.23 | 1.37 |
| Born 1946 to 1951 | 1.45 | 1.33 | 1.59 |
There was a gradual decrease over time in the prevalence of high financial stress among women born 1989 to 1995 (Figure 20), 1973 to 1978 (Figure 21) and 1946 to 1951 (Figure 22). Among all three cohorts of women, high financial stress was more prevalent over time among women who had experienced sexual violence than those who had not experienced sexual violence.
Figure 20: Prevalence of high financial stress among women born in 1989 to 1995, according to whether sexual violence had been experienced
Note: Financial stress was not measured among women born 1989 to 1995 in 2013.
Data table for figure 20:
| Age and year | Experience with sexual violence | Prevalence | Lower bound | Upper bound |
|---|---|---|---|---|
| Aged 18 to 24 2013 | Never experienced sexual violence | No data | No data | No data |
| Aged 19 to 25 2014 | Never experienced sexual violence | 35% | 34% | 36% |
| Aged 20 to 26 2015 | Never experienced sexual violence | 25% | 24% | 26% |
| Aged 21 to 27 2016 | Never experienced sexual violence | 26% | 24% | 27% |
| Aged 22 to 28 2017 | Never experienced sexual violence | 23% | 22% | 24% |
| Aged 24 to 30 2019 | Never experienced sexual violence | 20% | 19% | 21% |
| Aged 18 to 24 2013 | Experienced sexual violence | No data | No data | No data |
| Aged 19 to 25 2014 | Experienced sexual violence | 52% | 51% | 54% |
| Aged 20 to 26 2015 | Experienced sexual violence | 44% | 42% | 45% |
| Aged 21 to 27 2016 | Experienced sexual violence | 41% | 39% | 42% |
| Aged 22 to 28 2017 | Experienced sexual violence | 37% | 35% | 38% |
| Aged 24 to 30 2019 | Experienced sexual violence | 34% | 33% | 36% |
Figure 21: Prevalence of high financial stress among women born in 1973 to 1978, according to whether sexual violence had been experienced
Note: Financial stress was not measured among women born 1973 to 1978 in 1996.
Data table for figure 21:
| Age and year | Experience with sexual violence | Prevalence | Lower bound | Upper bound |
|---|---|---|---|---|
| Aged 18 to 23 1996 | Never experienced sexual violence | No data | No data | No data |
| Aged 22 to 27 2000 | Never experienced sexual violence | 25% | 24% | 26% |
| Aged 25 to 30 2003 | Never experienced sexual violence | 22% | 22% | 23% |
| Aged 28 to 33 2006 | Never experienced sexual violence | 20% | 19% | 21% |
| Aged 31 to 36 2009 | Never experienced sexual violence | 16% | 15% | 17% |
| Aged 34 to 39 2012 | Never experienced sexual violence | 15% | 14% | 15% |
| Aged 37 to 42 2015 | Never experienced sexual violence | 14% | 13% | 15% |
| Aged 40 to 45 2018 | Never experienced sexual violence | 14% | 13% | 15% |
| Aged 18 to 23 1996 | Experienced sexual violence | No data | No data | No data |
| Aged 22 to 27 2000 | Experienced sexual violence | 31% | 28% | 34% |
| Aged 25 to 30 2003 | Experienced sexual violence | 32% | 30% | 34% |
| Aged 28 to 33 2006 | Experienced sexual violence | 30% | 28% | 32% |
| Aged 31 to 36 2009 | Experienced sexual violence | 27% | 25% | 29% |
| Aged 34 to 39 2012 | Experienced sexual violence | 24% | 22% | 26% |
| Aged 37 to 42 2015 | Experienced sexual violence | 23% | 22% | 25% |
| Aged 40 to 45 2018 | Experienced sexual violence | 24% | 22% | 26% |
Figure 22: Prevalence of high financial stress among women born in 1946 to 1951, according to whether sexual violence had been experienced
Note: Financial stress was not measured among women born 1946 to 1951 in 1996, 2001 and 2004.
Data table for figure 22:
| Age and year | Experience with sexual violence | Prevalence | Lower bound | Upper bound |
|---|---|---|---|---|
| Aged 45 to 50 1996 | Never experienced sexual violence | No data | No data | No data |
| Aged 47 to 52 1998 | Never experienced sexual violence | 11% | 11% | 12% |
| Aged 50 to 55 2001 | Never experienced sexual violence | No data | No data | No data |
| Aged 53 to 58 2004 | Never experienced sexual violence | No data | No data | No data |
| Aged 56 to 61 2007 | Never experienced sexual violence | 7% | 6% | 7% |
| Aged 59 to 64 2010 | Never experienced sexual violence | 6% | 6% | 7% |
| Aged 62 to 67 2013 | Never experienced sexual violence | 7% | 6% | 8% |
| Aged 65 to 70 2016 | Never experienced sexual violence | 6% | 5% | 6% |
| Aged 68 to 73 2019 | Never experienced sexual violence | 4% | 3% | 4% |
| Aged 45 to 50 1996 | Experienced sexual violence | No data | No data | No data |
| Aged 47 to 52 1998 | Experienced sexual violence | 18% | 16% | 20% |
| Aged 50 to 55 2001 | Experienced sexual violence | No data | No data | No data |
| Aged 53 to 58 2004 | Experienced sexual violence | No data | No data | No data |
| Aged 56 to 61 2007 | Experienced sexual violence | 13% | 11% | 14% |
| Aged 59 to 64 2010 | Experienced sexual violence | 12% | 10% | 13% |
| Aged 62 to 67 2013 | Experienced sexual violence | 12% | 10% | 13% |
| Aged 65 to 70 2016 | Experienced sexual violence | 11% | 10% | 13% |
| Aged 68 to 73 2019 | Experienced sexual violence | 7% | 6% | 8% |
Lifetime sexual violence and economic factors
Findings from the Australian Longitudinal Study on Women’s Health
Women who had experienced sexual violence were
more likely to have not completed year 12
than those who had not experienced sexual violence.
Women born 1989 to 1995 (aged 24 to 30 in 2019) who had experienced sexual violence were 63% more likely to have not completed year 12 than those who had not experienced sexual violence.
Women born 1973 to 1978 (aged 40 to 45 in 2018) who had experienced sexual violence were 46% more likely to have not completed year 12 than those who had not experienced sexual violence.
Experiences of sexual violence were associated with obtaining education beyond year 12,
however, this relationship differed by age group:
- Women born 1989 to 1995 (aged 24 to 30 in 2019) who had experienced sexual violence were 34% less likely to have obtained a qualification beyond Year 12 than those who had not experienced sexual violence.
- Women born 1946 to 1951 (aged 68 to 73 in 2019) who had experienced sexual violence were 33% more likely to have obtained a qualification beyond Year 12 than those who had not experienced sexual violence.
Across all cohorts, women who had experienced sexual violence were 30 to 45% more likely to report high financial stress* compared to those who had not experienced sexual violence.
* Risk ratios varied for women born 1989 to 1995, 1973 to 1978, and 1946 to 1951.
Chapter 4: Sexual violence and health behaviours
Sexual violence and smoking
The prevalence of current smokers among women aged 24 to 30, 40 to 45 and 68 to 73 was 13 per cent, 10 per cent and 4 per cent respectively. Women born in 1989 to 1995 and 1973 to 1978 who had experienced sexual violence were 60 per cent and 26 per cent more likely to be current smokers, respectively, compared to women who had not experienced sexual violence (Figure 23). There was little evidence of an association between sexual violence and current smoking among women born 1946 to 1951.
Figure 23: Effect estimates for association between sexual violence and current smoking
Note: Longitudinal models in Figure 23 were controlled for CALD status, age, highest qualification, area of residence, relationship status and the ability to manage on available income.
Data table for figure 23:
| Risk ratio | Lower limit | Upper limit | |
|---|---|---|---|
| Born 1989 to 1995 | 1.60 | 1.52 | 1.66 |
| Born 1973 to 1978 | 1.26 | 1.18 | 1.32 |
| Born 1946 to 1951 | 1.07 | 0.97 | 1.14 |
Sexual violence and alcohol consumption
The prevalence of high-risk alcohol consumption among women aged 24 to 30, 40 to 45 and 68 to 73 was 3 per cent, 7 per cent and 4 per cent, respectively. Women were 16 to 73 per cent more likely to engage in high-risk alcohol consumption if they had experienced sexual violence compared to women who had not experienced sexual violence (Figure 24).
Figure 24: Effect estimates for association between sexual violence and high-risk alcohol consumption
Note: Longitudinal models in Figure 24 were controlled for CALD status, age, highest qualification, area of residence, relationship status and the ability to manage on available income.
Data table for figure 24:
| Risk ratio | Lower limit | Upper limit | |
|---|---|---|---|
| Born 1989 to 1995 | 1.73 | 1.50 | 1.98 |
| Born 1973 to 1978 | 1.38 | 1.21 | 1.54 |
| Born 1946 to 1951 | 1.16 | 1.05 | 1.34 |
Sexual violence and illicit drug use
The prevalence of illicit drug use in the last 12 months among women aged 24 to 30 and 40 to 45 was 34 per cent and 8 per cent, respectively. Women born 1989 to 1995 and 1973 to 1978 who had experienced sexual violence were approximately 30 per cent more likely to have recently used illicit drugs than women who had not experienced sexual violence (Figure 25).
Figure 25: Effect estimates for association between sexual violence and recent illicit drug use
Note: Longitudinal models in Figure 25 were controlled for CALD status, age, highest qualification, area of residence, relationship status and the ability to manage on available income.
Data table for figure 25:
| Risk ratio | Lower limit | Upper limit | |
|---|---|---|---|
| Born 1989 to 1995 | 1.31 | 1.27 | 1.35 |
| Born 1973 to 1978 | 1.33 | 1.24 | 1.42 |
Sexual violence and physical activity
The prevalence of high levels of physical activity among women aged 24 to 30, 40 to 45 and 68 to 73 was 64 per cent, 50 per cent and 55 per cent, respectively. Women born in 1989 to 1995 and 1973 to 1978 were approximately 3 per cent less likely to report high levels of physical activity if they had experienced sexual violence compared to women who had not experienced sexual violence (Figure 26). There was no evidence of an association between experiencing sexual violence and physical activity among women born 1946 to 1951.
Figure 26: Effect estimates for association between sexual violence and high levels of physical activity
Note: Longitudinal models in Figure 26 were controlled for CALD status, age, highest qualification, area of residence, relationship status and the ability to manage on available income.
Data table for figure 26:
| Risk ratio | Lower limit | Upper limit | |
|---|---|---|---|
| Born 1989 to 1995 | 0.96 | 0.95 | 0.97 |
| Born 1973 to 1978 | 0.97 | 0.95 | 0.99 |
| Born 1946 to 1951 | 1.00 | 0.98 | 1.02 |
Sexual violence and obesity
In each cohort, around one in four women were obese (BMI ≥30 kg/m 2), with 21 per cent of women aged 24 to 30, 29 per cent of women aged 40 to 45 and 25 per cent of women aged 68 to 73 classified as obese. Women born 1989 to 1995 and 1973 to 1978 were approximately 15 per cent more likely to be obese if they had experienced sexual violence compared to those who had not experienced sexual violence (Figure 27).
Figure 27: Effect estimates of the association between experiencing sexual violence and obesity
Note: Longitudinal models in Figure 27 were controlled for CALD status, age, highest qualification, area of residence, relationship status and ability to manage on available income.
Data table for figure 27:
| Risk ratio | Lower limit | Upper limit | |
|---|---|---|---|
| Born 1989 to 1995 | 1.15 | 1.09 | 1.21 |
| Born 1973 to 1978 | 1.13 | 1.07 | 1.19 |
| Born 1946 to 1951 | 1.06 | 1.01 | 1.11 |
Sexual violence and health screening
Cervical cancer screening
Women aged 40 to 45 were the most likely to have had cervical screening in the previous two years (68%), followed by women aged 24 to 30 (57%) and those aged 68 to 73 (43%).
Women born in 1989 to 1995 who had experienced sexual violence were slightly more likely to have had a cervical cancer screening test in the last two years than those who had not experienced sexual violence (Figure 28). Conversely, women born 1946 to 1951 were slightly less likely to have had cervical cancer screening in the previous two years if they had experienced sexual violence compared to those who had not experienced sexual violence. There was no evidence of an effect among women born 1973 to 1978.
Figure 28: Effect estimates of the association between experiencing sexual violence and adherence to cervical cancer screening guidelines
Note: Longitudinal models in Figure 28 were controlled for CALD status, age, highest qualification, area of residence, relationship status and ability to manage on available income. Similar results were obtained when women who reported having had a hysterectomy were excluded from the cervical cancer screening models.
Data table for figure 28:
| Risk ratio | Lower limit | Upper limit | |
|---|---|---|---|
| Born 1989 to 1995 | 1.06 | 1.02 | 1.10 |
| Born 1973 to 1978 | 0.99 | 0.98 | 1.01 |
| Born 1946 to 1951 | 0.95 | 0.93 | 0.98 |
Breast cancer screening
Four in five (80%) women aged 68 to 73 reported having had a mammogram in the previous two years. Women born 1946 to 1951 were slightly less likely to have had a mammogram in the last two years if they had experienced sexual violence compared to women who had not experienced sexual violence (risk ratio=0.98, 95% CI=0.96, 1.00).
Sexual violence and health behaviours
Findings from the Australian Longitudinal Study on Women’s Health
Women born 1989 to 1995 (aged 24 to 30 in 2019), 1973 to 1978 (aged 40 to 45 in 2018), and 1946 to 1951 (aged 68 to 73 in 2019) who had experienced sexual violence were
16 to 73% more likely to engage in high-risk alcohol consumption*
compared to those who had not experienced sexual violence.
Women born 1989 to 1995 (aged 24 to 30 in 2019) and 1973 to 1978 (aged 40 to 45 in 2018)
who had experienced sexual violence were:
- 26 to 60% more likely to be current smokers.
- 30% more likely to have recently used illicit drugs*.
- 3% less likely to report high levels of physical activity*.
- 15% more likely to be obese (BMI≥30 kg/m2)*.
compared to those who had not experienced sexual violence.
* Risk ratios varied for women born 1989 to 1995, 1973 to 1978, and 1946 to 1951.
Chapter 5: Sexual violence and health
Sexual violence and general health
Around three in 20 women across all three cohorts reported fair or poor health, with 15 per cent of women aged 24 to 30, 11 per cent of women aged 40 to 45 and 15 per cent of women aged 68 to 73 reporting fair or poor health. Women who had experienced sexual violence were more likely to report fair or poor health compared to those who had not experienced sexual violence (Figure 29). Women were between 18 and 47 per cent more likely to report fair or poor health if they had experienced sexual violence, compared to women who had not experienced sexual violence.
Figure 29: Effect estimates of the association between sexual violence and fair or poor general health
Note: Longitudinal models in Figure 29 were controlled for CALD status, age, highest qualification, area of residence, relationship status and ability to manage on available income.
Data table for figure 29:
| Risk ratio | Lower limit | Upper limit | |
|---|---|---|---|
| Born 1989 to 1995 | 1.47 | 1.39 | 1.55 |
| Born 1973 to 1978 | 1.45 | 1.35 | 1.55 |
| Born 1946 to 1951 | 1.18 | 1.11 | 1.26 |
Women who had experienced sexual violence were more likely to have two or more physical conditions, such as diabetes, reproductive health conditions, asthma and heart disease. Among women aged 24 to 30, 13 per cent who had experienced sexual violence reported two or more physical conditions, compared to 8 per cent of women who had not experienced sexual violence. Among women aged 40 to 45 and 68 to 73, these values were 5 and 2 per cent and 22 and 13 per cent, respectively. Details on the physical conditions measured are included in the “Methods” section.
Sexual violence and bodily pain
Around one in 10 women reported high levels of bodily pain, with 7 per cent of women aged 21 to 27 and 40 to 45 and 12 per cent of women aged 68 to 73 reporting high levels of bodily pain. Women were between 23 and 67 per cent more likely to report high levels of bodily pain if they had experienced sexual violence compared to those who had not experienced sexual violence (Figure 30).
Figure 30: Effect estimates of the association between sexual violence and high levels of bodily pain
Note: Models in Figure 30 were controlled for CALD status, age, highest qualification, area of residence, relationship status and ability to manage on available income.
Data table for figure 30:
| Risk ratio | Lower limit | Upper limit | |
|---|---|---|---|
| Born 1989 to 1995 | 1.67 | 1.42 | 1.97 |
| Born 1973 to 1978 | 1.49 | 1.36 | 1.62 |
| Born 1946 to 1951 | 1.23 | 1.15 | 1.32 |
Sexual violence and sexually transmitted infections
Less than 1 per cent of women aged 24 to 30, 40 to 45 and 68 to 73, respectively, reported a recent STI. Women were 42 to 84 per cent more likely to report a recent STI if they had experienced sexual violence compared to those who had not experienced sexual violence (Figure 31).
Figure 31: Effect estimates of the association between sexual violence and a recent STI
Note: Longitudinal models in Figure 31 were controlled for CALD status, age, highest qualification, area of residence, relationship status and ability to manage on available income. Due to the low frequencies of a recent STI, there is substantial uncertainty around these effect estimates.
Data table for figure 31:
| Risk ratio | Lower limit | Upper limit | |
|---|---|---|---|
| Born 1989 to 1995 | 1.84 | 1.26 | 2.68 |
| Born 1973 to 1978 | 1.42 | 1.13 | 1.78 |
| Born 1946 to 1951 | 1.76 | 1.32 | 2.35 |
Sexual violence and depression
Recent diagnosis of and/or treatment for depression was more common in younger women than older women, with 27 per cent of women aged 24 to 30, 16 per cent of women aged 40 to 45 and 10 per cent of women aged 68 to 73 reporting a recent diagnosis of and/or treatment for depression. Women were 39 to 62 per cent more likely to report a recent diagnosis of and/or treatment for depression if they had experienced sexual violence compared to those who had not experienced sexual violence (Figure 32).
Figure 32: Effect estimates of the association between sexual violence and depression
Note: Longitudinal models in Figure 32 were controlled for CALD status, age, highest qualification, area of residence, relationship status and ability to manage on available income.
Data table for figure 32:
| Risk ratio | Lower limit | Upper limit | |
|---|---|---|---|
| Born 1989 to 1995 | 1.62 | 1.53 | 1.73 |
| Born 1973 to 1978 | 1.39 | 1.30 | 1.48 |
| Born 1946 to 1951 | 1.45 | 1.34 | 1.56 |
Sexual violence and anxiety
Younger women were more likely to report a recent diagnosis of and/or treatment for anxiety than older women, with 31 per cent of women aged 24 to 30, 13 per cent of women aged 40 to 45 and 10 per cent of women aged 68 to 73 reporting a recent diagnosis and/or treatment. Women were approximately 50 per cent more likely to report a recent diagnosis of and/or treatment for anxiety if they had experienced sexual violence compared to those who had not experienced sexual violence (Figure 33).
Figure 33: Effect estimates of the association between sexual violence and anxiety
Note: Longitudinal models in Figure 33 were controlled for CALD status, age, highest qualification, area of residence, relationship status and ability to manage on available income.
Data table for figure 33:
| Risk ratio | Lower limit | Upper limit | |
|---|---|---|---|
| Born 1989 to 1995 | 1.49 | 1.40 | 1.57 |
| Born 1973 to 1978 | 1.50 | 1.38 | 1.62 |
| Born 1946 to 1951 | 1.45 | 1.33 | 1.58 |
Sexual violence and stress
Younger women were more likely than older women to report high levels of stress, with 41 per cent of women aged 24 to 30, 30 per cent of women aged 40 to 45 and 6 per cent of women aged 68 to 73 reporting high levels of stress. Women were 29 to 51 per cent more likely to report high levels of stress if they had experienced sexual violence compared to those who had not experienced sexual violence (Figure 34).
Figure 34: Effect estimates of the association between sexual violence and high levels of stress
Note: Longitudinal models in Figure 34 were controlled for CALD status, age, highest qualification, area of residence, relationship status and ability to manage on available income.
Data table for figure 34:
| Risk ratio | Lower limit | Upper limit | |
|---|---|---|---|
| Born 1989 to 1995 | 1.30 | 1.27 | 1.34 |
| Born 1973 to 1978 | 1.29 | 1.24 | 1.34 |
| Born 1946 to 1951 | 1.51 | 1.42 | 1.60 |
Sexual violence and psychological distress
In 2019 to 2020, 41 per cent of women aged 24 to 30 reported high levels of psychological distress. Women born 1989 to 1995 who had had experienced sexual violence were 34 per cent more likely to report high levels of psychological distress compared to those who had not experienced sexual violence (95% CI=1.31, 1.38). This longitudinal model was controlled for CALD status, age, highest qualification, area of residence, relationship status and ability to manage on available income. Psychological distress was only measured among women born 1989 to 1995.
Sexual violence and health
Findings from the Australian Longitudinal Study on Women’s Health
Compared to those who had not experienced sexual violence,
women who had experienced sexual violence were:
- 18 to 47% more likely to report fair or poor health*.
- 23 to 67% more likely to report high levels of bodily pain*.
- 42 to 84% more likely to report a recent sexually transmitted infection*.
Compared to those who had not experienced sexual violence,
women who had experienced sexual violence were:
- 39 to 62% more likely to report a recent diagnosis of and/or treatment for depression*.
- ~50% more likely to report a recent diagnosis of and/or treatment for anxiety*.
- 29 to 51% more likely to report high levels of stress*.
Compared to those who had not experienced sexual violence,
women born 1989 to 1995 who had experienced sexual violence were
34% more likely to report high levels of psychological distress**.
* Risk ratios varied for women born 1989 to 1995, 1973 to 1978, and 1946 to 1951.
** Psychological distress was only measured in the 1989 to 1995 cohort.
Chapter 6: Sexual violence and health services
Use of health services was captured through data linkage with the MBS and the PBS. More than 99 per cent of women claimed at least one service through MBS each year, with many women (more than 90%) having at least one non-referred consultation, such as a consultation with a general practitioner or registered doctor. Similarly, many women claimed prescriptions each year, with over 35 per cent of younger women and over 70 per cent of older women claiming at least one government-subsidised PBS medication script annually.
All costs in Chapter 6 are government-subsidised costs and do not include out-of-pocket costs. Medicare services and PBS medication scripts that did not attract a government subsidy were excluded from analysis. All average costs presented in Chapter 6 are marginal predicted means from generalised estimating equations that account for within-subject correlation.
Sexual violence and cost of services subsidised by Medicare
The predicted average annual costs for women born in 1989 to 1995 who had experienced sexual violence were between $200 (2013 to 2014 financial year) and $268 (2018 to 2019 financial year) higher than the predicted average annual costs for those who had not experienced sexual violence (Figure 35).
Among women born in 1973 to 1978, the predicted average annual costs in the 1999 to 2000 financial year were $32 higher for those who had experienced sexual violence compared to those who had not. From 2012 onwards, the difference was more apparent, with predicted average annual costs for women who had experienced sexual violence between $82 (2011 to 2012 financial year) and $85 (2017 to 2018 financial year) higher than for those who had not experienced sexual violence.
There were no meaningful differences in predicted average annual costs over time among women born in 1946 to 1951 between those who had and had not experienced sexual violence.
Figure 35: Predicted average annual cost of Medicare services for women born in 1989 to 1995, 1973 to 1978 and 1946 to 1951, according to whether sexual violence had been experienced
Data table tables for figure 35:
Born 1989 to 1995
| Year | Experience with sexual violence | Bound | Lower limit | Upper limit |
|---|---|---|---|---|
| 2014 | Never experienced sexual violence | $722.22 | $706.10 | $738.35 |
| 2015 | Never experienced sexual violence | $744.58 | $726.37 | $762.78 |
| 2016 | Never experienced sexual violence | $787.29 | $767.87 | $806.72 |
| 2017 | Never experienced sexual violence | $822.79 | $801.93 | $843.65 |
| 2019 | Never experienced sexual violence | $969.25 | $943.68 | $994.83 |
| 2014 | Experienced sexual violence | $922.38 | $897.23 | $947.53 |
| 2015 | Experienced sexual violence | $950.93 | $924.82 | $977.04 |
| 2016 | Experienced sexual violence | $1005.49 | $978.08 | $1032.89 |
| 2017 | Experienced sexual violence | $1050.81 | $1022.12 | $1079.51 |
| 2019 | Experienced sexual violence | $1237.87 | $1204.46 | $1271.28 |
Born 1973 to 1978
| Year | Experience with sexual violence | Bound | Lower limit | Upper limit |
|---|---|---|---|---|
| 2000 | Never experienced sexual violence | $365.47 | $356.13 | $374.80 |
| 2003 | Never experienced sexual violence | $452.28 | $440.26 | $464.31 |
| 2006 | Never experienced sexual violence | $696.43 | $677.73 | $715.13 |
| 2009 | Never experienced sexual violence | $979.85 | $952.14 | $1007.56 |
| 2012 | Never experienced sexual violence | $952.33 | $924.88 | $979.77 |
| 2015 | Never experienced sexual violence | $982.60 | $952.84 | $1012.35 |
| 2018 | Never experienced sexual violence | $986.29 | $956.24 | $1016.33 |
| 2000 | Experienced sexual violence | $397.18 | $382.13 | $412.23 |
| 2003 | Experienced sexual violence | $491.53 | $473.22 | $509.83 |
| 2006 | Experienced sexual violence | $756.86 | $729.26 | $784.46 |
| 2009 | Experienced sexual violence | $1064.88 | $1025.69 | $1104.07 |
| 2012 | Experienced sexual violence | $1034.97 | $997.37 | $1072.56 |
| 2015 | Experienced sexual violence | $1067.86 | $1028.87 | $1106.86 |
| 2018 | Experienced sexual violence | $1071.87 | $1033.07 | $1110.68 |
Born 1946 to 1951
| Year | Experience with sexual violence | Bound | Lower limit | Upper limit |
|---|---|---|---|---|
| 1998 | Never experienced sexual violence | $436.27 | $427.0116 | $445.5224 |
| 2001 | Never experienced sexual violence | $532.27 | $520.4818 | $544.0654 |
| 2004 | Never experienced sexual violence | $627.21 | $613.1706 | $641.2495 |
| 2007 | Never experienced sexual violence | $832.44 | $813.622 | $851.2532 |
| 2010 | Never experienced sexual violence | $1079.98 | $1055.08 | $1104.89 |
| 2013 | Never experienced sexual violence | $1369.16 | $1336.67 | $1401.65 |
| 2016 | Never experienced sexual violence | $1688.04 | $1646.89 | $1729.19 |
| 2019 | Never experienced sexual violence | $2150.74 | $2096.49 | $2205.00 |
| 1998 | Experienced sexual violence | $451.44 | $436.14 | $466.75 |
| 2001 | Experienced sexual violence | $550.79 | $532.32 | $569.26 |
| 2004 | Experienced sexual violence | $649.03 | $627.50 | $670.56 |
| 2007 | Experienced sexual violence | $861.40 | $832.99 | $889.80 |
| 2010 | Experienced sexual violence | $1117.55 | $1080.59 | $1154.51 |
| 2013 | Experienced sexual violence | $1416.79 | $1369.62 | $1463.96 |
| 2016 | Experienced sexual violence | $1746.76 | $1689.04 | $1804.48 |
| 2019 | Experienced sexual violence | $2225.56 | $2151.50 | $2299.62 |
Sexual violence and cost of non-referred consultations subsidised by Medicare
Across all cohorts, women who had experienced sexual violence had higher predicted average annual costs for consultations that do not require a referral (e.g. referral from a general practitioner, primary care or practice nurse consultation) than women who had not experienced sexual violence and this difference increased slightly over time.
The predicted average annual costs for non-referred consultations among women born in 1989 to 1995 were $73 (2013 to 2014 financial year) and $88 (2018 to 2019 financial year) higher than the predicted average annual costs for those women who had not experienced sexual violence.
Among women born in 1973 to 1978, the predicted average annual costs for non-referred consultations in the 1999 to 2000 financial year among women who had experienced sexual violence was $17 higher than for women who had not experienced sexual violence. By the 2017 to 2018 financial year, the predicted average annual cost of non-referred consultations was $36 higher for women who had experienced sexual violence compared to those who had not experienced sexual violence.
Among women born in 1946 to 1951, the predicted average annual costs for non-referred consultations in the 1997 to 1998 financial year for women who had experienced sexual violence was $6 higher than for women who had not experienced sexual violence. By the 2018 to 2019 financial year, the predicted average annual cost of non-referred consultations was $26 higher for women who had experienced sexual violence compared to those who had not experienced sexual violence.
Figure 36: Predicted average annual cost of non-referred consultations for women born in 1989 to 1995, 1973 to 1978 and 1946 to 1951, according to whether sexual violence had been experienced
Data tables for figure 36:
Born 1989 to 1995
| Year | Experience with sexual violence | Bound | Lower limit | Upper limit |
|---|---|---|---|---|
| 2014 | Never experienced sexual violence | $276.40 | $271.51 | $281.29 |
| 2015 | Never experienced sexual violence | $287.26 | $281.67 | $292.85 |
| 2016 | Never experienced sexual violence | $302.44 | $296.50 | $308.38 |
| 2017 | Never experienced sexual violence | $311.77 | $305.47 | $318.08 |
| 2019 | Never experienced sexual violence | $331.34 | $324.38 | $338.30 |
| 2014 | Experienced sexual violence | $349.68 | $342.07 | $357.29 |
| 2015 | Experienced sexual violence | $363.42 | $355.44 | $371.40 |
| 2016 | Experienced sexual violence | $382.62 | $374.28 | $390.96 |
| 2017 | Experienced sexual violence | $394.43 | $385.82 | $403.04 |
| 2019 | Experienced sexual violence | $419.19 | $410.17 | $428.21 |
Born 1973 to 1978
| Year | Experience with sexual violence | Bound | Lower limit | Upper limit |
|---|---|---|---|---|
| 2000 | Never experienced sexual violence | $130.63 | $128.25 | $133.01 |
| 2003 | Never experienced sexual violence | $137.00 | $134.40 | $139.61 |
| 2006 | Never experienced sexual violence | $180.35 | $176.88 | $183.82 |
| 2009 | Never experienced sexual violence | $209.29 | $205.07 | $213.52 |
| 2012 | Never experienced sexual violence | $222.98 | $218.38 | $227.57 |
| 2015 | Never experienced sexual violence | $250.78 | $245.37 | $256.19 |
| 2018 | Never experienced sexual violence | $274.89 | $268.90 | $280.89 |
| 2000 | Experienced sexual violence | $147.37 | $143.32 | $151.43 |
| 2003 | Experienced sexual violence | $154.56 | $150.39 | $158.74 |
| 2006 | Experienced sexual violence | $203.46 | $198.09 | $208.84 |
| 2009 | Experienced sexual violence | $236.12 | $229.84 | $242.39 |
| 2012 | Experienced sexual violence | $251.55 | $244.94 | $258.16 |
| 2015 | Experienced sexual violence | $282.92 | $275.45 | $290.39 |
| 2018 | Experienced sexual violence | $310.12 | $302.00 | $318.24 |
Born 1946 to 1951
| Year | Experience with sexual violence | Bound | Lower limit | Upper limit |
|---|---|---|---|---|
| 1998 | Never experienced sexual violence | $130.18 | $128.04 | $132.32 |
| 2001 | Never experienced sexual violence | $149.86 | $147.29 | $152.43 |
| 2004 | Never experienced sexual violence | $170.98 | $168.02 | $173.94 |
| 2007 | Never experienced sexual violence | $238.80 | $234.62 | $242.98 |
| 2010 | Never experienced sexual violence | $286.98 | $281.88 | $292.08 |
| 2013 | Never experienced sexual violence | $349.02 | $342.65 | $355.39 |
| 2016 | Never experienced sexual violence | $433.29 | $425.19 | $441.39 |
| 2019 | Never experienced sexual violence | $529.55 | $519.33 | $539.76 |
| 1998 | Experienced sexual violence | $136.66 | $133.02 | $140.29 |
| 2001 | Experienced sexual violence | $157.32 | $153.19 | $161.45 |
| 2004 | Experienced sexual violence | $179.49 | $174.82 | $184.15 |
| 2007 | Experienced sexual violence | $250.68 | $244.21 | $257.15 |
| 2010 | Experienced sexual violence | $301.26 | $293.47 | $309.02 |
| 2013 | Experienced sexual violence | $366.39 | $356.88 | $375.89 |
| 2016 | Experienced sexual violence | $454.84 | $443.15 | $466.54 |
| 2019 | Experienced sexual violence | $555.89 | $541.53 | $570.26 |
Sexual violence and cost of mental health consultations subsidised by Medicare
Mental health consultations were captured using the Better Access initiative item numbers available through Medicare, which allow for consultations with general practitioners, psychologists and psychiatrists. Using the most recent MBS data available, 23 per cent of women born in 1989 to 1995, 11 per cent of women born in 1973 to 1978 and 4 per cent of women born in 1946 to 1951 had at least one mental health consultation in the 2019 to 2020 financial year.
Women who had experienced sexual violence were more likely to have used at least one mental health consultation when compared to women who had not experienced sexual violence. In the 2018 to 2019 financial year, 22 per cent of women born in 1989 to 1995 who had experienced sexual violence had accessed a mental health consultation compared to 14 per cent of those who had not experienced sexual violence. Similarly, in the 2017 to 2018 financial year, 8 per cent of women born in 1973 to 1978 who had experienced sexual violence had accessed a mental health consultation compared to 3 per cent of those who had not experienced sexual violence. In the 2018 to 2019 financial year, 3 per cent of women born in 1946 to 1951 who had experienced sexual violence had accessed a mental health consultation compared to 1 per cent of those who had not experienced sexual violence.
However, among women who had used at least one mental health consultation, there was no meaningful difference in the number of mental health consultations between women who had and had not experienced sexual violence. Across all three cohorts, there were no meaningful differences in the predicted average annual cost of mental health consultations between women who had and had not experienced sexual violence (Figure 37). It should be noted that these are the predicted average annual costs among women who had at least one mental health consultation.
Figure 37: Predicted average annual cost of mental health services (using MBS Better Access initiative items) for women who used at least one mental health service born in 1989 to 1995, 1973 to 1978 and 1946 to 1951, according to whether sexual violence had been experienced
Data tables for figure 37:
Born 1989 to 1995
| Year | Experience with sexual violence | Bound | Lower limit | Upper limit |
|---|---|---|---|---|
| 2014 | Never experienced sexual violence | $507.99 | $485.54 | $530.43 |
| 2015 | Never experienced sexual violence | $494.89 | $471.20 | $518.59 |
| 2016 | Never experienced sexual violence | $517.50 | $493.61 | $541.39 |
| 2017 | Never experienced sexual violence | $509.17 | $485.56 | $532.79 |
| 2019 | Never experienced sexual violence | $509.12 | $486.00 | $532.24 |
| 2014 | Experienced sexual violence | $516.97 | $492.44 | $541.51 |
| 2015 | Experienced sexual violence | $503.65 | $479.22 | $528.08 |
| 2016 | Experienced sexual violence | $526.66 | $502.03 | $551.29 |
| 2017 | Experienced sexual violence | $518.18 | $494.24 | $542.12 |
| 2019 | Experienced sexual violence | $518.13 | $495.76 | $540.50 |
Born 1973 to 1978
| Year | Experience with sexual violence | Bound | Lower limit | Upper limit |
|---|---|---|---|---|
| 2009 | Never experienced sexual violence | $515.04 | $474.33 | $555.75 |
| 2012 | Never experienced sexual violence | $513.80 | $475.77 | $551.82 |
| 2015 | Never experienced sexual violence | $471.57 | $437.85 | $505.29 |
| 2018 | Never experienced sexual violence | $479.72 | $446.26 | $513.19 |
| 2009 | Experienced sexual violence | $573.16 | $521.78 | $624.54 |
| 2012 | Experienced sexual violence | $571.78 | $524.81 | $618.75 |
| 2015 | Experienced sexual violence | $524.78 | $484.32 | $565.25 |
| 2018 | Experienced sexual violence | $533.86 | $492.45 | $575.26 |
Born 1946 to 1951
| Year | Experience with sexual violence | Bound | Lower limit | Upper limit |
|---|---|---|---|---|
| 2007 | Never experienced sexual violence | $341.02 | $290.06 | $391.98 |
| 2010 | Never experienced sexual violence | $427.86 | $385.79 | $469.93 |
| 2013 | Never experienced sexual violence | $417.45 | $376.23 | $458.67 |
| 2016 | Never experienced sexual violence | $438.53 | $396.21 | $480.86 |
| 2019 | Never experienced sexual violence | $406.67 | $363.29 | $450.04 |
| 2007 | Experienced sexual violence | $388.62 | $325.17 | $452.07 |
| 2010 | Experienced sexual violence | $487.58 | $432.11 | $543.04 |
| 2013 | Experienced sexual violence | $475.72 | $421.33 | $530.11 |
| 2016 | Experienced sexual violence | $499.74 | $445.94 | $553.55 |
| 2019 | Experienced sexual violence | $463.43 | $407.79 | $519.07 |
Sexual violence and general practitioner satisfaction
Women born 1973 to 1978 were 11 per cent more likely to report poor satisfaction with general practitioner services if they had experienced sexual violence compared to women who had not reported sexual violence (95% CI=1.06, 1.16). This longitudinal model was controlled for CALD status, age, highest qualification, area of residence, relationship status and ability to manage on available income. Satisfaction with general practitioner services was not measured longitudinally among women born in 1989 to 1995 and 1946 to 1951.
Sexual violence and government-subsidised PBS medication costs
Approximately 40 per cent of women born 1989 to 1995, 35 per cent of women born 1973 to 1978 and 80 per cent of women born 1946 to 1951 had at least one government-subsidised PBS prescription each year.
The predicted average annual cost of all government-subsidised PBS medications across all three cohorts of women was similar between women who had experienced sexual violence and those who had not (Figure 38).
Figure 38: Predicted average annual cost of government-subsidised PBS medications for women born in 1989 to 1995, 1973 to 1978 and 1946 to 1951, according to whether sexual violence had been experienced
Data tables for figure 38:
Born 1989 to 1995
| Year | Experience with sexual violence | Bound | Lower limit | Upper limit |
|---|---|---|---|---|
| 2014 | Never experienced sexual violence | $189.61 | $179.40 | $199.81 |
| 2015 | Never experienced sexual violence | $190.09 | $179.04 | $201.13 |
| 2016 | Never experienced sexual violence | $209.87 | $197.37 | $222.37 |
| 2017 | Never experienced sexual violence | $229.56 | $215.34 | $243.78 |
| 2019 | Never experienced sexual violence | $270.15 | $252.21 | $288.10 |
| 2014 | Experienced sexual violence | $231.66 | $217.43 | $245.89 |
| 2015 | Experienced sexual violence | $232.25 | $217.88 | $246.61 |
| 2016 | Experienced sexual violence | $256.42 | $240.33 | $272.51 |
| 2017 | Experienced sexual violence | $280.47 | $262.47 | $298.47 |
| 2019 | Experienced sexual violence | $330.07 | $308.48 | $351.67 |
Born 1973 to 1978
| Year | Experience with sexual violence | Bound | Lower limit | Upper limit |
|---|---|---|---|---|
| 2015 | Never experienced sexual violence | $539.40 | $470.11 | $608.69 |
| 2018 | Never experienced sexual violence | $663.20 | $580.07 | $746.33 |
| 2015 | Experienced sexual violence | $616.43 | $527.89 | $704.98 |
| 2018 | Experienced sexual violence | $757.91 | $651.72 | $864.10 |
Born 1946 to 1951
| Year | Experience with sexual violence | Bound | Lower limit | Upper limit |
|---|---|---|---|---|
| 2013 | Never experienced sexual violence | $915.35 | $868.46 | $962.25 |
| 2016 | Never experienced sexual violence | $962.92 | $912.87 | $1,012.97 |
| 2019 | Never experienced sexual violence | $1,127.62 | $1,067.52 | $1,187.72 |
| 2013 | Experienced sexual violence | $1,036.59 | $960.77 | $1,112.41 |
| 2016 | Experienced sexual violence | $1,090.45 | $1,012.23 | $1,168.68 |
| 2019 | Experienced sexual violence | $1,276.97 | $1,185.17 | $1,368.77 |
Sexual violence and government-subsidised psychoactive PBS medication costs
The annual prevalence of filling at least one government-subsidised psychoactive PBS medication prescription (e.g. antidepressants, anxiolytics) was approximately 11 per cent among women born in 1989 to 1995 and 10 per cent among women born in 1973 to 1978. Among women born in 1946 to 1951, this prevalence increased from 23 per cent in the 2012 to 2013 financial year to 29 per cent in the 2019 to 2020 financial year.
The predicted average annual cost of all government-subsidised PBS medications across all three cohorts of women was similar between those women who had experienced sexual violence and those who had not (Figure 39).
Figure 39: Average annual cost of government-subsidised psychoactive PBS medications for women born in 1989 to 1995, 1973 to 1978 and 1946 to 1951, according to whether sexual violence had been experienced
Data tables for figure 39:
Born 1989 to 1995
| Year | Experience with sexual violence | Bound | Lower limit | Upper limit |
|---|---|---|---|---|
| 2014 | Never experienced sexual violence | $142.01 | $127.91 | $156.11 |
| 2015 | Never experienced sexual violence | $111.45 | $99.58 | $123.32 |
| 2016 | Never experienced sexual violence | $121.15 | $107.91 | $134.39 |
| 2017 | Never experienced sexual violence | $109.74 | $97.16 | $122.32 |
| 2019 | Never experienced sexual violence | $138.52 | $121.27 | $155.77 |
| 2014 | Experienced sexual violence | $164.07 | $147.57 | $180.58 |
| 2015 | Experienced sexual violence | $128.77 | $115.66 | $141.88 |
| 2016 | Experienced sexual violence | $139.97 | $125.40 | $154.55 |
| 2017 | Experienced sexual violence | $126.79 | $113.32 | $140.26 |
| 2019 | Experienced sexual violence | $160.04 | $142.39 | $177.70 |
Born 1973 to 1978
| Year | Experience with sexual violence | Bound | Lower limit | Upper limit |
|---|---|---|---|---|
| 2015 | Never experienced sexual violence | $195.97 | $153.11 | $238.84 |
| 2018 | Never experienced sexual violence | $224.02 | $172.73 | $275.32 |
| 2015 | Experienced sexual violence | $250.08 | $196.24 | $303.92 |
| 2018 | Experienced sexual violence | $285.87 | $221.90 | $349.84 |
Born 1946 to 1951
| Year | Experience with sexual violence | Bound | Lower limit | Upper limit |
|---|---|---|---|---|
| 2013 | Never experienced sexual violence | $110.56 | $101.10 | $120.03 |
| 2016 | Never experienced sexual violence | $117.63 | $107.31 | $127.95 |
| 2019 | Never experienced sexual violence | $122.51 | $111.46 | $133.56 |
| 2013 | Experienced sexual violence | $130.53 | $115.94 | $145.12 |
| 2016 | Experienced sexual violence | $138.87 | $123.66 | $154.09 |
| 2019 | Experienced sexual violence | $144.63 | $128.62 | $160.65 |
Sexual violence and health services
Findings from the Australian Longitudinal Study on Women’s Health
The predicted average annual costs* for women who had experienced sexual violence were
higher than the predicted average annual costs for those who had not experienced sexual violence:
- $268 higher for women born 1989 to 1995 (aged 24 to 30 in 2019) 2018–2019 financial year.
- $85 higher for women born 1973 to 197 (aged 40 to 45 in 2018) 2017–2018 financial year.
The predicted average annual costs for non-referred consultations were higher for women who had experienced sexual violence
than those who had not experienced sexual violence:
- $88 higher predicted average annual costs for non-referred consultations for women born 1989 to 1995 (aged 24 to 30 in 2019) 2018–2019 financial year.
- $36 higher predicted average annual costs for non-referred consultations for women born 1973 to 1978 (aged 40 to 45 in 2019) 2017–2018 financial year.
- $26 higher predicted average annual costs for non-referred consultations for women born 1946 to 1951 (aged 68 to 73 in 2019) 2018–2019 financial year.
Women born 1973 to 1978 were
11% more likely
to report poor satisfaction with GP services if they had experienced sexual violence compared to women who had not reported sexual violence.
* Government-subsidised Medicare costs.
** Satisfaction with GP services was not measured longitudinally for women born 1989 to 1995 and 1946 to 1951.
Chapter 7: Wellbeing among women who have experienced sexual violence
In each cohort, irrespective of experiencing sexual violence, 85 per cent of women aged 24 to 30 (in 2019), 89 per cent of women aged 40 to 45 (in 2018) and 85 per cent of women aged 68 to 73 (in 2019) reported good general health. Good mental health was reported by 75 per cent of women aged 21 to 27 (in 2016), 88 per cent of women aged 40 to 45 (in 2018) and 93 per cent of women aged 68 to 73 (in 2019). Among women aged 21 to 27, 67 per cent simultaneously reported both good general health and good mental health, as did 79 per cent of women aged 40 to 45 and 81 per cent of women aged 68 to 73.
Factors associated with wellbeing among women who have experienced sexual violence
Factors associated with improved wellbeing
Physical activity and social support were associated with good general health (Figure 40) among women who had experienced sexual violence. Those women who engaged in moderate to high physical activity were 10 to 17 per cent more likely to report good general health compared to women who engaged in no physical activity. This was consistently observed across the three cohorts of women. Where measures of social support were available for women born in 1973 to 1978 and 1946 to 1951, emotional support and guidance (e.g. empathetic understanding or advice) and affection and social interaction (e.g. expressions of love or companionship) were also associated with good general health among women who had experienced sexual violence.
Figure 40: Factors associated with an increased likelihood of reporting good general health
Data tables for figure 40:
Born 1989 to 1995
Physical activity
| Risk ratio | Lower limit | Upper limit | |
|---|---|---|---|
| Nil/sedentary | 1.00 | No data | No data |
| Low | 1.08 | 1.05 | 1.10 |
| Moderate | 1.12 | 1.10 | 1.15 |
| High | 1.17 | 1.14 | 1.19 |
Born 1973 to 1978
Physical activity
| Risk ratio | Lower limit | Upper limit | |
|---|---|---|---|
| Nil/sedentary | 1.00 | No data | No data |
| Low | 1.07 | 1.05 | 1.09 |
| Moderate | 1.10 | 1.09 | 1.12 |
| High | 1.12 | 1.10 | 1.14 |
Emotional support and guidance
| Risk ratio | Lower limit | Upper limit | |
|---|---|---|---|
| None or a little of the time | 1.00 | No data | No data |
| All, most, or some of the time | 1.05 | 1.01 | 1.08 |
Affection and social interaction
| Risk ratio | Lower limit | Upper limit | |
|---|---|---|---|
| None or a little of the time | 1.00 | No data | No data |
| All, most, or some of the time | 1.13 | 1.08 | 1.18 |
Tangible or physical assistance
| Risk ratio | Lower limit | Upper limit | |
|---|---|---|---|
| None or a little of the time | 1.00 | No data | No data |
| All, most, or some of the time | 1.02 | 1.00 | 1.04 |
Born 1946 to 1951
Physical activity
| Risk ratio | Lower limit | Upper limit | |
|---|---|---|---|
| Nil/sedentary | 1.00 | No data | No data |
| Low | 1.10 | 1.08 | 1.11 |
| Moderate | 1.12 | 1.11 | 1.14 |
| High | 1.15 | 1.13 | 1.17 |
Emotional support and guidance
| Risk ratio | Lower limit | Upper limit | |
|---|---|---|---|
| None or a little of the time | 1.00 | No data | No data |
| All, most, or some of the time | 1.06 | 1.03 | 1.08 |
Affection and social interaction
| Risk ratio | Lower limit | Upper limit | |
|---|---|---|---|
| None or a little of the time | 1.00 | No data | No data |
| All, most, or some of the time | 1.04 | 1.01 | 1.06 |
Tangible or physical assistance
| Risk ratio | Lower limit | Upper limit | |
|---|---|---|---|
| None or a little of the time | 1.00 | No data | No data |
| All, most, or some of the time | 1.00 | 0.98 | 1.01 |
Overall, 75 per cent of women aged 21 to 27 (in 2016), 88 per cent of women aged 40 to 45 (in 2018) and 93 per cent of women aged 68 to 73 (in 2019) reported good mental health. As with general health, physical activity and social support were associated with good mental health among women who had experienced sexual violence (Figure 41). However, in addition to emotional support and guidance (e.g. empathetic understanding or advice) and affection and social interaction (e.g. expressions of love or companionship), there was evidence of a small association between tangible or physical assistance and good mental health among women who had experienced sexual violence.
Figure 41: Factors associated with an increased likelihood of reporting good mental health
Data tables for figure 41:
Born 1989 to 1995
Physical activity
| Risk ratio | Lower limit | Upper limit | |
|---|---|---|---|
| Nil/sedentary | 1.00 | No data | No data |
| Low | 1.12 | 1.03 | 1.22 |
| Moderate | 1.17 | 1.08 | 1.28 |
| High | 1.23 | 1.14 | 1.34 |
Born 1973 to 1978
Physical activity
| Risk ratio | Lower limit | Upper limit | |
|---|---|---|---|
| Nil/sedentary | 1.00 | No data | No data |
| Low | 1.02 | 1.01 | 1.04 |
| Moderate | 1.04 | 1.02 | 1.05 |
| High | 1.04 | 1.03 | 1.06 |
Emotional support and guidance
| Risk ratio | Lower limit | Upper limit | |
|---|---|---|---|
| None or a little of the time | 1.00 | No data | No data |
| All, most, or some of the time | 1.20 | 1.14 | 1.26 |
Affection and social interaction
| Risk ratio | Lower limit | Upper limit | |
|---|---|---|---|
| None or a little of the time | 1.00 | No data | No data |
| All, most, or some of the time | 1.26 | 1.19 | 1.34 |
Tangible or physical assistance
| Risk ratio | Lower limit | Upper limit | |
|---|---|---|---|
| None or a little of the time | 1.00 | No data | No data |
| All, most, or some of the time | 1.04 | 1.01 | 1.06 |
Born 1946 to 1951
Physical activity
| Risk ratio | Lower limit | Upper limit | |
|---|---|---|---|
| Nil/sedentary | 1.00 | No data | No data |
| Low | 1.04 | 1.03 | 1.05 |
| Moderate | 1.05 | 1.03 | 1.06 |
| High | 1.06 | 1.05 | 1.07 |
Emotional support and guidance
| Risk ratio | Lower limit | Upper limit | |
|---|---|---|---|
| None or a little of the time | 1.00 | No data | No data |
| All, most, or some of the time | 1.10 | 1.07 | 1.12 |
Affection and social interaction
| Risk ratio | Lower limit | Upper limit | |
|---|---|---|---|
| None or a little of the time | 1.00 | No data | No data |
| All, most, or some of the time | 1.09 | 1.06 | 1.13 |
Tangible or physical assistance
| Risk ratio | Lower limit | Upper limit | |
|---|---|---|---|
| None or a little of the time | 1.00 | No data | No data |
| All, most, or some of the time | 1.02 | 1.01 | 1.04 |
Factors associated with a decline in wellbeing
Factors that reduced the likelihood of good general health and good mental health among women who had experienced sexual violence included sexual violence during childhood, recent non-sexual violence, high alcohol consumption, current smoking, obesity and difficulty managing on available income (Figure 42 and Figure 43). There were substantial differences across cohorts in these effects. However, most effect sizes were relatively small, indicating a small (less than 10%) reduction in likelihood of reporting good general and mental health due to these factors.
Figure 42: Factors associated with a decreased likelihood of reporting good general health
Data tables for figure 42:
Born 1989 to 1995
Recent non-sexual violence
| Risk ratio | Lower limit | Upper limit | |
|---|---|---|---|
| No | 1.00 | No data | No data |
| Yes | 0.97 | 0.96 | 0.98 |
Sexual abuse during childhood
| Risk ratio | Lower limit | Upper limit | |
|---|---|---|---|
| No | 1.00 | No data | No data |
| Yes | 0.92 | 0.90 | 0.94 |
Income management
| Risk ratio | Lower limit | Upper limit | |
|---|---|---|---|
| Not too bad/easy | 1.00 | No data | No data |
| Difficult sometimes | 0.98 | 0.97 | 0.98 |
| Difficult always/impossible | 0.91 | 0.90 | 0.92 |
Highest qualification
| Risk ratio | Lower limit | Upper limit | |
|---|---|---|---|
| Year 12 or below | 1.00 | No data | No data |
| Certificate/diploma | 0.99 | 0.98 | 1.01 |
| Tertiary qualification | 1.02 | 1.01 | 1.03 |
Alcohol consumption
| Risk ratio | Lower limit | Upper limit | |
|---|---|---|---|
| Low risk drinker | 1.00 | No data | No data |
| Non-drinker | 0.94 | 0.92 | 0.96 |
| Rarely drinks | 0.97 | 0.96 | 0.98 |
| Risky/high risk drinker | 0.95 | 0.93 | 0.98 |
Smoking status
| Risk ratio | Lower limit | Upper limit | |
|---|---|---|---|
| Non-smoker | 1.00 | No data | No data |
| Ex-smoker | 0.99 | 0.98 | 1.01 |
| Current smoker | 0.92 | 0.90 | 0.93 |
Body mass index
| Risk ratio | Lower limit | Upper limit | |
|---|---|---|---|
| Underweight | 0.95 | 0.93 | 0.97 |
| Healthy | 1.00 | No data | No data |
| Overweight | 0.95 | 0.94 | 0.96 |
| Obese | 0.82 | 0.81 | 0.84 |
Born 1973 to 1978
Recent non-sexual violence
| Risk ratio | Lower limit | Upper limit | |
|---|---|---|---|
| No | 1.00 | No data | No data |
| Yes | 0.97 | 0.96 | 0.99 |
Sexual abuse during childhood
| Risk ratio | Lower limit | Upper limit | |
|---|---|---|---|
| No | 1.00 | No data | No data |
| Yes | 0.95 | 0.94 | 0.97 |
Income management
| Risk ratio | Lower limit | Upper limit | |
|---|---|---|---|
| Not too bad/easy | 1.00 | No data | No data |
| Difficult sometimes | 0.98 | 0.97 | 0.99 |
| Difficult always/impossible | 0.92 | 0.91 | 0.94 |
Highest qualification
| Risk ratio | Lower limit | Upper limit | |
|---|---|---|---|
| Year 12 or below | 1.00 | No data | No data |
| Certificate/diploma | 1.02 | 1.00 | 1.03 |
| Tertiary qualification | 1.02 | 1.00 | 1.03 |
Alcohol consumption
| Risk ratio | Lower limit | Upper limit | |
|---|---|---|---|
| Low risk drinker | 1.00 | No data | No data |
| Non-drinker | 0.97 | 0.96 | 0.99 |
| Rarely drinks | 0.98 | 0.97 | 0.99 |
| Risky/high risk drinker | 0.96 | 0.94 | 0.98 |
Smoking status
| Risk ratio | Lower limit | Upper limit | |
|---|---|---|---|
| Non-smoker | 1.00 | No data | No data |
| Ex-smoker | 1.00 | 0.99 | 1.01 |
| Current smoker | 0.97 | 0.95 | 0.99 |
Body mass index
| Risk ratio | Lower limit | Upper limit | |
|---|---|---|---|
| Underweight | 0.99 | 0.96 | 1.01 |
| Healthy | 1.00 | No data | No data |
| Overweight | 0.98 | 0.97 | 0.99 |
| Obese | 0.89 | 1.10 | 1.14 |
Born 1946 to 1951
Recent non-sexual violence
| Risk ratio | Lower limit | Upper limit | |
|---|---|---|---|
| No | 1.00 | No data | No data |
| Yes | 0.96 | 0.93 | 0.99 |
Sexual abuse during childhood
| Risk ratio | Lower limit | Upper limit | |
|---|---|---|---|
| No | 1.00 | No data | No data |
| Yes | 0.96 | 0.94 | 0.97 |
Income management
| Risk ratio | Lower limit | Upper limit | |
|---|---|---|---|
| Not too bad/easy | 1.00 | No data | No data |
| Difficult sometimes | 0.98 | 0.97 | 0.98 |
| Difficult always/impossible | 0.92 | 0.91 | 0.94 |
Highest qualification
| Risk ratio | Lower limit | Upper limit | |
|---|---|---|---|
| Year 12 or below | 1.00 | No data | No data |
| Certificate/diploma | 1.01 | 0.99 | 1.02 |
| Tertiary qualification | 1.01 | 1.00 | 1.02 |
Alcohol consumption
| Risk ratio | Lower limit | Upper limit | |
|---|---|---|---|
| Low risk drinker | 1.00 | No data | No data |
| Non-drinker | 0.92 | 0.90 | 0.93 |
| Rarely drinks | 0.96 | 0.96 | 0.97 |
| Risky/high risk drinker | 1.01 | 1.00 | 1.03 |
Smoking status
| Risk ratio | Lower limit | Upper limit | |
|---|---|---|---|
| Non-smoker | 1.00 | No data | No data |
| Ex-smoker | 0.98 | 0.97 | 0.99 |
| Current smoker | 0.96 | 0.95 | 0.98 |
Body mass index
| Risk ratio | Lower limit | Upper limit | |
|---|---|---|---|
| Underweight | 0.93 | 0.89 | 0.97 |
| Healthy | 1.00 | No data | No data |
| Overweight | 0.99 | 0.98 | 1.00 |
| Obese | 0.94 | 0.93 | 0.95 |
Figure 43: Factors associated with a decreased likelihood of reporting good mental health
Data tables for figure 43:
Born 1989 to 1995
Recent non-sexual violence
| Risk ratio | Lower limit | Upper limit | |
|---|---|---|---|
| No | 1.00 | No data | No data |
| Yes | 0.85 | 0.81 | 0.90 |
Sexual abuse during childhood
| Risk ratio | Lower limit | Upper limit | |
|---|---|---|---|
| No | 1.00 | No data | No data |
| Yes | 0.91 | 0.87 | 0.96 |
Income management
| Risk ratio | Lower limit | Upper limit | |
|---|---|---|---|
| Not too bad/easy | 1.00 | No data | No data |
| Difficult sometimes | 0.87 | 0.85 | 0.90 |
| Difficult always/impossible | 0.72 | 0.69 | 0.76 |
Highest qualification
| Risk ratio | Lower limit | Upper limit | |
|---|---|---|---|
| Year 12 or below | 1.00 | No data | No data |
| Certificate/diploma | 1.05 | 1.01 | 1.09 |
| Tertiary qualification | 1.08 | 1.04 | 1.12 |
Alcohol consumption
| Risk ratio | Lower limit | Upper limit | |
|---|---|---|---|
| Low risk drinker | 1.00 | No data | No data |
| Non-drinker | 0.89 | 0.85 | 0.94 |
| Rarely drinks | 0.94 | 0.91 | 0.97 |
| Risky/high risk drinker | 0.89 | 0.80 | 1.00 |
Smoking status
| Risk ratio | Lower limit | Upper limit | |
|---|---|---|---|
| Non-smoker | 1.00 | No data | No data |
| Ex-smoker | 1.02 | 0.98 | 1.07 |
| Current smoker | 0.90 | 0.86 | 0.94 |
Body mass index
| Risk ratio | Lower limit | Upper limit | |
|---|---|---|---|
| Underweight | 0.95 | 0.90 | 1.02 |
| Healthy | 1.00 | No data | No data |
| Overweight | 0.98 | 0.95 | 1.01 |
| Obese | 0.91 | 0.88 | 0.95 |
Born 1973 to 1978
Recent non-sexual violence
| Risk ratio | Lower limit | Upper limit | |
|---|---|---|---|
| No | 1.00 | No data | No data |
| Yes | 0.93 | 0.91 | 0.94 |
Sexual abuse during childhood
| Risk ratio | Lower limit | Upper limit | |
|---|---|---|---|
| No | 1.00 | No data | No data |
| Yes | 0.95 | 0.93 | 0.97 |
Income management
| Risk ratio | Lower limit | Upper limit | |
|---|---|---|---|
| Not too bad/easy | 1.00 | No data | No data |
| Difficult sometimes | 0.97 | 0.96 | 0.98 |
| Difficult always/impossible | 0.88 | 0.86 | 0.90 |
Highest qualification
| Risk ratio | Lower limit | Upper limit | |
|---|---|---|---|
| Year 12 or below | 1.00 | No data | No data |
| Certificate/diploma | 1.01 | 1.00 | 1.03 |
| Tertiary qualification | 1.02 | 1.00 | 1.03 |
Alcohol consumption
| Risk ratio | Lower limit | Upper limit | |
|---|---|---|---|
| Low risk drinker | 1.00 | No data | No data |
| Non-drinker | 1.00 | 0.98 | 1.01 |
| Rarely drinks | 0.99 | 0.98 | 1.00 |
| Risky/high risk drinker | 0.95 | 0.92 | 0.97 |
Smoking status
| Risk ratio | Lower limit | Upper limit | |
|---|---|---|---|
| Non-smoker | 1.00 | No data | No data |
| Ex-smoker | 0.99 | 0.98 | 1.01 |
| Current smoker | 0.95 | 0.93 | 0.97 |
Body mass index
| Risk ratio | Lower limit | Upper limit | |
|---|---|---|---|
| Underweight | 0.96 | 0.93 | 0.99 |
| Healthy | 1.00 | No data | No data |
| Overweight | 1.01 | 1.00 | 1.02 |
| Obese | 0.97 | 0.96 | 0.98 |
Born 1946 to 1951
Recent non-sexual violence
| Risk ratio | Lower limit | Upper limit | |
|---|---|---|---|
| No | 1.00 | No data | No data |
| Yes | 0.93 | 0.90 | 0.97 |
Sexual abuse during childhood
| Risk ratio | Lower limit | Upper limit | |
|---|---|---|---|
| No | 1.00 | No data | No data |
| Yes | 0.95 | 0.93 | 0.96 |
Income management
| Risk ratio | Lower limit | Upper limit | |
|---|---|---|---|
| Not too bad/easy | 1.00 | No data | No data |
| Difficult sometimes | 0.98 | 0.97 | 0.98 |
| Difficult always/impossible | 0.92 | 0.91 | 0.93 |
Highest qualification
| Risk ratio | Lower limit | Upper limit | |
|---|---|---|---|
| Year 12 or below | 1.00 | No data | No data |
| Certificate/diploma | 1.01 | 1.00 | 1.02 |
| Tertiary qualification | 1.02 | 1.01 | 1.03 |
Alcohol consumption
| Risk ratio | Lower limit | Upper limit | |
|---|---|---|---|
| Low risk drinker | 1.00 | No data | No data |
| Non-drinker | 1.00 | 0.99 | 1.01 |
| Rarely drinks | 0.99 | 0.98 | 1.00 |
| Risky/high risk drinker | 0.98 | 0.97 | 1.00 |
Smoking status
| Risk ratio | Lower limit | Upper limit | |
|---|---|---|---|
| Non-smoker | 1.00 | No data | No data |
| Ex-smoker | 1.00 | 0.99 | 1.00 |
| Current smoker | 0.97 | 0.95 | 0.98 |
Body mass index
| Risk ratio | Lower limit | Upper limit | |
|---|---|---|---|
| Underweight | 0.96 | 0.93 | 0.99 |
| Healthy | 1.00 | No data | No data |
| Overweight | 1.01 | 1.00 | 1.01 |
| Obese | 0.99 | 0.98 | 1.00 |
Effect of health service use on mental health among women who have experienced sexual violence
Among women who had experienced sexual violence, 41 per cent of women aged 20 to 26 (in 2015), 29 per cent of women aged 40 to 45 (in 2018) and 10 per cent of women aged 68 to 73 (in 2019) reported a consultation with a counsellor or other mental health worker in the last 12 months. Among women who had experienced sexual violence, 19 per cent of women aged 24 to 30 (in 2019), 21 per cent of women aged 40 to 45 (in 2018) and 19 per cent of women aged 68 to 73 (in 2019) reported an improvement in their mental health since their last survey.
Women born in 1989 to 1995 who had experienced sexual violence were 17 per cent more likely to report an improvement in mental health if they had reported a mental health consultation in the last 12 months, compared to women who had not reported a mental health consultation in the last 12 months (Figure 44). Similarly, among women born in 1946 to 1951 who had experienced sexual violence, those who had reported a mental health consultation in the last 12 months were 9 per cent more likely to report an improvement in mental health compared to women who had not had a mental health consultation in the last 12 months.
Figure 44: Effect estimates for association between mental health consultations in the last 12 months and improvements in mental health
Note: Longitudinal models in Figure 44 were controlled for CALD status, age, highest qualification, area of residence, relationship status and ability to manage on available income.
Data table for figure 44:
| Risk ratio | Lower limit | Upper limit | |
|---|---|---|---|
| Born 1989 to 1995 | 1.17 | 1.08 | 1.26 |
| Born 1973 to 1978 | 0.99 | 0.92 | 1.07 |
| Born 1946 to 1951 | 1.09 | 1.00 | 1.20 |
Wellbeing among women who have experienced sexual violence
Findings from the Australian Longitudinal Study on Women’s Health
Factors that reduced the likelihood of good general health and good mental health among women who had experienced sexual violence:
- Sexual violence during childhood.
- Recent non-sexual violence.
- Difficulty managing on available income.
- High alcohol consumption.
- Current smoking.
- Obesity.
Factors that were associated with good general health and good mental health among women who had experienced sexual violence:
- Physical activity.
- Emotional support and guidance*.
- Affection and social interaction*.
- Tangible or physical assistance (mental health only).
Women born 1989 to 1995 (aged 24 to 30 in 2019) and 1946 to 1951 (aged 68 to 73 in 2019) who had experienced sexual violence were
9 to 17% more likely
to report an improvement in mental health if they had reported a mental health consultation in the last 12 months, compared to women who had not reported a mental health consultation in the last 12 months**.
* Associations between good general health and emotional support and guidance and affection and social interaction were found for women born 1973 to 1978 and 1946 to 1951 only.
** Risk ratios varied for women born 1989 to 1995, 1973 to 1978, and 1946 to 1951.
Discussion
“Trauma lives on in ourselves. Our unconscious bodies are steps ahead of our conscious minds. When we’re triggered, we’re at the mercy of our emotional brain.
In this state, it’s impossible to discern between past and present.”
Grace Tame, National Press Club Address, February 2022
As 2021 Australian of the Year Grace Tame has pointed out, retelling experiences of sexual violence comes at a cost. Earlier research with women who participated in the ALSWH has also shown the emotional impact of disclosing experiences of violence (Loxton, Townsend, et al., 2017). To examine sexual violence over the life course means asking the same women to record these experiences on a regular basis. We start this discussion by acknowledging, with heartfelt thanks, the ongoing participation in the ALSWH of the women whose data have permitted the analyses included in this report.
The findings of this report reveal that experiencing sexual violence is common among women in Australia, with some variation by age indicating that sexual violence is more frequently reported by younger women. Across all cohorts, sexual violence in childhood was found to be a risk factor for experiencing further violence. In line with past research, sexual violence was associated with socioeconomic outcomes, including level of education and financial stress. Sexual violence was also associated with some adverse health behaviours. Regardless of age, women who experienced sexual violence had poorer health than women who had not experienced sexual violence, across all measures of both physical and mental health. As might be expected, sexual violence was also associated with higher primary healthcare costs, with mental health service access slightly higher but the costs similar between women who had and had not experienced sexual violence. Factorsassociated with wellbeing among women who had experienced sexual violence included physical activity and social support. These findings are discussed in more detail in the following sections.
Prevalence of sexual violence
More than half of women in their late twenties, one third of women in their early forties and a quarter of women in their late sixties and early seventies reported sexual violence in their lifetime. The results are not directly comparable to the PSS, which indicated one in five Australian women had experienced sexual violence (Australian Bureau of Statistics, 2017), due to sample and data capture differences. Other Australian studies have reported the lifetime prevalence of sexual violence at 17 per cent in South Australia (González-Chica et al., 2019) and 41 per cent among women visiting a general practitioner (Tarzia et al., 2018).
The ALSWH measures childhood sexual violence using a comprehensive subscale of the well-validated Adverse Childhood Experiences Scale (Felitti et al., 1998) and captures sexual violence in adulthood using a broad measure of “unwanted sexual activity”, which is consistent with approaches of the WHO, the Department of Social Services and the AIHW (Australian Institute of Health and Welfare, 2019a; Department of Social Services, 2019; World Health Organization et al., 2013). ALSWH data may result in higher prevalence rates of adult sexual violence compared to other studies due to the broad measures used by ALSWH and their lack of specificity concerning the sexual acts involved. However, we argue that relying on the respondent’s interpretation with regard to defining “sexual activity” offers a high level of subjective salience that is necessary to validly measure the incidence of sexual violence.
The results revealed wide variations in the prevalence of sexual violence by age, type of violence and priority population. The differences in prevalence by age may reflect generational differences in understanding, personal feelings about disclosing sexual violence and the time since the violence occurred (Loxton, Townsend, et al., 2017). Measurement differences will have also impacted these results – for example, the cohort born 1946 to 1951 was not specifically asked about sexual violence perpetrated by a partner. The findings indicate a much higher lifetime prevalence of sexual violence than has been previously reported in Australian national data. The broad definition of sexual violence that was used and the increased attention to sexual violence in the media with its impact on awareness have likely contributed to this difference.
Sexual violence during childhood was reported by 12 per cent of women born 1989 to 1995, 15 per cent of women born 1973 to 1978 and 14 per cent of women born 1946 to 1951. There was minimal variation in prevalence across the cohorts, with the most common form of childhood sexual violence being touching (11 to 14%) and the least common being attempted penetrative sexual violence (4 to 5%) and actual penetrative sexual violence (3 to 4%). The overall prevalence is more than the 11 per cent reported by the PSS (Australian Bureau of Statistics, 2017). However, the ALSWH defines childhood sexual violence as occurring before 18 years of age and the PSS uses a cut-off of 15 years, so ALSWH data incorporate a longer timeframe in which violence could occur. Two studies of pregnant women conducted in Victoria and Queensland found higher rates of childhood sexual violence, at 23 per cent (Gartland et al., 2016) and 31 per cent (Mills et al.,2016) respectively. Sample differences may account for these differences, with interpersonal violence being reported at higher levels in clinical samples than in community-based samples such as the ALSWH (Tarzia et al., 2017).
Lifetime sexual violence perpetrated by a partner was reported by 33 per cent of women aged 24 to 30 in 2019 and 14 per cent of women aged 40 to 45 in 2018. The same factors that drive differences in overall reporting are likely to drive the differences in reporting partner-perpetrated sexual violence. In addition, there are generational differences in the ways in which women define intimate relationships that might have impacted the results (Loxton, Dolja-Gore, et al., 2017; Stark et al., 2012). Similarly, recent studies have suggested that these generational effects may extend to women’s beliefs and perceptions about violence within relationships, further influencing how women respond to these items (Machado et al., 2014; Neves & Almeida, 2020).
Sexual violence occurring at any point in adulthood was reported by 39 per cent of women aged 24 to 30, compared with 18 per cent of women aged 40 to 45 and 12 per cent of those in their late sixties and early seventies. Recent sexual violence (within the previous 12 months) was found to fall slightly over time for all three cohorts: from 6 to 4 per cent for women born in 1989 to 1995; from 4 to 1 per cent for women born in 1973 to 1978; and from 1.8 to 0.3 per cent for women born in 1946 to 1951. While the results are encouraging, the percentage differences are small, so results should be viewed with caution. There are no comparable longitudinal data in Australia with which to compare these results. To ascertain improvements in prevalence rates of sexual violence with confidence, we need to continue to monitor the different cohorts and supplement this information with data gathered from other age groups and specific populations.
Among women born in 1989 to 1995 and 1973 to 1978, those who identified as bisexual reported a higher prevalence of sexual violence than women who identified as mainly or exclusively lesbian or heterosexual. This is in line with previous international research in this area (Black, 2011). However, the low number of women in the ALSWH cohorts who identify as bisexual limits the generalisability of our findings. Across the three ALSWH cohorts, women who identified as mainly or exclusively lesbian were more likely to report sexual violence than women who identified as being mainly or exclusively heterosexual. A previous study using ALSWH data reported a higher prevalence of sexual violence among women identifying as mainly heterosexual, bisexual and lesbian compared to women identifying as exclusively heterosexual (Szalacha et al., 2017). There is generally a lack of Australian and recent international data concerned with the prevalence of sexualviolence among those who identify as lesbian, gay, bisexual, queer, intersex or transgender (Campo & Tayton, 2015; Ussher et al., 2020). While the current report can contribute to this knowledge gap in a limited way, there is a need for more focused research in this area.
Although slightly lower, the prevalence of sexual violence among women from a CALD background was not dissimilar to the prevalence reported by women without a CALD background. This was seen across all three cohorts of women. As we have previously reported (Loxton, Townsend, et al., 2018), women from CALD backgrounds may be less likely to report experiencing interpersonal violence for various reasons. The AIHW highlighted the difficulties in understanding the prevalence of sexual violence among women from CALD communities. Findings from national data sources such as the Australian Bureau of Statistics’ PSS present conflicting results (Australian Institute of Health and Welfare, 2020). It was suggested that this may be due to the small number of women from CALD backgrounds participating in the survey, in addition to the barriers faced in disclosing experiences of violence.
There was a much higher prevalence of all types of sexual violence among women living with disability, major illness or injury when compared to those not living with disability, major illness or injury across all three cohorts. We have previously reported similar results in relation to domestic violence (Loxton, Townsend, et al., 2018). The findings were also in line with those of the 2016 PSS, which estimated a higher prevalence of sexual violence after the age of 15 among women living with disability compared to those without disability (16% versus 9.6%; Australian Bureau of Statistics, 2017).
Sexual violence during childhood as a risk factor for further violence
Findings indicated that sexual violence experienced in childhood was clearly associated with experiencing later sexual, physical and domestic violence for women born in 1989 to 1995 and women born in 1973 to 1978, even after adjusting for sociodemographic and economic status. These findings build on the growing body of evidence that has shown links between experiencing sexual violence in childhood and experiencing violence again later in life (Cox, 2015; Gartland et al., 2016; Öberg et al., 2021), underscoring the need for a better understanding of the link between childhood sexual violence and experiencing violence during adulthood.
Lifetime sexual violence and economic factors
Findings indicated associations between sexual violence and education, employment and financial stress, in keeping with past research (Baigorria et al., 2017). Sexual violence has been previously shown to predict poor academic performance (Baker et al., 2016) and lower education levels (Baigorria et al., 2017). The current report was able to show that life stage influences these findings. While women in their twenties and forties who had experienced sexual violence were less likely to have completed Year 12 than those who had not experienced sexual violence, the results for women in their sixties and seventies showed the reverse. That is, women born 1946 to 1951 who had experienced sexual violence were more likely to have a qualification beyond Year 12 than women who had not experienced sexual violence. Women who have experienced sexual violence may have been more likely to separate from a partner and, to support themselvesfinancially, undertaken further training. Women from the older cohort might have had more opportunity and time to complete this extra training.
Consideration of life stage was also important when examining paid employment in relation to sexual violence. Past research has indicated that sexual violence leads to disruptions to paid employment (Dillon et al., 2015), including a higher prevalence of unemployment (Showalter, 2016). Our results showed paid employment differences by cohort and as time passed. Sexual violence was related to a lower likelihood of paid employment among women born in 1989 to 1995, with the gap between those who had and had not experienced sexual violence widening as women moved through their twenties. No association between paid employment and sexual violence was found among women born in 1973 to 1978, whose employment status was similar from early adulthood until they were in their forties. Women born in 1946 to 1951 who had experienced sexual violence were more likely to be in paid employment than those who had not experienced sexual violence. This wasevident from when women were aged in their late forties until they were in their late sixties and early seventies.
Although education level and paid employment differed by age group, financial stress was consistently related to sexual violence across the three cohorts and over time. Past research has shown associations between sexual violence and financial hardship at particular points in time (Dillon et al., 2015; Loya, 2015; Showalter, 2016). The current research clearly shows that this is an enduring association that decreases over time but remains beyond retirement age.
Sexual violence and health behaviours
Findings of the current report showed a clear relationship between past sexual violence and recent illicit drug use, high-risk alcohol consumption, current tobacco use (smoking) and obesity among women in their twenties and forties. While past research had found relationships between sexual violence and these health behaviours in studies conducted overseas (Austin & Short, 2020; Bacchus et al., 2018; Clark et al., 2014; González-Chica et al., 2019; Stensland et al., 2015), the current research showed differences between generations. Women born in 1946 to 1951 who had experienced sexual violence were only slightly more likely to report high-risk alcohol consumption or obesity compared with those who had not experienced sexual violence. There were no differences for tobacco use in this cohort. Findings suggest that, with time, differences in adverse health behaviours attributable to experiencing sexual violence may be somewhat mitigated.However, the long-lasting nature of adverse health behaviours associated with sexual violence were clearly apparent for younger women. Given the health problems caused by substance use and misuse and obesity, early attention to the needs of women who have experienced sexual violence may prevent the onset of serious health problems in later life.
Little research has been conducted with regard to the presence of beneficial health behaviours among women who have experienced sexual violence. Analysis of ALSWH data revealed that despite the results for obesity, there were only slight differences in physical activity levels between women who had and had not experienced sexual violence. Results for screening were similar, with only slight differences in the uptake of cervical cancer screening and mammography (among women born in 1946 to 1951) in relation to sexual violence. While this has not been widely examined in past research, other population-based studies have reported similar findings with regard to screening behaviours. Previous analyses have suggested that women who have experienced intimate partner violence, including sexual violence, are less likely to undergo regular mammography and colorectal cancer screening than those who have not experienced intimate partner violence, althoughthese differences were small (Massetti et al., 2018; Watson-Johnson et al., 2012). Together the results suggest that sexual violence tends to be related to the presence of adverse or health-risk behaviours, rather than the absence of those behaviours that promote good health.
Sexual violence and health
Sexual violence was associated with an increased risk of poor mental and physical health across all of the measures included in this report. These findings were robust, even after adjusting for sociodemographic factors. Regardless of age or generation, women who had experienced sexual violence were more likely than women who had never experienced sexual violence to report fair to poor health, bodily pain, recent STIs, depression, anxiety, high stress and psychological distress (psychological distress was only measured in the 1989 to 1995 cohort). Differences between cohorts were minimal. The impact of sexual violence on general health and bodily pain were somewhat less and stress was slightly more apparent for older women. The findings strongly suggest a long-term detrimental health impact related to sexual violence.
Past research has indicated similar findings for both physical and mental health (Bacchus et al., 2018; Coles et al., 2014; Hailes et al., 2019; Reingle Gonzalez et al., 2018). The current study adds weight to current knowledge with the use of national, broadly representative data from three distinct generations. Using a measure of lifetime experiences of sexual violence that has been collected at multiple time points further permits the gravity of these health impacts to be considered and addressed.
Sexual violence and health services
Given the results for health, it might be expected that women who have experienced sexual violence would make high use of health services. However, previous results in this area have been inconclusive, with some studies reporting lower health service use (Graham et al., 2019; Massetti et al., 2018) in relation to sexual violence and others focusing on specific (Yang et al., 2014) rather than overall services.
Analysis of ALSWH data linked with Medicare data was conducted to provide an objective assessment of women’s use of health services in relation to self-reported sexual violence. We assessed government costs rather than including out-of-pocket costs that vary widely due to individual factors. Results showed that sexual violence was related to higher overall health service use costs for women born in 1989 to 1995 and 1973 to 1978 over the six-year and 21-year study periods, respectively. There was no difference in overall costs for women born 1946 to 1951 in relation to sexual violence. However, somewhat higher non-referred consultation costs were found across all three cohorts in relation to sexual violence.
With the higher prevalence of mental health issues among women who have experienced sexual violence, it was not surprising to note that there was higher uptake of Better Access initiative mental healthcare services for women who had experienced sexual violence. However, among women who accessed Better Access initiative mental health care services, costs were similar between women who had and had not experienced sexual violence. There were no differences in psychoactive prescription costs covered by the PBS in relation to sexual violence across the three cohorts.
The findings for health and health service use seem somewhat at odds with each other. It might have been expected that healthcare use and costs would be markedly higher for women who have experienced sexual violence. The lack of a cost difference related to mental health service use was particularly surprising, although we note that uptake was associated with sexual violence. One possible explanation concerns the perceived quality of the general practitioner services being provided. To access services through the Better Access initiative, a general practitioner must first be consulted. If this relationship is perceived as strained or not satisfactory, a patient may not pursue support (Rees et al., 2019). The findings of the current report showed that among women born in 1973 to 1978, those who had experienced sexual violence were less likely to report satisfaction with general practitioner services compared to women who had not experienced sexualviolence. This result is consistent with the results of a previously published analysis that showed women in this cohort who had experienced childhood sexual violence were less likely to be satisfied with general practitioner services than other women (Coles et al., 2015). It is also possible that healthcare needs are being provided through primary healthcare and other services not covered by Medicare, such as specialist counselling services and those subsidised through state government departments (e.g. counselling through NSW Department of Communities and Justice victim services). Nevertheless, these findings and the long-lasting health impact of sexual violence suggest possible unmet needs related to sexual violence. More research is needed in this area, particularly since our results showed a tendency for improvement in mental health related to mental health consultation uptake among women who had experienced sexual violence.
Wellbeing among women who have experienced sexual violence
To investigate the factors that might promote wellbeing, we analysed data from within the group of women who reported sexual violence and compared those who reported relatively good general and mental health with those who reported relatively fair to poor health. Factors that were associated with good general health included moderate to high levels of physical activity and social support – specifically emotional support and guidance, and affection and social interaction. Results were similar for factors associated with good mental health. There was a small positive impact for tangible or physical assistance and a positive impact among women born in 1989 to 1995 and 1946 to 1951 for the uptake of mental health consultations.
The findings build on past research that has shown the value of social support in women’s recovery from sexual violence (Dillon et al., 2015; Hunter et al., 2012) by identifying those aspects of support that might be the most valuable. Support offered through mental health services also appears promising in relation to recovery from sexual violence. Physical activity has previously been reported to assist with improvements in mental health (Hu et al., 2020; Yao et al., 2021). Our findings indicate that physical activity might also be useful in promoting better physical and mental health in the context of sexual violence.
Along with these positive impacts we found some factors that may impede wellbeing. High alcohol consumption, current smoking and obesity were found to impede wellbeing, as was difficulty managing on available income. All of these factors had also been found to be more common among women who had experienced sexual violence compared with those who had not. However, the effect sizes of these factors were small in relation to health, suggesting that a focus on the presence of a more strengths-based approach to recovery might be more beneficial for women who have experienced sexual violence than focusing on adverse health behaviours.
Strengths and limitations
This report uses the data from a large ongoing cohort study of Australian women spanning more than 21 years. With over 57,000 women in the study, the repeatedly collected data provide a solid base to investigate the interplay between health, wellbeing and other factors over time at the national level. The surveys have included questions about violence and trauma experienced over the life course, including experiencing violence during childhood, violence perpetrated by a partner and sexual violence. We were able to examine sexual violence across three generations: women born in 1989 to 1995, 1973 to 1978 and 1946 to 1951.
This places the study in a unique position to investigate sexual violence in relation to demographic, social, behavioural and economic factors using longitudinal analyses. This is often not possible as many studies investigating sexual violence are cross-sectional or do not collect comprehensive data on contextual or potentially confounding factors. Due to the rich data that have been collected, we were able to control for key factors in the analyses. Additionally, the survey data are linked to Medicare data, providing an opportunity to examine the impact of sexual violence on healthcare costs over time.
As with all surveys, there were some data limitations that must be noted. While the cohorts are broadly representative of Australian women of the same age (Dobson et al., 2015; Loxton, Tooth, et al., 2018), women who have tertiary qualifications are over-represented and some priority populations are likely to be under-represented (e.g. LGBTQA+ and intersex people and women from CALD backgrounds). It should be noted that, while Aboriginal and Torres Strait Islander women take part in the ALSWH, the data are not currently disaggregated by Indigenous status for historical and ethical reasons.[6] Due to legal and ethical considerations, it is not possible to ask for some specific details about acts of violence. This results in some limitations in the data, including precise timing, which in turn limits the ability to estimate duration of exposure tosexual violence. While this limitation made it difficult to determine the ideal time points for potential interventions, the long-lasting health impact of sexual violence makes this a moot point.
There were some differences in the available data by cohort and not all measurements were available at all time points for all cohorts. However, in several instances, similar measures were used to capture equivalent experiences (e.g. the Kessler Psychological Distress Scale used in the 1989 to 1995 cohort survey is comparable to the SF-36 mental health subscale used in the 1973 to 1978 and 1946 to 1951 cohort surveys). Questions on violence perpetrated by a partner were not available across multiple surveys for women in the 1946 to 1951 cohort; however, these data were consistently available for the 1989 to 1995 and 1973 to 1978 cohorts. Additionally, three topics addressed in the report were limited by low frequencies, which resulted in uncertainty around effect estimates. The low frequencies of women who had had a recent STI, who came from a CALD background or who identified as bisexual resulted in wide confidence intervals around the effectestimates. While PBS data were available prior to 2012, the earlier data excluded claims which were below the co-payment threshold; this restricted use of PBS data to that provided for 2012 onwards. Use of MBS data only includes information on formal health services under this scheme and does not account for informal and community health. Finally, we could not take account of unmeasured variables that warrant further attention – for example, whether women were involved in legal proceedings, the consequences for the perpetrator (e.g. incarceration) and the impact of this on wellbeing. Similarly, while we captured positive social interactions, adverse social interactions subsequent to sexual violence were not captured. These factors warrant future research and consideration.
Implications and recommendations for policy and practice
The National Plan consultation has identified sexual violence as an area in need of more policy development. Our results concur and offer some insight into the types of policy and practice responses that might assist women who have experienced sexual violence.
- A holistic response that takes account of women’s whole lives at both policy and practice levels is needed, given the high prevalence of sexual violence and its multiple impacts. Sexual violence impacts on many facets of women’s lives, including their economic wellbeing, health behaviour, physical health and mental health. Given the high prevalence of sexual violence and its multiple impacts, a holistic response that takes account of women’s whole lives at both the policy and practice level is needed. We recommend that sexual violence be considered a health risk within health policy development at every level of government.The scope of policy and practice responses needs to be expanded to encompass the number of women who have experienced sexual violence. We found that the lifetime prevalence of sexual violence may have been underestimated in previous research. At least one type of sexual violence was reported by 51 percent of women in their late twenties, 34 per cent of women in their early forties and 26 per cent of women in their sixties to early seventies.
- A clear focus on priority populations (e.g. LGBTQA+ and intersex people, women with disability, women from CALD backgrounds) is required in all policies addressing sexual violence. For example, we were able to ascertain that women who identify as lesbian, mainly lesbian or bisexual were at increased risk of sexual violence despite some limitations in the data, and the results clearly showed that women with disability, long-term illness or injury were at particular risk of sexual violence.
- There is a need for a broad, consistent definition of sexual violence. Our broad measures resulted in a much greater data capture of sexual violence and are in keeping with current national conversations concerning consent and current national and international definitions. Further consultation with stakeholder communities is needed, as noted in the next National Plan consultation process.
- Research should take a life course, longitudinal approach to estimating the prevalence of sexual violence. Prevalence of sexual violence differed by generation and over time. With consistent definitions, longitudinal data permit changes in prevalence to be captured and assessed in relation to policy initiatives.
- Service providers should employ a life course approach when delivering services to women who have experienced sexual violence. Health and social care providers have long reported that their clients have experienced violence more than once in their lives. The ALSWH data provide evidence at the population level that this is the case. Women who had experienced childhood sexual violence were more likely to experience violent acts in adulthood.
- Prevention programs and policies should be designed with consideration of potential behavioural drivers. A better understanding of alcohol and other drug uptake and use among women who have experienced sexual violence is necessary. However, the increased likelihood of adverse health behaviours among women who have experienced sexual violence indicates the need for a more nuanced lens in overall prevention program and policy development. For example, the National Obesity Strategy may have scope for the inclusion of trauma-informed policy within its remit, under the section concerned with determinants of health.
- Health and support services for women who have experienced sexual violence should be subsidised or free. There was a consistent association between sexual violence and financial stress. The strong association between sexual violence and poor health outcomes across all generations indicates a need for more health service support but the impact of financial stress might deter service access. It is noteworthy that in the context of sexual violence, better mental health was related to mental health service access.
- Health services can play a key role. Sexual violence was associated with health behaviour and with both mental and physical health outcomes that were long-lasting. Given its high prevalence, primary health practitioners are likely seeing women who have experienced sexual violence on a regular basis. Primary healthcare providers are, therefore, well placed to be the gateway to an intersectoral approach. While some training packages are available for general practitioners, a more coordinated approach is needed both within medical degree programs and as continuing education within the medical field. Furthermore, investment in primary healthcare and referral services will be needed to facilitate an intersectoral response to the health impact of sexual violence.
Directions for future research
Sexual violence has been the subject of a reasonable body of research. However, much of this has been conducted outside of the Australian context. The current report has filled gaps in national knowledge concerning prevalence and the impact of sexual violence on health and wellbeing, findings that underscore the need for a systemic response. More research is needed to expand this evidence base further, to assist with policy and practice development. While beyond the scope of the current report, there remains a need for research on prevention of sexual violence. This section includes the major areas where research is currently needed. Ongoing research is needed to assess the impact of initiatives designed to prevent sexual violence and to evaluate the rollout of programs designed to assist in recovery from sexual violence.
Distinct differences in prevalence were noted between generations, with sexual violence more commonly reported by younger women. There is a need to understand more fully what is driving these differences to assist in accurate prevalence ascertainment across the life course. Earlier work with ALSWH participants has revealed the value of qualitative interviews in understanding how and why women respond to questions about domestic violence (Loxton, Townsend, et al., 2017). This type of qualitative approach is likely to be the most useful in investigating generational differences in responses to questions that ask about sexual violence.
Other factors which may impact the wellbeing of women who have experienced violence include whether or not the woman was involved in legal proceedings and the consequences for the perpetrator (e.g. incarceration). The impact of the involvement of the legal system on women who have experienced sexual violence warrants further investigation.
We were able to ascertain that women who identify as lesbian, mainly lesbian or bisexual and women with disability were at particular risk of sexual violence, but the data were limited so results for women from CALD communities should be interpreted with caution. Research conducted in partnership with communities is needed to adequately describe and understand the contextual factors that influence disclosure of sexual violence, as well as the health and wellbeing of women who have experienced sexual violence and who belong to one or more priority populations.
There is no comprehensive understanding of why women who have experienced sexual violence at one stage of life are more likely to experience sexual and other forms of violence at later life stages. Research is needed in this area to provide the evidence base for policy and practice development, with a view to prevention of multiple experiences of violence over the life course.
The findings for economic wellbeing highlight the impact of sexual violence on education and paid work and the related impact on financial stress. It is easy to see how these factors are interrelated, but it is as yet unclear what could be done to alleviate these burdens. A mixed-methods study that uses qualitative data to investigate the nuances of economic impacts followed by quantitative scenario modelling of potential solutions could reveal potential interventions.
A better understanding of the drivers of adverse health behaviours for women who have experienced sexual violence is needed to inform prevention practice and policy development.
Findings suggested a potential unmet need for health services, and satisfaction with general practitioner services was lower for women who had experienced sexual violence. Long-term physical and mental health impacts and adverse health behaviours underscore the need for nuanced primary healthcare services and appropriate intersectoral referral networks that can address the needs of women who have experienced sexual violence. However, while our research clearly demonstrates the need for such services and provides some insight into what these needs are in a broad sense, the particulars of effective primary healthcare service provision have not been established (Hegarty et al., 2016). More research is needed into effective primary care service provision for women who have experienced sexual violence. Ideally, such research would take a co-production approach to permit the input of clinicians, researchers and women who have experienced sexual violenceto be incorporated into a scalable, testable model of primary healthcare.
Conclusion
Primary prevention is key to alleviating the traumatic and long-term impact of sexual violence; increasing awareness and the current public discussion about consent are promising. Yet, even with this progress, there are many women in our community, more than half of young women, who have already experienced sexual violence. The outcomes are grave and long-lasting, impacting economic security, health and wellbeing. There are reasons for hope – the next National Plan is under development with the promise of a focus on sexual violence, and findings here have shown the value of interpersonal support. Still, there is much work to be done in policy, practice and research, as we have also demonstrated.
The data provide a national picture of life for women who have experienced sexual violence. Findings emphasise the importance of accurate measurement, and the seriousness and longevity of adverse impacts. The results also indicate the need for a comprehensive understanding of and investment in primary healthcare and intersectoral support for women who have experienced sexual violence so that they can enjoy optimal wellbeing and avoid secondary traumatisation.
Author contributions
Deborah Loxton, Natalie Townsend and Peta Forder conceived and designed the research described in this report. The statistical analysis plan was drafted by Peta Forder and Nicholas Egan. Data analysis was conducted by Nicholas Egan. Deborah Loxton, Peta Forder, Nicholas Egan and Natalie Townsend interpreted the results. Isabelle Barnes reviewed relevant literature. Natalie Townsend, Isabelle Barnes and Emma Byrnes designed the summary infographics. All authors drafted, critically reviewed and approved content of the draft report.
References
Aakvaag, H. F., Thoresen, S., Strøm, I. F., Myhre, M., & Hjemdal, O. K. (2019). Shame predicts revictimization in victims of childhood violence: A prospective study of a general Norwegian population sample. Psychological Trauma, 11(1), 43–50. https://doi.org/10.1037/tra0000373
Alaggia, R., Collin-Vézina, D., & Lateef, R. (2017). Facilitators and barriers to child sexual abuse (CSA) disclosures: A research update (2000–2016). Trauma, Violence, & Abuse, 20(2), 260–283. https://doi.org/10.1177/1524838017697312
Austin, A. E., & Short, N. A. (2020). Sexual violence, mental health, and prescription opioid use and misuse. American Journal of Preventive Medicine, 59(6), 818–827. https://doi.org/10.1016/j.amepre.2020.06.019
Australia’s National Research Organisation for Women’s Safety. (2019). Intimate partner sexual violence: Research synthesis (2nd Ed.; ANROWS Insights, 08/2019). ANROWS
Australian Bureau of Statistics. (2012). Information paper: Use of the Kessler Psychological Distress Scale in ABS health surveys, Australia, 2007–08. https://www.abs.gov.au/ausstats/abs@.nsf/lookup/4817.0.55.001chapter92007-08
Australian Bureau of Statistics. (2017). Personal Safety Survey, Australia, 2016, ABS cat. no. 4906.0. https://www.abs.gov.au/ausstats/abs@.nsf/mf/4906.0
Australian Bureau of Statistics. (2021). Understanding full-time and part-time work. https://www.abs.gov.au/articles/understanding-full-time-and-part-time-work
Australian Government Department of Health. (2019). Pharmaceutical Benefits Scheme collection of under co-payment data. https://www.pbs.gov.au/info/statistics/under-co-payment/under-co-payment-data
Australian Institute of Health and Welfare. (2018). Family, domestic and sexual violence in Australia, 2018. https://www.aihw.gov.au/reports/domestic-violence/family-domestic-sexual-violence-in-australia-2018
Australian Institute of Health and Welfare. (2019a). Family, domestic and sexual violence in Australia: Continuing the national story. https://www.aihw.gov.au/getmedia/b0037b2d-a651-4abf-9f7b-00a85e3de528/aihw-fdv3-FDSV-in-Australia-2019.pdf.aspx?inline=true
Australian Institute of Health and Welfare. (2019b). People with disability in Australia. https://www.aihw.gov.au/reports/disability/people-with-disability-in-australia
Australian Institute of Health and Welfare. (2020). Sexual assault in Australia, Cat. no. FDV 5. https://www.aihw.gov.au/getmedia/0375553f-0395-46cc-9574-d54c74fa601a/aihw-fdv-5.pdf.aspx?inline=true
Australian Longitudinal Study on Women’s Health. (2019). Technical report #42. https://alswh.org.au/wp-content/uploads/2020/10/ALSWH-Technical-Report-42_Final_March-2020.pdf
Bacchus, L. J., Ranganathan, M., Watts, C., & Devries, K. (2018). Recent intimate partner violence against women and health: A systematic review and meta-analysis of cohort studies. BMJ Open, 8(7), e019995. https://doi.org/10.1136/bmjopen-2017-019995
Baigorria, J., Warmling, D., Magno Neves, C., Delziovo, C. R., & Salema Coelho, E. B. (2017). Prevalence and associated factors with sexual violence against women: Systematic review. Revista de salud publica (Bogota, Colombia), 19(6), 818–826. https://doi.org/10.15446/rsap.v19n6.65499
Baker, M. R., Frazier, P. A., Greer, C., Paulsen, J. A., Howard, K., Meredith, L. N., Anders, S. L., & Shallcross, S. L. (2016). Sexual victimization history predicts academic performance in college women. Journal of Counseling Psychology, 63(6), 685–692. https://doi.org/10.1037/cou0000146
Bidarra, Z. S., Lessard, G., & Dumont, A. (2016). Co-occurrence of intimate partner violence and child sexual abuse: Prevalence, risk factors and related issues. Child Abuse & Neglect, 55, 10–21. https://doi.org/10.1016/j.chiabu.2016.03.007
Black, M. C., Basile, K.C., Breiding, M.J., Smith, S.G., Walters, M.L., Merrick, M.T., Chen, J., & Stevens, M.R. (2011). The National Intimate Partner and Sexual Violence Survey (NISVS): 2010 summary report. https://www.cdc.gov/ViolencePrevention/pdf/NISVS_Report2010-a.pdf
Bone, C. W., Goodfellow, A. M., Vahidi, M., & Gelberg, L. (2018). Prevalence of sexual violence and its association with depression among male and female patients with risky drug use in urban federally qualified health centers. Journal of Urban Health, 95(1), 111–115. https://doi.org/10.1007/s11524-017-0213-7
Bonomi, A., Nichols, E., Kammes, R., & Green, T. (2018). Sexual violence and intimate partner violence in college women with a mental health and/or behavior disability. Journal of Women’s Health, 27(3), 359–368. https://doi.org/10.1089/jwh.2016.6279
Bradel, L., Rosenbaum, A., & Orcutt, H. (2019). The prevalence and co-occurrence of the forms of violence against women. Journal of Aggression, Maltreatment & Trauma, 28(7), 870–887. https://doi.org/10.1080/10926771.2018.1463338
Breiding, M.J. (2015). Prevalence and characteristics of sexual violence, stalking, and intimate partner violence victimization: National Intimate Partner and Sexual Violence Survey, United States, 2011. American Journal of Public Health, 105(4), e11–e12.
Brener, N. D., McMahon, P. M., Warren, C. W., & Douglas, K. A. (1999). Forced sexual intercourse and associated health-risk behaviors among female college students in the United States. Journal of Consulting and Clinical Psychology, 67(2), 252–259. https://doi.org/10.1037/0022-006X.67.2.252
Brown, W. J., Bauman, A., Bull, F., & Burton, N. W. (2013). Development of evidence-based physical activity recommendations for adults (18–64 years). Australian Government Department of Health and Aged Care https://www.health.gov.au/resources/publications/development-of-evidence-based-physical-activity-for-adults-18-to-64-years
Brown, W. J., Bryson, L., Byles, J. E., Dobson, A. J., Lee, C., Mishra, G., & Schofield, M. (1998). Women’s Health Australia: Recruitment for a national longitudinal cohort study. Women & Health, 28(1), 23–40.
Campo, M., & Tayton, S. (2015). Intimate partner violence in lesbian, gay, bisexual, trans, intersex and queer communities: Key issues, CFCA Practitioner Resource. Australian Institute of Family Studies. https://aifs.gov.au/cfca/publications/intimate-partner-violence-lgbtiq-communities
Carr, A., Duff, H., & Craddock, F. (2020). A systematic review of the outcome of child abuse in long-term care. Trauma, Violence, & Abuse, 21(4), 660–677. https://doi.org/10.1177/1524838018789154
Clark, C. J., Spencer, R. A., Everson-Rose, S. A., Brady, S. S., Mason, S. M., Connett, J. E., Henderson, K. M., To, M., & Suglia, S. F. (2014). Dating violence, childhood maltreatment, and BMI from adolescence to young adulthood. Pediatrics, 134(4), 678–685. https://doi.org/10.1542/peds.2014-1179
Coles, J., Lee, A., Taft, A., Mazza, D., & Loxton, D. (2014). Childhood sexual abuse and its association with adult physical and mental health: Results from a national cohort of young Australian women. Journal of Interpersonal Violence, 30(11), 1929–1944. https://doi.org/10.1177/0886260514555270
Coles, J., Lee, A., Taft, A., Mazza, D., & Loxton, D. (2015). General practice service use and satisfaction among female survivors of childhood sexual abuse. Australian Family Physician, 44(1–2), 71–76.
Conley, A. H., Overstreet, C. M., Hawn, S. E., Kendler, K. S., Dick, D. M., & Amstadter, A. B. (2017). Prevalence and predictors of sexual assault among a college sample. Journal of American College Health, 65(1), 41–49. https://doi.org/10.1080/07448481.2016.1235578
Cox, P. (2015). Sexual assault and domestic violence in the context of co-occurrence and re-victimisation: State of knowledge paper (ANROWS Landscapes, 13/2015). ANROWS https://www.anrows.org.au/publication/sexual-assault-and-domestic-violence-in-the-context-of-co-occurrence-and-re-victimisation-state-of-knowledge-paper/
Craner, J. R., Martinson, A. A., Sigmon, S. T., & McGillicuddy, M. L. (2015). Prevalence of sexual trauma history using behaviorally specific methods of assessment in first year college students. Journal of Child Sexual Abuse, 24(5), 484–505. https://doi.org/10.1080/10538712.2015.1026014
Davidson, S. K., Dowrick, C. F., & Gunn, J. M. (2016). Impact of functional and structural social relationships on two year depression outcomes: A multivariate analysis. Journal of Affective Disorders, 193, 274–281. https://doi.org/10.1016/j.jad.2015.12.025
Department of Social Services. (2019). Fourth Action Plan: National Plan to Reduce Violence against Women and their Children 2010–2022. https://www.dss.gov.au/women-publications-articles-reducing-violence/fourth-action-plan
Dillon, G., Hussain, R., & Loxton, D. (2015). Intimate partner violence in the young cohort of the Australian longitudinal study on women’s health: urban/rural comparison and demographic associations. Advances in Mental Health, 13(1), 18–29. https://doi.org/10.1080/18374905.2015.1039752
Dobson, A. J., Hockey, R., Brown, W. J., Byles, J. E., Loxton, D. J., McLaughlin, D., Tooth, L. R., & Mishra, G. D. (2015). Cohort profile update: Australian Longitudinal Study on Women’s Health. International Journal of Epidemiology, 44(5), 1547–1547f. https://doi.org/10.1093/ije/dyv110
Elder, G. H., Johnson, M. K., & Crosnoe, R. (2003). The emergence and development of life course theory. In J. T. Mortimer & M. J. Shanahan (Eds.), Handbook of the life course (pp. 3–19). Springer US. https://doi.org/10.1007/978-0-306-48247-2_1
Ellsberg, M., Arango, D. J., Morton, M., Gennari, F., Kiplesund, S., Contreras, M., & Watts, C. (2015). Prevention of violence against women and girls: What does the evidence say? Lancet, 385(9977), 1555–1566. https://doi.org/10.1016/s0140-6736(14)61703-7
Felitti, V. J., Anda, R. F., Nordenberg, D., Williamson, D. F., Spitz, A. M., Edwards, V., Koss, M. P., & Marks, J. S. (1998). Relationship of childhood abuse and household dysfunction to many of the leading causes of death in adults: The Adverse Childhood Experiences (ACE) Study. American Journal of Preventive Medicine, 14(4), 245–258. https://doi.org/10.1016/s0749-3797(98)00017-8
Finkelhor, D., Shattuck, A., Turner, H., & Hamby, S. (2014). The lifetime prevalence of child sexual abuse and sexual assault assessed in late adolescence. Journal of Adolescent Health, 55. https://doi.org/10.1016/j.jadohealth.2013.12.026
Fitzgerald, D. (2022). GP Satisfaction. ALSWH https://alswh.org.au/wp-content/uploads/2020/08/DDSSection2.4GPSatisfaction_1.pdf
Gartland, D., Woolhouse, H., Giallo, R., McDonald, E., Hegarty, K., Mensah, F., Herrman, H., & Brown, S. J. (2016). Vulnerability to intimate partner violence and poor mental health in the first 4-year postpartum among mothers reporting childhood abuse: An Australian pregnancy cohort study. Archives of Women’s Mental Health, 19(6), 1091–1100. https://doi.org/10.1007/s00737-016-0659-8
González-Chica, D. A., Licinio, J., Musker, M., Wong, M., Bowden, J., Hay, P., Chittleborough, C., & Stocks, N. (2019). Bullying and sexual abuse and their association with harmful behaviours, antidepressant use and health-related quality of life in adulthood: A population-based study in South Australia. BMC Public Health, 19(1), 26. https://doi.org/10.1186/s12889-018-6367-8
Graham, A. C., Mallinson, R. K., Krall, J. R., & Annan, S. L. (2019). Sexual assault, campus resource use, and psychological distress in undergraduate women. Journal of Interpersonal Violence, 36(21-22), 10361–10382. https://doi.org/10.1177/0886260519884689
Hailes, H. P., Yu, R., Danese, A., & Fazel, S. (2019). Long-term outcomes of childhood sexual abuse: An umbrella review. Lancet Psychiatry, 6(10), 830–839. https://doi.org/10.1016/s2215-0366(19)30286-x
Harris, M. L., Loxton, D., Sibbritt, D. W., & Byles, J. E. (2013). The influence of perceived stress on the onset of arthritis in women: Findings from the Australian Longitudinal Study on Women’s Health. Annals of Behavioral Medicine, 46(1), 9–18. https://doi.org/10.1007/s12160-013-9478-6
Hegarty, K., Tarzia, L., Hooker, L., & Taft, A. (2016). Interventions to support recovery after domestic and sexual violence in primary care. International Review of Psychiatry, 28(5), 519–532. https://doi.org/10.1080/09540261.2016.1210103
Hellman, A. (2014). Examining sexual assault survival of adult women: responses, mediators, and current theories. Journal of Forensic Nursing, 10(3), 175–184 https://doi.org/10.1097/jfn.0000000000000037
Herbert, A., Heron, J., Barter, C., Szilassy, E., Barnes, M., Howe, L., Feder, G., & Fraser, A. (2021). Risk factors for intimate partner violence and abuse among adolescents and young adults: Findings from a UK population-based cohort. Wellcome Open Research, 5(176). https://doi.org/10.12688/wellcomeopenres.16106.1
Heywood, W., Myers, P., Powell, A., Meikle, G., & Nguyen, D. (2022). Report on the prevalence of sexual harassment and sexual assault among university students in 2021, National Student Safety Survey [Report]. Social Research Centre. https://apo.org.au/node/317074
Hu, M. X., Turner, D., Generaal, E., Bos, D., Ikram, M. K., Ikram, M. A., Cuijpers, P., & Penninx, B. W. J. H. (2020). Exercise interventions for the prevention of depression: A systematic review of meta-analyses. BMC Public Health, 20(1), 1255. https://doi.org/10.1186/s12889-020-09323-y
Hugo Centre for Migration and Population Research. (2018). Accessibility/Remoteness Index of Australia (ARIA). The University of Adelaide. https://able.adelaide.edu.au/hugo-centre/services/aria
Hunter, B. A., Robison, E., & Jason, L. A. (2012). Characteristics of sexual assault and disclosure among women in substance abuse recovery homes. Journal of Interpersonal Violence, 27(13), 2627–2644. https://doi.org/10.1177/0886260512436389
Kennedy, A. C., Bybee, D., Moylan, C. A., McCauley, H. L., & Prock, K. A. (2021). Predictors of sexual violence across young women’s relationship histories. Journal of Interpersonal Violence, 36(11–12), Np5944–np5964. https://doi.org/10.1177/0886260518811439
Kessler, R. C., Andrews, G., Colpe, L. J., Hiripi, E., Mroczek, D. K., Normand, S. L. T., Walters, E. E., & Zaslavsky, A. M. (2002). Short screening scales to monitor population prevalences and trends in non-specific psychological distress. Psychological Medicine, 32(6), 959–956. https://doi.org/10.1017/S0033291702006074
Khadr, S., Clarke, V., Wellings, K., Villalta, L., Goddard, A., Welch, J., Bewley, S., Kramer, T., & Viner, R. (2018). Mental and sexual health outcomes following sexual assault in adolescents: A prospective cohort study. Lancet Child & Adolescent Health, 2(9), 654–665. https://doi.org/10.1016/s2352-4642(18)30202-5
Kisely, S., Strathearn, L., & Najman, J. M. (2020). Child maltreatment and mental health problems in 30-year-old adults: A birth cohort study. Journal of Psychiatric Research, 129, 111–117. https://doi.org/10.1016/j.jpsychires.2020.06.009
Lewis, R. J., Padilla, M. A., Milletich, R. J., Kelley, M. L., Winstead, B. A., Lau-Barraco, C., & Mason, T. B. (2015). Emotional distress, alcohol use, and bidirectional partner violence among lesbian women. Violence Against Women, 21(8), 917–938. https://doi.org/10.1177/1077801215589375
Loxton, D., Dolja-Gore, X., Anderson, A. E., & Townsend, N. (2017). Intimate partner violence adversely impacts health over 16 years and across generations: A longitudinal cohort study. PLoS One, 12(6), e0178138. https://doi.org/10.1371/journal.pone.0178138
Loxton, D., Powers, J., Anderson, A. E., Townsend, N., Harris, M. L., Tuckerman, R., Pease, S., Mishra, G., & Byles, J. (2015). Online and offline recruitment of young women for a longitudinal health survey: Findings From the Australian Longitudinal Study on Women’s Health 1989-95 cohort. Journal of Medical Internet Research, 17(5), e109. https://doi.org/10.2196/jmir.4261
Loxton, D., Powers, J., Fitzgerald, D., Forder, P., Anderson, A., Taft, A., & Hegarty, K. (2013). The Community Composite Abuse Scale: Reliability and validity of a measure of intimate partner violence in a community survey from the ALSWH. Journal of Women’s Health, Issues and Care, 2(4), 1–7. https://doi.org/10.4172/2325-9795.1000115
Loxton, D., Tooth, L., Harris, M. L., Forder, P. M., Dobson, A., Powers, J., Brown, W., Byles, J., & Mishra, G. (2018). Cohort profile: The Australian Longitudinal Study on Women’s Health (ALSWH) 1989–95 cohort. International Journal of Epidemiology, 47(2), 391–392e. https://doi.org/10.1093/ije/dyx133
Loxton, D., Townsend, N., Barnes, I., & Forder, P. (2019). Family, Domestic and Sexual Violence: Mini report of infographics –Findings from the Australian Longitudinal Study on Women’s Health. Australian Government Department of Social Services.
Loxton, D., Townsend, N., Cavenagh, D., & Green, L. (2017). Measuring domestic violence in longitudinal research. Australian Government Department of Social Services. https://plan4womenssafety.dss.gov.au/wp-content/uploads/2018/07/Measuring-Domestic-Violence-in-Longitudinal-Research.pdf
Loxton, D., Townsend, N., Forder, P., & Coombe, J. (2018). Domestic violence, risk factors and health: Report prepared for the Australian Government Department of Social Services. Australian Government Department of Social Services. https://plan4womenssafety.dss.gov.au/wp-content/uploads/2019/03/domestic-violence-risk-factors-and-health-2018.pdf
Loya, R. (2015). Rape as an economic crime: The impact of sexual violence on survivors’ employment and economic well-being. Journal of Interpersonal Violence, 30(16), 2793–2813. https://doi.org/10.1177/0886260514554291
Lysova, A., Dim, E., & Dutton, D. (2019). Prevalence and consequences of intimate partner violence in canada as measured by the National Victimization Survey. Partner Abuse, 10(2), 199–221. https://doi.org/10.1891/1946-6560.10.2.199
Machado, C., Martins, C., & Caridade, S. (2014). Violence in intimate relationships: A comparison between married and dating couples. Journal of Criminology, 2014, 897093. https://doi.org/10.1155/2014/897093
Massetti, G. M., Townsend, J. S., Thomas, C. C., Basile, K. C., & Richardson, L. C. (2018). Healthcare access and cancer screening among victims of intimate partner violence. Journal of Women’s Health, 27(5), 607–614. https://doi.org/10.1089/jwh.2017.6402
Mathews, B., Bromfield, L., Walsh, K., Cheng, Q., & Norman, R. E. (2017). Reports of child sexual abuse of boys and girls: Longitudinal trends over a 20-year period in Victoria, Australia. Child Abuse & Neglect, 66, 9–22. https://doi.org/10.1016/j.chiabu.2017.01.025
Melka, A., Chojenta, C., Holliday, E., & Loxton, D. (2019). Adverse childhood experiences and electronic cigarette use among young Australian women. Preventive Medicine, 126, 105759. https://doi.org/10.1016/j.ypmed.2019.105759
Merrick, M. T., Ford, D. C., Ports, K. A., & Guinn, A. S. (2018). Prevalence of adverse childhood experiences from the 2011–2014 behavioral risk factor surveillance system in 23 states. JAMA Pediatrics, 172(11), 1038–1044. https://doi.org/10.1001/jamapediatrics.2018.2537
Miller-Graff, L. E., Howell, K. H., Grein, K., & Keough, K. (2021). Women’s cigarette and marijuana use in pregnancy: Identifying the role of past versus recent violence exposure. Journal of Interpersonal Violence, 36(7–8), Np3982–np3998. https://doi.org/10.1177/0886260518779068
Mills, R., Kisely, S., Alati, R., Strathearn, L., & Najman, J. (2016). Self-reported and agency-notified child sexual abuse in a population-based birth cohort. Journal of Psychiatric Research, 74, 87–93. https://doi.org/10.1016/j.jpsychires.2015.12.021
Mishra, G., Hockey, R., Powers, J., Loxton, D., Tooth, L., Rowlands, I., Byles, J., & Dobson, A. J. (2014). Recruitment via the internet and social networking sites: The 1989–1995 cohort of the Australian Longitudinal Study on Women’s Health. Journal of Medical Internet Research, 16(12), e279. https://doi.org/10.2196/jmir.3788
Mokdad, A. H., Forouzanfar, M. H., Daoud, F., Mokdad, A. A., El Bcheraoui, C., Moradi-Lakeh, M., Kyu, H. H., Barber, R. M., Wagner, J., Cercy, K., Kravitz, H., Coggeshall, M., Chew, A., O’Rourke, K. F., Steiner, C., Tuffaha, M., Charara, R., Al-Ghamdi, E. A., Adi, Y., … Murray, C. J. (2016). Global burden of diseases, injuries, and risk factors for young people’s health during 1990–2013: A systematic analysis for the Global Burden of Disease Study 2013. Lancet, 387(10036), 2383–2401. https://doi.org/10.1016/s0140-6736(16)00648-6
Mørk, T., Andersen, P. T., & Taket, A. (2014). Barriers among Danish women and general practitioners to raising the issue of intimate partner violence in general practice: a qualitative study. BMC Women’s Health, 14, 74. https://doi.org/10.1186/1472-6874-14-74
Moulding, N., Franzway, S., Wendt, S., Zufferey, C., & Chung, D. (2021). Rethinking women’s mental health after intimate partner violence. Violence Against Women, 27(8), 1064–1090. https://doi.org/10.1177/1077801220921937
Muldoon, K., Smith, G., Talarico, R., Heimerl, M., McLean, C., Sampsel, K., & Manuel, D. (2019). A 15-year population-based investigation of sexual assault cases across the province of Ontario, Canada, 2002–2016. American Journal of Public Health, 109(9), 1280–1287. https://doi.org/10.2105/AJPH.2019.305179
Nemeth, J. M., Bonomi, A. E., Lu, B., Lomax, R. G., & Wewers, M. E. (2016). Risk factors for smoking in rural women: The role of gender-based sexual and intimate partner violence. Journal of Women’s Health, 25(12), 1282–1291. https://doi.org/10.1089/jwh.2015.5640
Neves, A., & Almeida, I. (2020). Beliefs about intimate partner violence: Gender and generation effects. In Psychology and law: Research for practice (pp. 63–74). Sciendo. https://doi.org/10.2478/9788395669682-006
Nikischer, A. B. (2014). Dreams deferred: The impact of sexual assault during adolescence on the educational outcomes and life choices of women. Adult Education Research Conference. https://newprairiepress.org/aerc/2014/papers/58,
Norman, G. R., Sloan, J. A., & Wyrwich, K. W. (2003). Interpretation of changes in health-related quality of life: The remarkable universality of half a standard deviation. Medical Care, 41(5), 582–592. https://doi.org/10.1097/01.MLR.0000062554.74615.4C
Öberg, M., Skalkidou, A., & Heimer, G. (2019). Experiences of sexual violence among women seeking services at a family planning unit in Sweden. Upsala Journal of Medical Sciences, 124(2), 135–139. https://doi.org/10.1080/03009734.2019.1604587
Öberg, M., Skalkidou, A., Heimer, G., & Lucas, S. (2021). Sexual violence against women in Sweden: Associations with combined childhood violence and sociodemographic factors. Scandinavian Journal of Public Health, 49(3), 292–300. https://doi.org/10.1177/1403494820939015
Oram, S., Khalifeh, H., & Howard, L. M. (2017). Violence against women and mental health. The Lancet Psychiatry, 4(2), 159–170. https://doi.org/10.1016/s2215-0366(16)30261-9
Parliament of Australia. (2006). Measuring domestic violence and sexual assault against women. https://www.aph.gov.au/about_parliament/parliamentary_departments/parliamentary_library/publications_archive/archive/violenceagainstwomen
Pols, R. G., Hawks, D., National Health and Medical Research Council (Australia), & National Health and Medical Research Council (Australia) Health Care Committee. (1992). Is there a safe level of daily consumption of alcohol for men and women? Recommendations regarding responsible drinking behaviour. Australian Government Publication Service.
Rees, S., Simpson, L., McCormack, C. A., Moussa, B., & Amanatidis, S. (2019). Believe #metoo: Sexual violence and interpersonal disclosure experiences among women attending a sexual assault service in Australia: A mixed-methods study. BMJ Open, 9(7), e026773. https://doi.org/10.1136/bmjopen-2018-026773
Reingle Gonzalez, J. M., Jetelina, K. K., Olague, S., & Wondrack, J. G. (2018). Violence against women increases cancer diagnoses: Results from a meta-analytic review. Preventive Medicine, 114, 168–179. https://doi.org/10.1016/j.ypmed.2018.07.008
Relyea, M., & Ullman, S. E. (2017). Predicting sexual assault revictimization in a longitudinal sample of women survivors: Variation by type of assault. Violence Against Women, 23(12), 1462–1483. https://doi.org/10.1177/1077801216661035
Sanz-Barbero, B., Barón, N., & Vives-Cases, C. (2019). Prevalence, associated factors and health impact of intimate partner violence against women in different life stages. PLoS One, 14(10), e0221049. https://doi.org/10.1371/journal.pone.0221049
Sherbourne, C. D., & Stewart, A. L. (1991). The MOS social support survey. Social Science and Medicine, 32(6), 705–714. https://doi.org/10.1016/0277-9536(91)90150-b
Showalter, K. (2016). Women’s employment and domestic violence: A review of the literature. Aggression and Violent Behavior, 31, 37–47. https://doi.org/10.1016/j.avb.2016.06.017
Sigurvinsdottir, R., & Ullman, S. E. (2016). Sexual orientation, race, and trauma as predictors of sexual assault recovery. Journal of Family Violence, 31(7), 913–921. https://doi.org/10.1007/s10896-015-9793-8
Silva, F. C. d., Monge, A., Landi, C. A., Zenardi, G. A., Suzuki, D. C., & Vitalle, M. S. d. S. (2020). The effects of sexual violence experienced in childhood and adolescence on undergraduate students. Revista de saude publica, 54, 134–134. https://doi.org/10.11606/s1518-8787.2020054002576
Stark, M., Kirk, A., & Bruhn, R. (2012). Generational differences as a determinant of women’s perspectives on commitment. Adultspan Journal, 11. https://doi.org/10.1002/j.2161-0029.2012.00010.x
Stensland, S., Thoresen, S., Wentzel-Larsen, T., & Dyb, G. (2015). Interpersonal violence and overweight in adolescents: The HUNT study. Scandinavian Journal of Public Health, 43(1), 18–26. https://doi.org/10.1177/1403494814556176
Sutherland, M. A., Fantasia, H. C., & Hutchinson, M. K. (2016). Screening for intimate partner and sexual violence in college women: Missed opportunities. Women’s Health Issues, 26(2), 217–224. https://doi.org/10.1016/j.whi.2015.07.008
Szalacha, L. A., Hughes, T. L., McNair, R., & Loxton, D. (2017). Mental health, sexual identity, and interpersonal violence: Findings from the Australian Longitudinal Women’s Health Study. BMC Women’s Health, 17(1), 94. https://doi.org/10.1186/s12905-017-0452-5
Tarzia, L., Maxwell, S., Valpied, J., Novy, K., Quake, R., & Hegarty, K. (2017). Sexual violence associated with poor mental health in women attending Australian general practices. Australian and New Zealand Journal of Public Health, 41(5), 518–523. https://doi.org/10.1111/1753-6405.12685
Tarzia, L., Thuraisingam, S., Novy, K., Valpied, J., Quake, R., & Hegarty, K. (2018). Exploring the relationships between sexual violence, mental health and perpetrator identity: A cross-sectional Australian primary care study. BMC Public Health, 18(1), 1410. https://doi.org/10.1186/s12889-018-6303-y
Taylor, J., & Shrive, J. (2021). “I thought it was just a part of life”: Understanding the scale of violence committed against women in the UK since birth. Victim Focus. https://irp.cdn-website.com/f9ec73a4/files/uploaded/Key-Facts-Document-VAWG-VictimFocus-2021a.pdf
Taylor, S.C., Pugh J., Goodwach R., & Coles J. (2012). Sexual trauma in women: The importance of identifying a history of sexual violence. Australian Family Physician, 41(7), 538–541. https://doi.org/10.3316/informit.582009099454887
Ussher, J. M., Hawkey, A., Perz, J., Liamputtong, P., Marjadi, B., Schmied, V., Dune, T., Sekar, J. A., Ryan, S., Charter, R., Thepsourinthone, J., Noack-Lundberg, K., & Brook, E. (2020). Crossing the line: Lived experience of sexual violence among trans women of colour from culturally and linguistically diverse (CALD) backgrounds in Australia (Research report, 14/2020). https://20ian81kynqg38bl3l3eh8bf-wpengine.netdna-ssl.com/wp-content/uploads/2019/01/RP.17.03-Experiences-of-trans_women-and-DV_RR.1.pdf
Walsh, K., Gilmore, A. K., Schumacher, J. A., Coffey, S. F., Frazier, P. A., Ledray, L., Acierno, R., Ruggiero, K. J., Kilpatrick, D. G., & Resnick, H. S. (2020). Post-sexual assault cigarette smoking: Findings from a randomized clinical trial of a video-based intervention. Addictive Behaviors, 100, 106121. https://doi.org/10.1016/j.addbeh.2019.106121
Ware, J. E., & Sherbourne, C. D. (1992). The MOS 36-Item Short-Form Health Survey (SF-36): Conceptual framework and item selection. Medical Care, 30(6), 473–483.
Watson-Johnson, L. C., Townsend, J. S., Basile, K. C., & Richardson, L. C. (2012). Cancer screening and history of sexual violence victimization among US adults. Journal of Women’s Health, 21(1), 17–25. https://doi.org/10.1089/jwh.2011.2751
Willis, M. (2011). Non-disclosure of violence in Australian Indigenous communities. Trends & issues in crime and criminal justice. Australian Institute of Criminology. https://www.aic.gov.au/publications/tandi/tandi405
Wincentak, K., Connolly, J., & Card, N. (2016). Teen dating violence: A meta-analytic review of prevalence rates. Psychology of Violence, 7(2), 224–241. https://doi.org/10.1037/a0040194
Woolhouse, H., Gartland, D., Mensah, F., & Brown, S. J. (2015). Maternal depression from early pregnancy to 4 years postpartum in a prospective pregnancy cohort study: Implications for primary health care. BJOG, 122(3), 312–321. https://doi.org/10.1111/1471-0528.12837
World Health Organization. (2014). Child maltreatment global estimates. https://apps.who.int/gho/data/view.main.VIOLENCECHILDMALTREATMENTv
World Health Organization. (2017). Violence against women. https://www.who.int/news-room/fact-sheets/detail/violence-against-women
World Health Organization, Department of Reproductive Health and Research, London School of Hygiene and Tropical Medicine, & South African Medical Research Council. (2013). Global and regional estimates of violence against women: Prevalence and health effects of intimate partner violence and nonpartner sexual violence. WHO. https://www.who.int/reproductivehealth/publications/violence/9789241564625/en/
World Health Organization, & London School of Hygiene and Tropical Medicine. (2010). Preventing intimate partner and sexual violence against women: Taking action and generating evidence. WHO. https://www.who.int/reproductivehealth/publications/violence/9789241564007/en/
Yang, J., Miller, T. R., Zhang, N., LeHew, B., & Peek-Asa, C. (2014). Incidence and cost of sexual violence in Iowa. American Journal of Preventive Medicine, 47(2), 198–202. https://doi.org/10.1016/j.amepre.2014.04.005
Yao, L., Fang, H., Leng, W., Li, J., & Chang, J. (2021). Effect of aerobic exercise on mental health in older adults: A meta-analysis of randomized controlled trials [Review]. Frontiers in Psychiatry, 12. https://doi.org/10.3389/fpsyt.2021.748257
Ybarra, M. L., Espelage, D. L., Langhinrichsen-Rohling, J., Korchmaros, J. D., & Boyd, d. (2016). Lifetime prevalence rates and overlap of physical, psychological, and sexual dating abuse perpetration and victimization in a national sample of youth. [References]. Archives of Sexual Behavior, 45(5), 1083–1099. https://doi.org/10.1007/s10508-016-0748-9
Yon, Y., Ramiro-Gonzalez, M., Mikton, C. R., Huber, M., & Sethi, D. (2019). The prevalence of elder abuse in institutional settings: A systematic review and meta-analysis. European Journal of Public Health, 29(1), 58–67. https://doi.org/10.1093/eurpub/cky093
Zou, G. (2004). A modified poisson regression approach to prospective studies with binary data. American Journal of Epidemiology, 159(7), 702–706. https://doi.org/10.1093/aje/kwh090
Endnotes
-
For the purposes of this report, a life course approach examines a person’s life history and investigates, for example, how early life events influence later life events and decisions (Elder et al., 2003).
-
For details, please see alswh.org.au/for-researchers/indigenous-policy
-
For more information on measures, please see https://alswh.org.au/for-data-users/data-documentation
-
Women did not need to have completed all surveys to be included in these analyses. An experience of sexual violence was considered enduring, so those women who indicated that they had experienced sexual violence in adulthood in one survey were included as having experienced sexual violence in following surveys.
-
Note that the ALSWH is under-representative of women from CALD backgrounds.
-
For details please see alswh.org.au/for-researchers/indigenous-policy