
Research report Violence against women in Australia: Additional analysis of the Australian Bureau of Statistics’ Personal Safety Survey, 2012: Research report
Horizons
Research report | August 2016
Issue 01 | 2015 Rev. ed.
Read the PDF version of this report
ANROWS acknowledgement
This material was produced with funding from the Australian Government and the Australian state and territory governments. Australia’s National Research Organisation for Women’s Safety (ANROWS) gratefully acknowledges the financial and other support it has received from these governments, without which this work would not have been possible. The findings and views reported in this paper are those of the authors and cannot be attributed to the Australian Government, or any Australian state or territory government.
Acknowledgement of Country
ANROWS acknowledges the traditional owners of the land across Australia on which we work and live. We pay our respects to Aboriginal and Torres Strait Islander elders past, present and future; and we value Aboriginal and Torres Strait Islander history, culture and knowledge.
© ANROWS 2016
Published by
Australia’s National Research Organisation for Women’s Safety Limited (ANROWS)
PO Box Q389, Queen Victoria Building NSW 1230 | www.anrows.org.au | Phone +61 2 8374 4000
ABN 67 162 349 171
Violence against women: Additional analysis of the Australian Bureau of Statistics’ Personal Safety Survey, 2012 / Peta Cox.
Sydney : ANROWS, c2016.
Pages ; 30 cm. (ANROWS Horizons: 01/2015 Rev. ed.)
I. Violence against women – Australia – Statistics. II. Sexual abuse victims – Australia -Statistics. III. Violence – Australia – Statistics.
I. Cox, Peta.
First published October 2015 (ANROWS).
This revised edition published August 2016.
978-1-925372-42-7 (print) 978-1-925372-43-4 (online)
2205-8907 (print) 2205-8923 (online)
Creative Commons Licence
Attribution Non-Commercial

CC BY-NC
This licence lets others distribute, remix and build upon the work, but only if it is for non-commercial purposes and they credit the original creator/s (and any other nominated parties). They do not have to license their Derivative Works on the same terms.
Version 3.0 (CC Australia ported licence): View CC BY-NC Australia Licence Deed | View CC BY-NC 3.0 Australia Legal Code
Version 4.0 (international licence): View CC BY-NC 4.0 Licence Deed | View CC BY-NC 4.0 Legal Code
Design
Erin Snelgrove, GOOD MATTERS.
Author acknowledgement
I wish to thank the staff at the ABS for their exemplary professionalism and ongoing support for this project. I also wish to thank the two anonymous reviewers; Ms Heather Nancarrow (ANROWS CEO); Emeritus Professor Anne R. Edwards AO (ANROWS Chair); and Dr Kristin Diemer for their valuable feedback in and input into the draft of this paper.
My sincere thanks also to the ANROWS team for their support and assistance throughout this project, in particular to Dr Mayet Costello, Dr Ann Deslandes, Ms Lisa Gordon, Ms Jess Gregory, Ms Rebecca Gyles, Ms Huette Lam, Dr Erin Mackay, Dr Trishima Mitra-Kahn, and Ms Jen Novak. Finally, thanks to Ms Erin Snelgrove for her generosity and creativity in the design of the report.
This work is part of the ANROWS Horizons series. ANROWS Horizons (Research reports) are in-depth reports on empirical research produced under ANROWS’s Research Program.
This report addresses work covered in ANROWS research project 1.1 ” Prevalence and incidence of violence against women. Australian Bureau of Statistics Personal Safety Survey 2012 additional data analysis on violence against women”. Please consult the ANROWS website for more information on this project. In addition to this paper, an ANROWS Compass is also available as part of this project.
Suggested citation
Cox, P. (2016). Violence against women: Additional analysis of the Australian Bureau of Statistics’ Personal Safety Survey, 2012 (ANROWS Horizons: 01/2015 Rev. ed.). Sydney: ANROWS.
Contents
Violence experienced by women and men
What is the Personal Safety Survey?
Respondent, survey participant or interviewee?
Strengths and challenges of the PSS
Nature of this research report
Things to keep in mind when reading these statistics
Section one: Violence experienced by women and men
1 Prevalence: How many people does violence, in general, happen to?
2 Perpetrator demographics: Who perpetrated the violence?
3 Incident characteristics: What happens in an incident of violence?
4 Post-incident actions and impacts: What happens after an incident of violence?
Section two: Women’s experiences of sexual assault
1 Prevalence: How many women are sexually assaulted?
2 Victim demographics: Who does sexual assault happen to?
3 Perpetrator demographics: Who perpetrated the sexual assault?
4 Incident characteristics: What happened in a sexual assault incident?
5 Post-incident actions and impacts: What happens after a sexual assault?
Section three: Women’s experiences of partner violence
1 Prevalence: How many women does partner violence happen to?
2 Victim demographics: Who does partner violence happen to?
3 Incident characteristics: What happens in partner violence incidents?
4 Post-incident actions and impacts: What happens after a partner violence incident?
Section four: Women’s experience of multiple victimisation
1 Multiple victimisation as an adult
2 Victimisation as both a child and adult
3 Multiple victimisation as a child
There’s no single way of knowing everything
Executive summary
This report provides substantial additional analysis of the data produced through the Australian Personal Safety Survey (PSS). The PSS is currently a largely untapped resource – even the publicly available PSS data has yet to be fully explored and applied to the most obviously relevant research and policy contexts.
The ANROWS PSS analysis provides several hundred new statistical items related to violence against women. Almost all the data in this report is new – not only has this information not been publicly available before, but the data tables themselves have not been generated previously.
The PSS is the most comprehensive quantitative study of interpersonal violence in Australia. The survey is administered by the Australian Bureau of Statistics (ABS) and funded by the Australian Government Department of Social Services. Over 17,000 women and men completed the 2012 survey.
Violence experienced by women and men
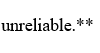
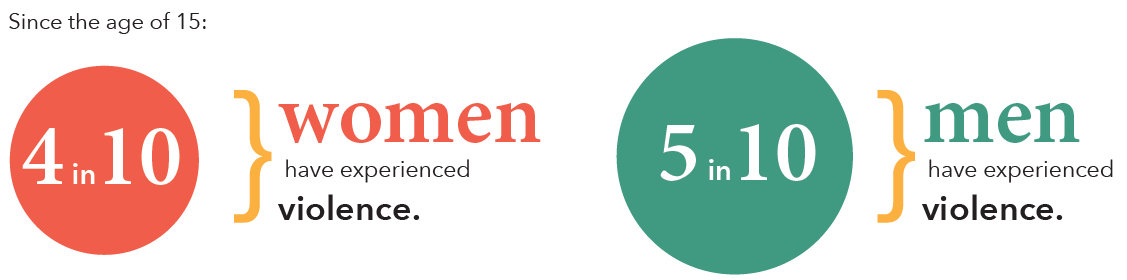
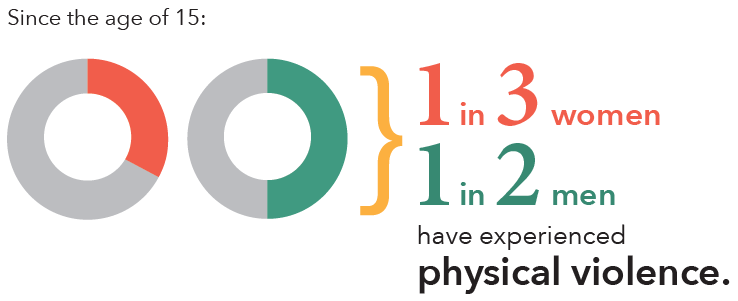
Violence is extremely common in Australia, with four out of ten women & five out of ten men having experienced at least one incident of violence since the age of 15. Men were more likely to be victims of physical violence (one in two men & one in three women) while women were more likely to be victims of sexual violence (one in five women & one in 22 men).
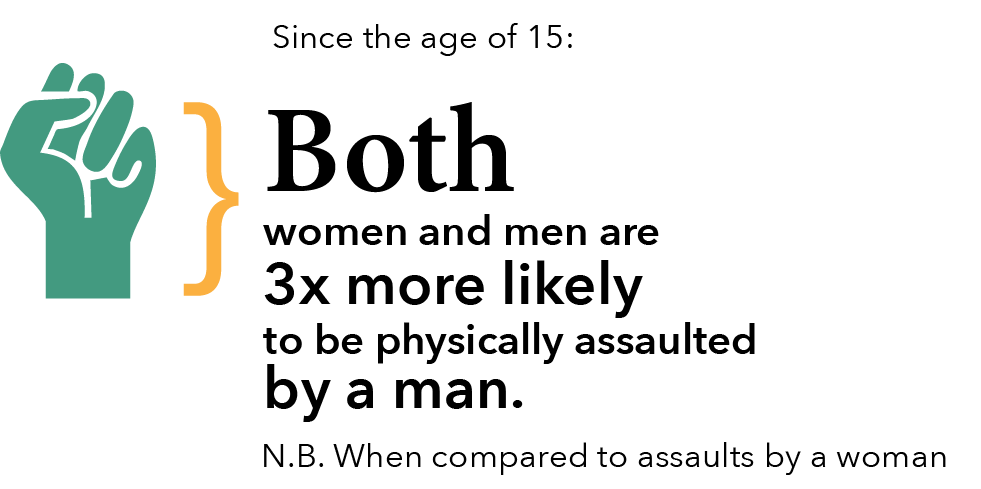
Both women and men were more than three times as likely to be physically assaulted by a man than by a woman. A man was most likely to experience violence in a place of entertainment and a woman was most likely to experience violence in her home. Seven out of ten men and five out of ten women said alcohol or other drugs contributed to their most recent physical assault by a male.
4.3 times as many women than men reported that they felt fear or anxiety after their most recent physical assault committed by an opposite sex perpetrator.
Gender remains the most substantial variable when considering differences in patterns of victimisation and perpetration.
Sexual assault
Since the age of 15, 1.5 million women had experienced sexual assault, of which more than 99% were perpetrated by men. In the year prior to the survey, 87,800 women were sexually assaulted in Australia.
More women were sexually assaulted by a boyfriend or date than by a male cohabiting partner. Women were equally likely to have been sexually assaulted by a partner they lived with as by a stranger.
Regarding their most recent incident of sexual assault by a male:
- three quarters of women reported that the assault occurred in a private residence;
- over half of women indicated that drugs or alcohol contributed to the incident;
- one in three women sexually assaulted by a known male thought that the sexual assault was a crime; and
- one in six women had not told anyone about the sexual assault.
Partner violence
One in four women in Australia have experienced at least one incident of violence by an intimate partner who they may, or may not, have been living with: one in three of these women had experienced violence by a non-cohabiting partner. Of the 2.2 million women who, since the age of 15, had experienced male intimate partner violence:
- 1.8 million experienced physical violence; and
- 0.9 million experienced sexual violence.
Most of the data available on partner violence in the PSS describes violence by a cohabiting partner.
Regarding their most recent incident of cohabiting partner violence, most women:
- reported that the incident happened in their home;
- did not perceive the incident as a crime;
- experienced fear or anxiety after the incident; and
- did not take time off work as a result of the assault.
Cohabiting partner violence does not just affect the victim – since the age of 15, over 400,000 women had experienced partner violence during pregnancy and over half a million women reported that their children had seen or heard partner violence.
Women may struggle to leave a violent relationship: the ABS estimates that 81,900 women have wanted to leave their violent current partner but never have and one in 12 women indicated that one of the reasons they returned to their violent previous partner was because they had nowhere to go. Even when women do leave such relationships, they often do so at a cost, seven out of ten women leaving property or assets behind when they moved away after their final separation from their most recently violent former partner.
Multiple victimisation
Many women experience multiple incidents of violence across their life span. For instance:
- More than two thirds of women who had experienced sexual violence had also experienced a separate incident of physical violence.
- Nearly 1 million women had experienced multiple incidents of physical violence by the same man.
- 0.78 million women had experienced multiple incidents of childhood sexual abuse. Of these, 0.32 million women also experienced at least one sexual assault as an adult.
In the 12 months prior to the survey, women with a disability were more likely to experience multiple incidents of violence by a male perpetrator.
Limitations
The PSS is a complex tool for looking at a complex social problem. The PSS data is layered in a way that can make sub-population analysis difficult. Data becomes more fragile as more limitations are placed on it. Therefore, examination of sub-populations can be difficult because the estimates quickly become too unreliable for general use. Cross-referencing multiple contextual factors can also be difficult for the same reason, so that while extensive detail is available about incidents of violence, the ability to build an understanding of how these factors interact can be more limited.
A key limitation of the survey is that the ABS has difficulty in accessing and surveying a statistically valid sample of people from communities of interest, including women with a disability and women from culturally and linguistically diverse backgrounds. In addition, there are a range of populations for whom the PSS does not currently collect demographic information, including transgender and gender diverse people, and Aboriginal and Torres Strait Islander peoples.
Introduction
As part of its Research Program 2014-2016 (Part 1), ANROWS committed to providing detailed analysis of Australia’s most comprehensive quantitative data on violence against women. In order to do this, ANROWS has analysed data from the 2012 Personal Safety Survey (PSS), produced by the Australian Bureau of Statistics (ABS), and not previously subjected to analysis.
In this introductory section, we describe the nature of the PSS, its strengths and weaknesses and the purpose of this data report.
What is the Personal Safety Survey?
- Most comprehensive quantitative sample survey in Australia of all forms of interpersonal violence.
- The 2012 PSS reflects a commitment of the National Plan to Reduce Violence against Women and their Children to complete the PSS every four years.
- Completed face-to-face to encourage full participation and help ensure safety of participants.
- Over 17,000 women and men completed the 2012 survey.
- Extensive quality control measures.
- Not designed to address subjective questions (e.g. emotional context of violence).
- Amount of detail collected means that there is a complex survey design.
- Can take a long time to complete if you have an extensive history of violence.

What are the characteristics of the PSS?
The PSS is the most comprehensive quantitative study of interpersonal violence in Australia. The survey is administered by the ABS and funded by the Australian Government Department of Social Services.
The survey was undertaken in 2005 and 2012, with another survey planned for 2016. A similar survey, limited to women’s experiences of violence, was completed in 1996. This allows rates of violence to be compared over time.
The survey is designed to provide national data on how often interpersonal violence occurs, and how many people are affected by it. It has a particular focus on types of violence that are of interest to the violence against women sector, namely intimate partner violence and sexual assault.
The PSS is a statistical tool designed to count events that have already happened. There are a range of things that it does not, and cannot, do. For example, the PSS does not:
- provide modelling of how many people will be affected by violence in the future;
- address subjective research questions. For example, it does not investigate emotional aspects of violence nor beliefs or attitudes towards violence.
For the 2012 survey, ABS staff determined the number of female interviewees to ensure that robust estimates could be given at the state and territory level for women’s experiences of all violence types (as a total) in the previous 12 months. Estimates are also separately provided for women’s experiences of intimate partner violence and sexual assault in the previous 12 months. The provision of these estimates supports the implementation of the National Plan to Reduce Violence against Women and their Children (Council of Australian Governments (COAG), 2011). The sample size for men was calculated to ensure that there were robust estimates for men’s experiences of violence at the national level.
Extensive quality control measures were used to ensure the robustness of the data in the 2012 PSS. These practices included:
- consultation through a range of advisory mechanisms;
- pre-testing of the survey with individuals who had complex violence histories;
- sensitivity training for interviewers;
- data cleaning to ensure accurate entries;
- identification (and where possible addressing) of bias in the sample; and
- acknowledgement of potential bias in the selected sample in publications.
How is the PSS administered?
The PSS is a household survey, which means that the ABS randomly selects participants by contacting a residence and then speaking to an adult member of the household (for each household, the ABS decides whether a male or female person will be surveyed before making contact). Unlike most household surveys which are done via telephone, the PSS is completed face-to-face. ABS staff door-knock at households and then identify the selected respondent. After selecting the respondent, they make sure they can conduct the survey interview in a private setting (the ABS has some provisions if this is not possible such as coming back later, arranging an alternative meeting place or completing the interview by phone). The interview is conducted using a Computer Assisted Personal Interview system; interviewers follow a sequence of questions and prompts and enter responses into a secure laptop. This collection method aims to ensure confidentiality and assist in supporting participants to make the disclosures required for data collection.
The survey does not sample people who live in places other than private dwellings. It excludes individuals living in non-private accommodation such as aged care facilities and hospitals. If it was clear to ABS staff that a premises is a women’s refuge, they would not approach that premises. However, women’s refuges are rarely signposted on the street, and generally look like private accommodation, so they may be approached by ABS staff for inclusion of a resident in the survey. Participation would be declined because of the ABS requirement for identifying information for all inhabitants of the premises.
The sample includes women and men who are over the age of 18 years.[1] More women than men are in the sample, as sufficient numbers of women in each state and territory are required in order for robust estimates at this level to be able to be used in the context of the National Plan to Reduce Violence against Women and their Children (COAG, 2011). Only national estimates are required for men.
In 2012, 41,345 households were approached with 30,228 dwellings deemed eligible for inclusion in the survey. A total of 17,050 individuals (13,307 women and 3,743 men) completed the survey.
One of the strengths of the PSS is the amount of detail collected about occasions of violence. A consequence of this strength is that the survey can take a long time to complete – for people with experience of multiple types of violence, the survey can take up to two hours.
In acknowledgement of the distress that the survey may cause, the ABS offers support to both staff and interviewees.
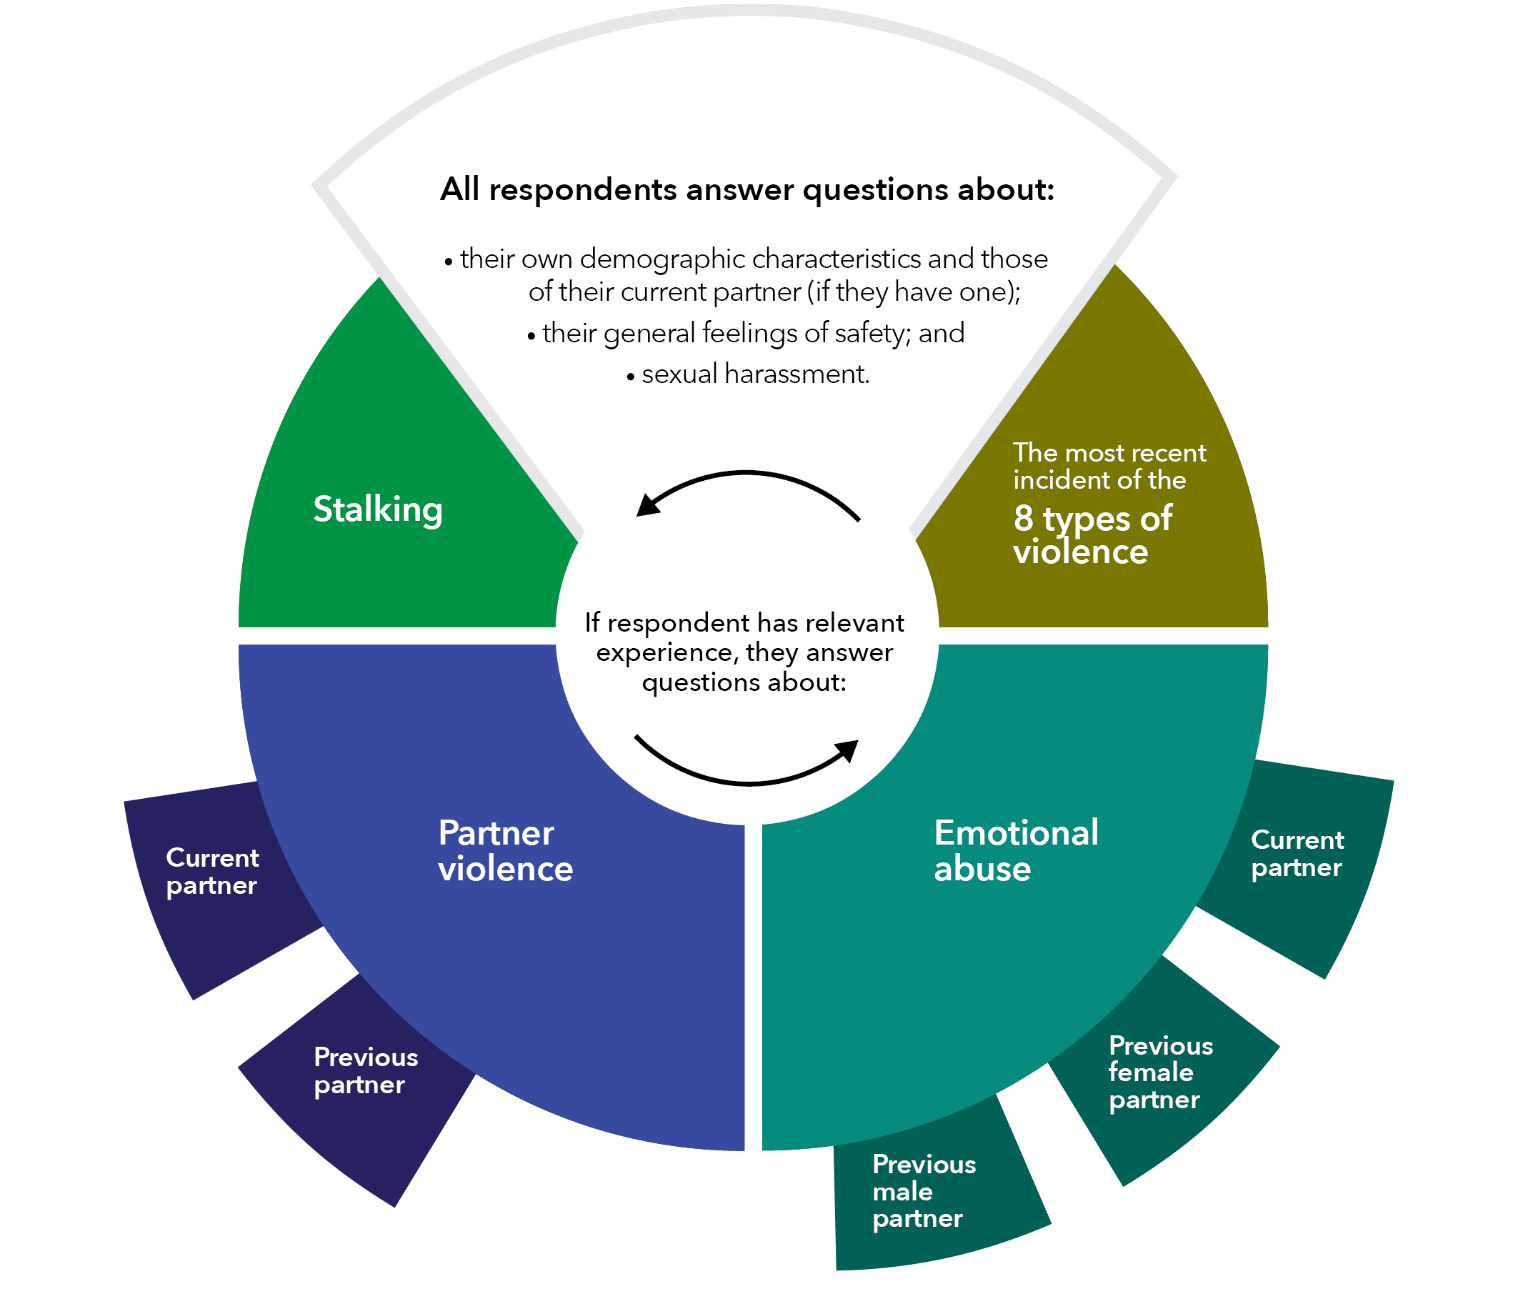
How is the PSS structured?
The PSS is designed to provide quantitative data on Australian experiences of violence. In order to do this, the ABS collects information on the following topics:
- the demographic details of the interviewee and their partner (if they have one);
- the interviewee’s experiences of violence since the age of 15; and
- detailed characteristics of the most recent incident for eight types of violence (see below for detail of the eight types of violence).
The survey asks specific questions about:
- the context of violence perpetrated by a partner;
- emotional abuse by a partner;
- abuse before the age of 15;
- sexual harassment; and
- stalking.
Most of the survey concentrates on collecting near identical information for eight categories of violence: four types of violence (sexual assault, sexual threat, physical assault and physical threat), each collected separately for two types of perpetrator (male and female). Thus, an interviewee may be asked the same set of questions eight times, once for each type of violence.
Table A: The eight categories of violence used in the PSS
Physical assault by a male Physical assault by a female Physical threat by a male Physical threat by a female Sexual assault by a male Sexual assault by a female Sexual threat by a male Sexual threat by a female
The survey asks for extensive detail about the interviewee’s “most recent” experience of each type of violence.
The survey is structured using conditional reasoning. This means that interviewees only answer questions that are relevant to their experience. This is achieved by question sequencing that is programmed into the survey collection equipment.
Figure A: Structure of the PSS data
Respondent, survey participant or interviewee?
In this report we use the terms “respondent”, “survey participant” and “interviewee” interchangeably. When we say “respondent” we are not referring to a person who is responding to a petition in court (as per domestic violence legislation) but rather to a person who responds to the survey.
The majority of this report, however, will not use these terms. This is because most of the data is presented as population estimates. These estimates are a weighted calculation based on individual survey responses (i.e. raw data) and census data. In this way, the estimates are an extrapolation of the raw data, rather than a simple reporting of interviewee responses. Thus, to talk directly about the number of respondents who indicated a particular experience would be inaccurate.
Strengths and challenges of the PSS
- Systematically structured definitions and survey.
- Good quality prevalence estimates.
- Extremely detailed information on most recent incident of violence.
- Collected sensitively.
- Structure of survey limits some analysis.
- Definitions can be initially confusing as they may not align with “common sense” understandings of violence.
- Difficulty in accessing and surveying a statistically valid sample of people from communities of interest, including women with a disability and women from culturally and linguistically diverse backgrounds.
The PSS is a systematic and statistically rigorous survey that provides population estimates on the extent of violence in the Australian community.
The ABS takes care to ensure that data is collected sensitively, balancing the need for detailed information with the time and emotional toll involved in its collection.
One of the key strengths of the PSS is that it provides extremely detailed information about specific incidents of violence. Due to time and respondent capacity constraints, it is not feasible for the survey to collect detailed information about all incidents of violence that a person has ever experienced.
The ABS produces a statistical report for each time the survey is conducted. Each report is technical and precise with little background or contextualising information and no discussion of the implications of its findings. By using this tone, the ABS maintains a high level of objectivity in its reports. Organisations such as ANROWS and Our Watch[2] aim to provide background information that may help to contextualise the reports.
What are the challenges of using the PSS?
There are several key challenges that can make the use of PSS statistics difficult.
The ABS does not write up all the data that it collects as the level of detail collected in the survey makes publication of all survey findings unfeasible. This means that some findings that may be of particular interest to those working on policy, programs and practice related to violence against women are not publicly available in the published report. Data not included in the survey publication is available through custom data requests, or by accessing the “Confidentialised Unit Record File”.
For some purposes, the PSS is not sufficiently timely. Production of the PSS report requires significant data entry and sophisticated analysis. Results of the survey take time to become available. In 2015, the most current available data was published in late 2013 and relates to the survey that was completed in 2012. The next survey will be completed in 2016.
Although data is systematically collected, experiential, conceptual and statistical limitations mean that it can be difficult to compare different types of violence. For example, it is not possible to compare data about women who have experienced sexual assault and those who have experienced partner violence as they have an overlapping population (i.e. some women will have experienced sexual assault by a partner). It is also not possible to consider some violence types individually – for example, in the partner violence module of the survey, “physical assault by a partner” and “sexual assault by a partner” are subsumed into the broader violence type category “partner violence”.
Violence = assault and/or threat
Responses to the PSS are weighted to reflect the demographics of the Australian community. This is important as it means that the survey is representative; however, it can make estimates for small sub-populations unreliable. For example, estimates for women born overseas who have experienced sexual assault in the last 12 months will be less reliable than those for (all) women who have experienced sexual assault in the last 12 months, because individual responses will have a greater impact on the weighted estimates for small populations.
Similarly, the capacity for cross referencing (e.g. demographic information against violence types) can be limited by constraints on the production of reliable estimates.
Definitions used in the PSS
The PSS counts instances of physical and sexual violence, with “violence” understood as including both assault (harming a person) and threat (threatening to harm a person).
The PSS uses a hierarchy to ensure any single incident is only counted once. In this context, counting of sexual violence is prioritised over counting of physical violence, and counting of assault is prioritised over counting of threats. Thus:
- If a person experienced a threat and an assault in the same incident, the experience would be counted once as an assault.
- If a person experienced both physical and sexual assaults (or threats) in a single incident, the incident would be counted once as a sexual assault (or threat).
- An incident that includes both physical assault and sexual threats is counted as a sexual threat.
The PSS defines the types of violence as follows:
- Physical violence involves any incidents of physical assault and/or physical threat:
- Physical assault involves “the use of physical force with the intent to harm or frighten a person. Assaults may have occurred in conjunction with a robbery and includes incidents where a person was assaulted in their line of work (e.g. assaulted while working as a security guard). This includes being: pushed, grabbed or shoved; slapped; kicked, bitten or hit with a fist; hit with an object or something else that could hurt you; beaten; choked; stabbed; shot; or any other type of physical assault which involved the use of physical force with the intent to harm or frighten a person. Physical assault excludes incidents that occurred during the course of play on a sporting field.”
- Physical threat is “an attempt to inflict physical harm or a threat or suggestion of intent to inflict physical harm that was made face-to-face where the person believes it was able to and likely to be carried out.” Physical threat has the same inclusion and exclusion criteria as physical assault.
- Sexual violence involves any incidents of sexual assault and/or sexual threat:
- Sexual assault is “an act of a sexual nature carried out against a person’s will through the use of physical force, intimidation or coercion, and includes any attempts to do this. This includes rape, attempted rape, aggravated sexual assault (assault with a weapon), indecent assault, penetration by objects, forced sexual activity that did not end in penetration and attempts to force a person into sexual activity.” Sexual assault excludes unwanted sexual touching – for the purposes of this survey, this is defined as “sexual harassment”.
- Sexual threat involves the “threat of acts of a sexual nature that were made face-to-face where the person believes it is able to and likely to be carried out”.
The survey uses the following definition of partner:
- A current partner is defined as someone you live with in a marriage or de-facto relationship.
- A previous partner is someone you have lived with in a marriage or de-facto relationship. The term indicates that the perpetrator was a previous partner at the time of the survey, and includes partners who were violent during the relationship.
The ABS definition of partner explicitly excludes people in a relationship that do not live together.
Incidents of violence that occurred before the age of 15 are defined as childhood abuse, not assault. A small number of questions are asked about experiences of child abuse, however, these are excluded from the main calculations of prevalence.
Nature of this research report
Purpose of this report
With this report, ANROWS aims to:
- provide substantial additional analysis of the PSS data;
- provide accessible and accurate data to the domestic violence and sexual assault services sectors;
- represent data in a way that can be used by advocates, service providers, policy-makers, commentators and the media;
- promote accurate and informed use of PSS statistics; and
- explain the strengths and limitations of the PSS.
The focus of this project is on the violence experienced by women, which is consistent with ANROWS’s mandate to focus on violence against women. This is different to the broader attention in the PSS to all forms of violence experienced by Australian women and men.
Structure of report
This statistical report provides detailed analysis on:
- violence experienced by women and men;
- sexual assault;
- partner violence; and
- multiple victimisation.
For each topic, we answer the following questions:
- How many people does this happen to? (Prevalence of violence).
- Who does it happen to? (Victim demographics).
- Who made it happen? (Perpetrator characteristics).
- What happened? (Incident characteristics).
- What happened next? (Post-incident actions and impacts).
How to read this report
Things to keep in mind when reading these statistics
- The population estimates are a weighted extrapolation from the survey sample. These estimates have been calculated by the ABS and do not refer to the number of people who answered the question when they were completing the survey.
- The population estimates are rounded to the nearest hundred.
- Statements regarding “violence” combine data on assault and threat – this means that “physical violence” and “physical assault” relate to different populations (although “physical assault” is a sub-set within “physical violence”).
- Although there are some limitations on who is eligible to participate (e.g. overseas visitors who are in Australia for less than 12 months), interviewees are people who are located in Australia. Interviewees do not have to be Australian citizens.
- Tips for reading the report:
- The data gets dense quite quickly, so reading in short bursts may help you keep a clear head, and
- Use the headings and sub-headings as a way of keeping clear on the population being discussed

This report describes a large number of statistics for multiple respondent groups. It aims to describe them as clearly as possible. In order to do this, the report has been structured in the following way:
Figure B: How to read this report
Post it note
A reminder or helpful hint to assist with reading the report.
Text box
Explanations of survey structure or data.


Grid references under paragraphs
Grid reference for the data in this paragraph of the text.
Tbl 16
Data already published by the ABS and available on the PSS website.
Tbl A16
Data requested by ANROWS and available on the ANROWS website.
Green percentage sign
Difference was calculated to be statistically significant
Red percentage sign
Difference was calculated to be not statistically significant
Most recent incident
Highlighted to help the reader be aware that most recent incident data should be used carefully (see Section 1: 3 incident characteristics for an explanation).
Gold text
Numbers calculated by ANROWS.
Asterisk
RSE 25%-50% – these statistics should be used with caution.
Double asterisks
RSE 50%+ – these statistics should be used with extreme caution and are generally considered too unreliable for general use.
Terminology
Term Definition Advice, seeking of (as compared to telling someone) See Telling someone, below. Boyfriend/girlfriend/date A person who the respondent is in an emotionally and/or sexually intimate relationship with but does not live with. Includes a wide range of relationships from one night stands to long term committed non-cohabiting relationships. Does not require sexual involvement. Cohabiting partner A partner that a person is, or has, lived with in a marriage or de-facto relationship. Contributed to the incident: drugs and alcohol Survey respondents are asked whether they think drugs or alcohol contributed to their most recent incident of violence. If they answer “yes” to this question, they are then asked about the nature of the contribution, including: - whether they were under the influence of alcohol or other substances;
- whether alcohol or drugs were added to their drink without their consent; or
- whether the perpetrator was under the influence of alcohol or drugs.
Current cohabiting partner A current cohabiting partner is a person who, at the time of the survey, the respondent to the survey was living with in a marriage or de-facto relationship. Disability, a person with a The PSS uses a standard measure of core activity limitation that is used in other ABS surveys. The measure assesses the extent to which a person “needs help, has difficulty, or uses aids or equipment with [self-care, mobility or communication]”. A person may be defined as having a profound, severe, moderate or mild disability, depending on the level of core activity limitation that they experience. A person must have experienced, or be likely to experience, the limitation for at least 6 months in order for them to be classified as a person who has a disability or long-term health condition.
The PSS only selects respondents from private dwellings. Therefore, no women or men living in institutional care settings were interviewed as part of the survey. This is likely to affect the quality of the data related to this population.
Employed/in the labour-force The PSS uses the standard ABS definition of employment. It includes as “employed”, amongst other scenarios, a person who in the week prior to the interview: - worked at least an hour for pay (or without pay in a family business);
- was on strike;
- was on workers compensation (and expected to return to work); or
- was an employer.
Emotional abuse Emotional abuse is defined in the PSS as “behaviours or actions that are aimed at preventing or controlling [a partner’s] behaviour with the intent to cause them emotional harm or fear”. Emotional abuse is not classified as violence in the PSS. Former cohabiting partner A former partner includes: - A partner who was violent towards the survey respondent during the relationship, but the relationship has now ended.
- A partner who was not violent during the relationship, but has been violent since the relationship ended.
- A partner who was violent both during and after the relationship.
A former partner has at some point in time lived with the survey respondent, however the violence may have started after they stopped cohabiting.
Home When a victim and perpetrator live in the same house, the house is categorised as the victim’s home. This means that a house that is categorised as a perpetrator’s house is not the residence of the victim, but a victim’s house may or may not be the perpetrator’s home. Intimate partner A broad definition of partner that includes partners that a person may or may not be living with. This category includes cohabiting partners, as well as boyfriends, girlfriends and dates. Index of Relative Socio-economic Advantage and Disadvantage (IRSAD) The ABS has developed several measures of socio-economic status. The data collected in the PSS allows for the calculation of the Index of Relative Socio-economic Advantage and Disadvantage (IRSAD). The IRSAD “summarises information about the economic and social conditions of people and households within an area, including both relative advantage and disadvantage measures.” IRSAD data is presented using quintiles: a quintile is a “grouping that result[s] from ranking households by [the IRSAD rate] and then dividing the population into… five equal groups.”
Known person Includes someone known to the victim but not included in the other categories described (sometimes, this will include boyfriend/girlfriend/date, and sometimes it will not – in order to determine this, please note whether “intimate partner” or “cohabiting partner” is in the corresponding category). A known person may be a parent or step-parent, son/daughter (including step-children), sibling (including step-sibling), relative or in-law, friend, acquaintance, neighbour, employer/boss/supervisor, co-worker/co-volunteer, counsellor/psychologist/psychiatrist, doctor, teacher, pastor/priest/minister/rabbi, prison officer, ex-boyfriend/ex-girlfriend or any other known person/s.
Main English speaking country The ABS defines the United Kingdom, the Republic of Ireland, New Zealand, Canada, South Africa and the United States of America as “main English speaking countries”. Most recent incident (MRI) A person’s most recent incident of a specific form of violence. Perpetrator type Perpetrator type refers to the relationship between the victim and the perpetrator. In general the analysis in this report distinguishes between cohabiting partners, other known people and strangers. Physical abuse The PSS defined physical abuse of a child as “[a]ny deliberate physical injury (including bruises) inflicted upon a child (before the age of 15 years) by an adult. Discipline that accidentally resulted in an injury is excluded.” Physical assault Physical assault involves “the use of physical force with the intent to harm or frighten a person. Assaults may have occurred in conjunction with a robbery and includes incidents where a person was assaulted in their line of work (e.g. assaulted while working as a security guard). This includes being: pushed, grabbed or shoved; slapped; kicked, bitten or hit with a fist; hit with an object or something else that could hurt you; beaten; choked; stabbed; shot; or any other type of physical assault which involved the use of physical force with the intent to harm or frighten a person. Physical assault excludes incidents that occurred during the course of play on a sporting field.” Physical threat Physical threat is “an attempt to inflict physical harm or a threat or suggestion of intent to inflict physical harm, which was made face-to-face where the person believes it was able to and likely to be carried out. Physical threat has the same inclusion and exclusion criteria as physical assault.” Physical violence Physical violence involves any incidents of physical assault and/or physical threat. Place of entertainment A place of entertainment or recreation includes places such as pubs, nightclubs and sporting venues. The ABS also includes in this category “hotels, bars, taverns and licensed restaurants and the areas surrounding these premises such as on the footpath, in a beer garden or carpark of a pub or hotel.” RSE (Relative Standard Error) The ABS defines RSE as follows:
“The Standard Error measure indicates the extent to which a survey estimate is likely to deviate from the true population and is expressed as a number. The Relative Standard Error (RSE) is the standard error expressed as a fraction of the estimate and is usually displayed as a percentage. Estimates with a RSE of 25% or greater are subject to high sampling error and should be used with caution.”
An estimate with an RSE between 25% and 50% is annotated in this report with a single asterisk and should be used with caution.
An estimate with an RSE above 50% is annotated with a double asterisks and is deemed too unreliable for general use.
Sexual abuse Sexual abuse of a child is “an act by an adult involving a child (before the age of 15 years) in sexual activity beyond their understanding or contrary to currently accepted community standards.” Sexual assault Sexual assault is defined “an act of a sexual nature carried out against a person’s will through the use of physical force, intimidation or coercion, and includes any attempts to do this. This includes rape, attempted rape, aggravated sexual assault (assault with a weapon), indecent assault, penetration by objects, forced sexual activity that did not end in penetration and attempts to force a person into sexual activity. Sexual assault excludes brief unwanted sexual touching.” Sexual threat Sexual threat involves “the threat of acts of a sexual nature that were made face-to-face where the person believes it is able to and likely to be carried out.” Sexual violence Sexual violence is defined as sexual assault or the threat of assault (where the victim reasonably believes that the assault could be completed). Statistically significant Statistical significance testing is a way of determining whether the difference seen between numbers is likely to be a result of a “real” difference or as a result of the research sample. When we say that a difference is “statistically significant”, we are indicating that, according to accepted statistical modelling, in at least 19 out of 20 cases, the difference is “real” and not a chance variation in sample characteristics. Another way of understanding this is to say that based on a statistical test, we can be 95% sure the result is not by chance but is an accurate representation of the phenomenon. Telling someone (vs seeking advice) To tell someone about an incident only requires that you inform them about the incident: it does not require that the person give you any advice or support. If you said to someone “John hit me the other day” – this would be telling them about the incident.
You would be getting advice or support if you said to someone “John hit me: could you help me work out what to do about it?”.
Section one: Violence experienced by women and men
In Australian media and research on violence against women, women’s experiences of violence are frequently compared to those of men. These comparisons are at times problematic as they tend to hide the important differences in the nature of violence experienced by women and men. Despite this, such comparisons are a common use of PSS data and are an important way of contextualising more detailed discussions of violence against women. This section of the report therefore aims to provide accurate information to inform such gendered analysis. In the context of the aims of this report, men’s experiences are discussed here precisely because they enable us to more fully understand the experiences of women.
This section aims to contextualise the more detailed analysis of women’s experiences in the rest of the report by:
- highlighting the similarities and differences in men’s and women’s experiences of violence;
- articulating the high level outcome measures that are then analysed in more detail in the rest of the report; and
- mirroring the structure of the rest of the report to assist the reader in navigating the content.
This section begins with an analysis of the prevalence of violence experienced by women and men (including specific forms of violence) and then proceeds to analyses of perpetrator demographics, basic incident characteristics and key post-incident actions and impacts.
Contents for this section
1 Prevalence: How many people does violence, in general, happen to?
2 Perpetrator demographics: Who perpetrated the violence?
2.4 Boyfriend, girlfriend or date
3 Incident characteristics: What happens in an incident of violence?
4 Post-incident actions and impacts: What happens after an incident of violence?
4.1 Police contact and court appearance
1 Prevalence: How many people does violence, in general, happen to?
1.1 Since the age of 15
Since the age of 15, more men than women have experienced at least one incident of violence. Both women and men experience more physical violence than sexual violence. Women are more likely to experience sexual violence than men.
1.1.1 All violence
Since the age of 15
During their adult life, men are more likely than women to have experienced some form of violence.
Since the age of 15, 3.6 million women have experienced violence. This is four out of ten women in Australia (40.8%).
Tbl 1: D29
Since the age of 15, 4.1 million men have experienced violence. This is one in two men in Australia (49%).
B29

The difference in rates of violence perpetrated against women and men is statistically significant.
1.1.2 Sexual violence
Sexual violence (assault and threat)
In comparison to men, women were significantly more likely to have experienced sexual violence. An incident of sexual violence may include sexual assault and/or sexual threat.
1.7 million women have experienced sexual violence since the age of 15. This is one in five women in Australia (19.4%).
Tbl 1: D39
0.4 million men have experienced sexual violence since the age of 15. This is one in 22 men in Australia (4.5%).
B39

The difference in rates of sexual violence for men and women is statistically significant.
What are we talking about again?
This section looks at a range of categories of violence.
- All violence – any instance of sexual or physical violence;
- Sexual violence – any instance of sexual assault or sexual threat; and
- Physical violence – any instance of physical assault or physical threat.
The prevalence data outlined here is a count of people, rather than a count of instances of violence. A person is only counted once in a particular category, regardless of how many incidents they have experienced.
For example, Jan has experienced:
- three incidents of sexual threat; and
- two instances of sexual assault.
As Jan is always one person, she would be counted:
- once in the sexual threat category;
- once in the sexual assault category;
- once in sexual violence; and
- once in the all violence category.
Remember!
Violence can be perpetrated by anyone – strangers, co-workers, partners, parents etc.
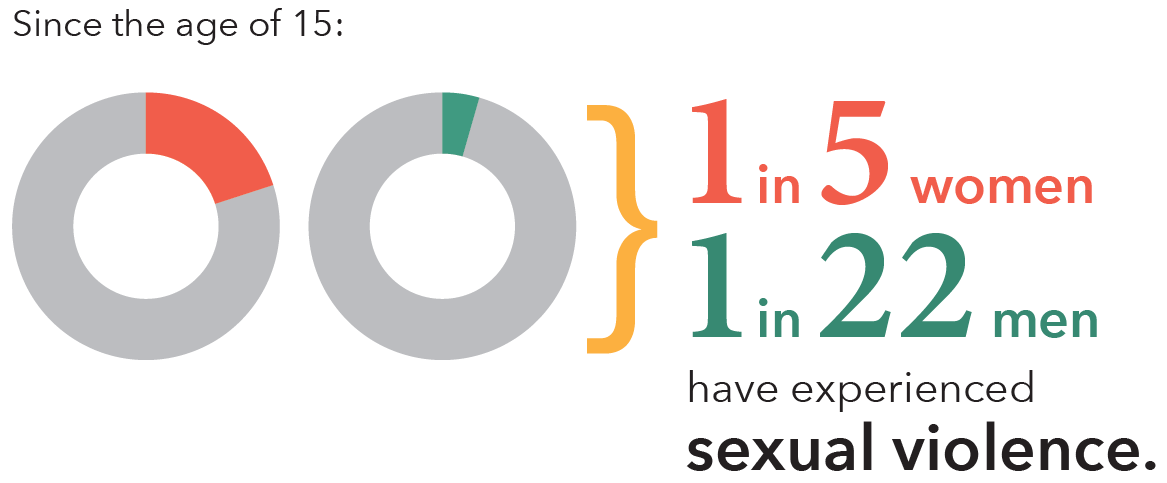
Graph A: Since the age of 15, number of women and men who experienced sexual assault: By sex of victim and sex of perpetrator
Data table for Graph A:
Gender Female perpetrator Male perpetrator Female victim 25,400 852,800 Male victim 130,600 72,300
Note: Data relates to incidents since the age of 15.
Sexual assault
Women were more than four times as likely as men to have experienced sexual assault.
More than one in six women have experienced sexual assault (17.1%); this is 1.5 million women. Approximately 33.5 times as many women reported sexual assault by a man (852,800) than by a woman (25,400).
Tbl 16: D37, F23, F24
One in 25 men have experienced sexual assault since the age of 15 (4%). This is more than 0.3 million men. More men experienced sexual assault by a female (130,600) than experienced sexual assault by a male (72,300).
B37, F12, F11

The difference in rates of sexual assault for men and women is statistically significant.
Sexual threat
Women were eight times as likely to have experienced sexual assault.
Close to 400,000 women experienced sexual threat in their adult life. This is one in 22 women (4.4%).
Tbl 1: D38
A little over 50,000 men experienced sexual threat. This is one in 160 men (0.6%).
B38

The difference in rates of sexual threat for men and women is statistically significant.
Women experience significantly more sexual violence than men. The vast majority of these assaults are perpetrated by men.
What does statistically significant mean?
Statistical significance testing is a way of determining whether the difference seen between numbers is likely to be a result of a “real” difference or as a result of the research sample. When we say that a difference is “statistically significant”, we are indicating that, according to accepted statistical modelling, in at least 19 out of 20 cases, the difference is “real” and not a chance variation in sample characteristics.
Another way of understanding this is to say that; based on a statistical test, we can be 95% sure the result is not by chance but is an accurate representation of the phenomenon – in this case, the difference in rates of violence perpetrated against women and men.
Graph B: Since the age of 15, number of women and men who experienced physical assault: By sex of victim and sex of perpetrator
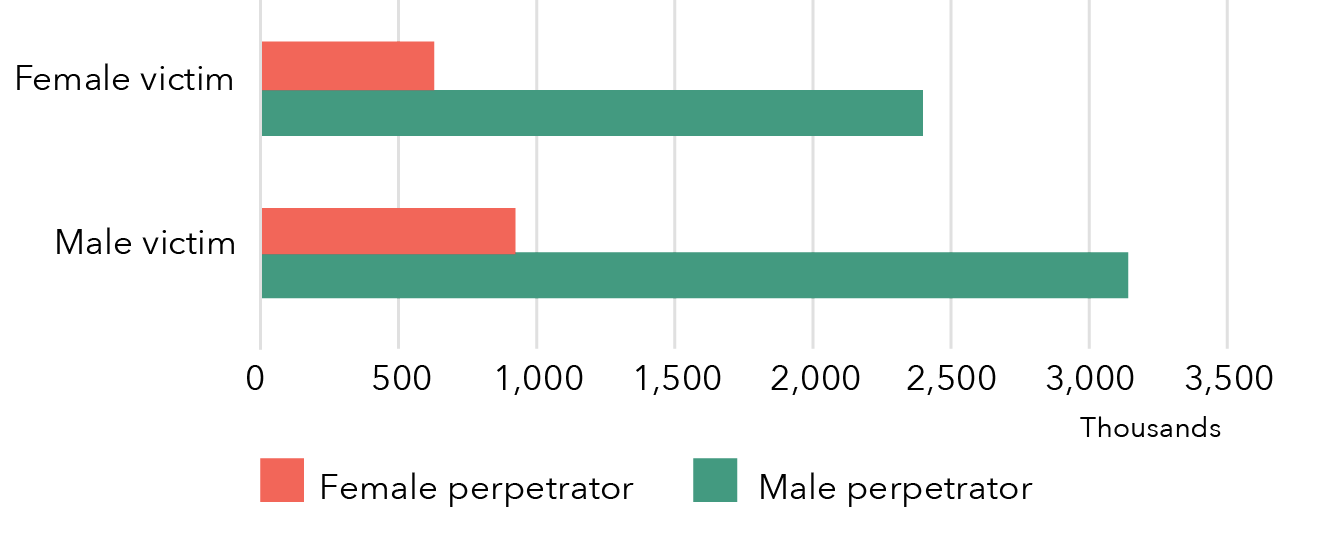
Data table for Graph B:
Sex of victim Female perpetrator Male perpetrator Female victim ~630,000 ~2,400,000 Male victim ~920,000 ~3,140,000
Note: Data relates to incidents since the age of 15.
Remember!
Physical violence is a set of actions that can be perpetrated by anyone – strangers, co-workers, partners, parents etc.
1.1.3 Physical violence
Physical violence (assault and threat)
Since the age of 15, more men than women have experienced physical violence.
A little over one in three women in Australia have experienced physical violence since the age of 15 (34.4%): this is slightly more than 3 million women.
Tbl 1: D34
Close to one in two men in Australia have experienced at least one incident of physical violence since they turned 15 (48.1%): this is more than 4 million men.
B34

The difference in rates of physical violence for men and women is statistically significant.
Physical assault
Approximately 1.3 times as many men had experienced physical assault.
Approximately 2.6 million women have experienced at least one incident of physical assault: this is three out of ten women in Australia (29.8%).
Tbl 1: D32
A little over 3.3 million men have experienced physical assault: this is four out of ten men in Australia (39.3%)
B32

The difference in rates of physical assault for men and women is statistically significant.
Physical threat
Compared to women, 1.75 times as many men had experienced physical threat.[3]
Over 1.1 million women have experienced physical threat: this is one in eight women in Australia (12.8%).
Tbl 1: D33
Close to 2 million men have experienced physical threat: this is one in four men in Australia (23.2%).
B33

The difference in rates of physical threat for men and women is statistically significant.
Physical violence is more prevalent than sexual violence in Australia. Men are more likely than women to have experienced physical assault and physical threat.
1.1.4 No violence
Women were more likely than men to report no violence in their adult lives.
Six out of ten women had not experienced any violence since the age of 15 (59.2%). This is over 5.1 million women.
Tbl 1: D27
Five out of ten men had not experienced any violence since the age of 15 (51%). This is 4.3 million men.
B27

The difference in rates of “no violence” for men and women is statistically significant.
“In the last 12 months” is a subset of “since the age of 15”
Prevalence data is collected by the ABS for both a respondent’s experience of violence since the age of 15, and in the 12 months prior to the survey. These are overlapping groups, with “in the last 12 months” a sub-set of “since the age of 15”. All respondents in the former category are also counted in the latter.
1.2 In the last 12 months
1.2.1 All violence
In the 12 months prior to the survey, 1.6 times as many men as women experienced at least one violent incident.
Close to half a million women experienced violence in the 12 months prior to completing the survey: this is one in twenty women (5.3%).
Tbl 1: D13
Close to three quarters of a million men experienced violence in the 12 months prior to completing the survey: this is one in twelve men (8.7%).
B13
(A person may have experienced more than one type of incident during the 12 month period.)

The difference in rates of violence for men and women is statistically significant.
1.2.2 Sexual violence
Sexual violence (assault and threat)
Women were more likely than men to have experienced sexual violence in the 12 months prior to the survey.
A little over 100,000 women experienced sexual violence in the year prior to the survey. This is 1.2% of women in Australia.
Tbl 1: D23
A little over 40,000 men experienced sexual violence in the last year. This is 0.5%* of men in Australia. (The male sexual violence statistics presented in this section 1.2.2: Sexual violence have a high RSE and should be used with caution.)
B23

The difference in rates of sexual violence for men and women is statistically significant.
What is RSE?
The ABS defines Relative Standard Error (RSE) as follows:
“The Standard Error measure indicates the extent to which a survey estimate is likely to deviate from the true population and is expressed as a number. The Relative Standard Error (RSE) is the standard error expressed as a fraction of the estimate and is usually displayed as a percentage. Estimates with a RSE of 25% or greater are subject to high sampling error and should be used with caution.”
An estimate with a RSE between 25% and 50% is annotated with a single asterisk* and should be used with caution.
An estimate with a RSE above 50% is annotated with a double asterisks** and is deemed too unreliable for general use.
For more information, please see: https://www.abs.gov.au/websitedbs/d3310114.nsf/Home/What+is+a+Standard+Error+and+Relative+Standard+Error,+Reliability+of+estimates+for+Labour+Force+data
Graph C: During the last 12 months, number of women and men who experienced violence: By sex of victim and type of violence
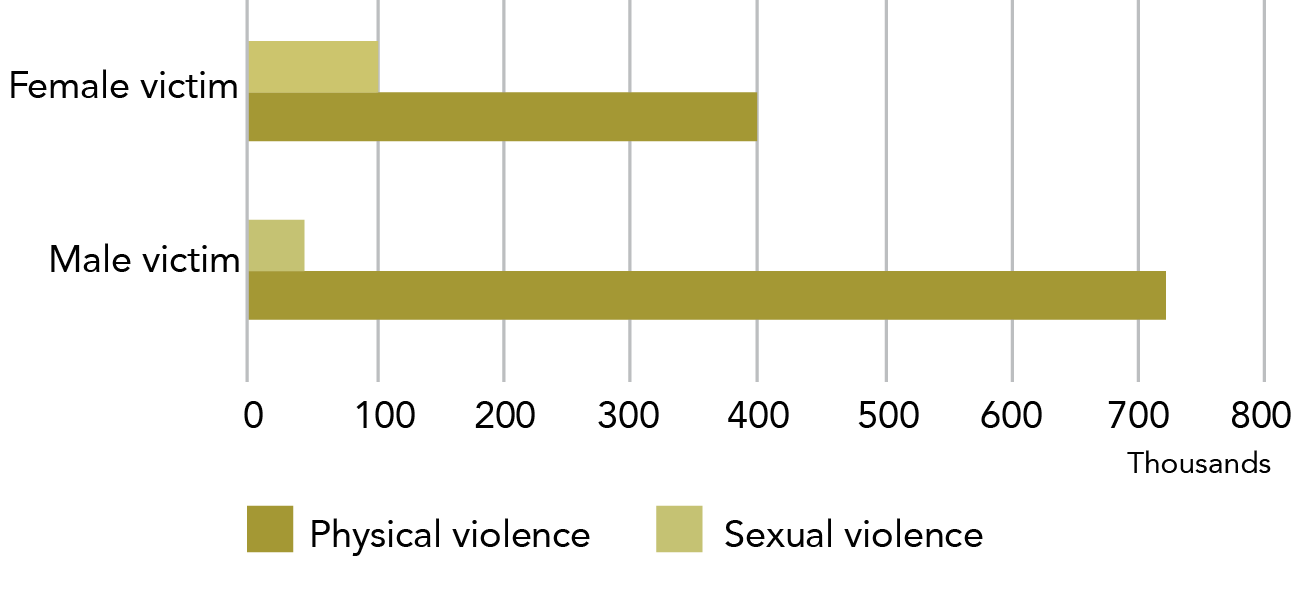
Data table for Graph C:
Type of violence Female victim Male victim Physical violence ~400,000 ~720,000 Sexual violence ~100,000 ~45,000
Note: Data relates to incidents since the age of 15.
Sexual assault
Close to two and a half times as many women as men reported that they had been sexually assaulted in the year prior to the survey.
87,800 women experienced sexual assault in the last year: this is one in 100 women (1%).
Tbl 1: D21
37,000* men experienced sexual assault in the last year: this is 0.4%* of men in Australia.
B21

The difference in rates of sexual assault for men and women is statistically significant.
Sexual threat
17,600* (0.2%*) women reported having experienced sexual threat.
Tbl 1: D22
The estimates for sexual threat of men were unreliable.**
B22
1.2.3 Physical violence
Physical violence (assault and threat)
Men were significantly more likely than women to experience physical violence in the year prior to the survey.
A little over 400,000 women experienced physical violence in the 12 months prior to completing the survey: this is one in 21 women (4.6%).
Tbl 1: D18
Close to three quarters of a million men experienced physical violence in the 12 months prior to completing the survey: this is one in 12 men (8.5%).
B18

The difference in rates of physical violence for men and women is statistically significant.
Rounding of the numbers in this section
This section uses more rounding than the following sections to help the reader in juggling (at least) two types of victim and/or perpetrator. By removing some of the exact numbers (but still keeping the grid references so that the exact number can be easily found) the comparisons are more immediately apparent to the reader.
Physical assault
Approximately 1.7 times as many men as women experienced physical assault in the year prior to the survey.
263,500 (3%) women experienced physical assault in the 12 months prior to completing the survey.
Tbl 1: D16
461,000 (5.4%) men experienced physical assault in the 12 months prior to completing the survey.
B16

The difference in rates of physical assault for men and women is statistically significant.
The prevalence of physical assault is between 1.3 (for men) and 1.4 (for women) times the prevalence of physical threat.
Physical threat
More men than women reported experiencing a physical threat in the year prior to the survey.
188,900 women experienced physical threat in the 12 months prior to completing the survey.
Tbl 1: D17
352,200 men experienced physical threat in the 12 months prior to completing the survey.
B17

The difference in rates of physical threat for men and women is statistically significant.
1.2.4 No violence
Nineteen out of 20 (94.7%) women did not experience any violence in the last 12 months (8,268,100).
Tbl 1: D11
Nine out of ten (91.3%) men did not experience any violence in the last 12 months (7,729,200).
B11
Why haven’t you described victim characteristics?
Section 1: Violence experienced by women and men aims to provide information on the different patterns of violence experienced by women and men. Although differences in demographics are relevant to this, our focus is on the single demographic variable of sex.
We therefore haven’t included an analysis by demographic characteristics in this section. We do provide this type of analysis in Section 2: Women’s experiences of sexual assault and Section 3: Women’s experiences of partner violence.
2 Perpetrator demographics: Who perpetrated the violence?
The data in this section examines perpetrator types for all types of violence perpetrated against a victim over 15 years of age.
Men are most likely to have experienced violence perpetrated by a stranger
Tbl 4: B16
Women are most likely to have experienced violence perpetrated by a known person, specifically a former partner. Boyfriends/girlfriends/dates were also a key perpetrator of violence against women, albeit a smaller group than cohabiting partner. A similar pattern was seen in male victims, however men reported more violence by friends and acquaintances than by cohabiting or non-cohabiting partners, with strangers being a dominant perpetrator group for male victims.
D20
2.1 Known person
Both women and men are more likely to have experienced violence by a known man than by a known woman.
Male victim
2.26 million men had experienced violence by a known person.[4] This is approximately one in four men in Australia (26.6%).
Tbl 4: B17
1.8 million male victims had experienced violence by a known man (21.5%), of which:
- 1.4 million men had experienced physical assault by a man; and
- Over 100,000 men had experienced sexual assault by a man.
Tbl A1: R28, B28, H28
933,900 men had experienced violence by a known woman, of which:
- 766,800 men had experienced physical assault by a woman; and
- 165,700 men had experienced sexual assault by a woman.
R33, B33, H33
Talking about assault
Please note that the dot points in 2.1-2.2 relate to physical and sexual assault. These numbers do not relate to the broader categories of physical and sexual violence (which include threats).
Graph D: Since the age of 15, number of women and men who experienced violence, reported perpetrator of violence: By sex of victim
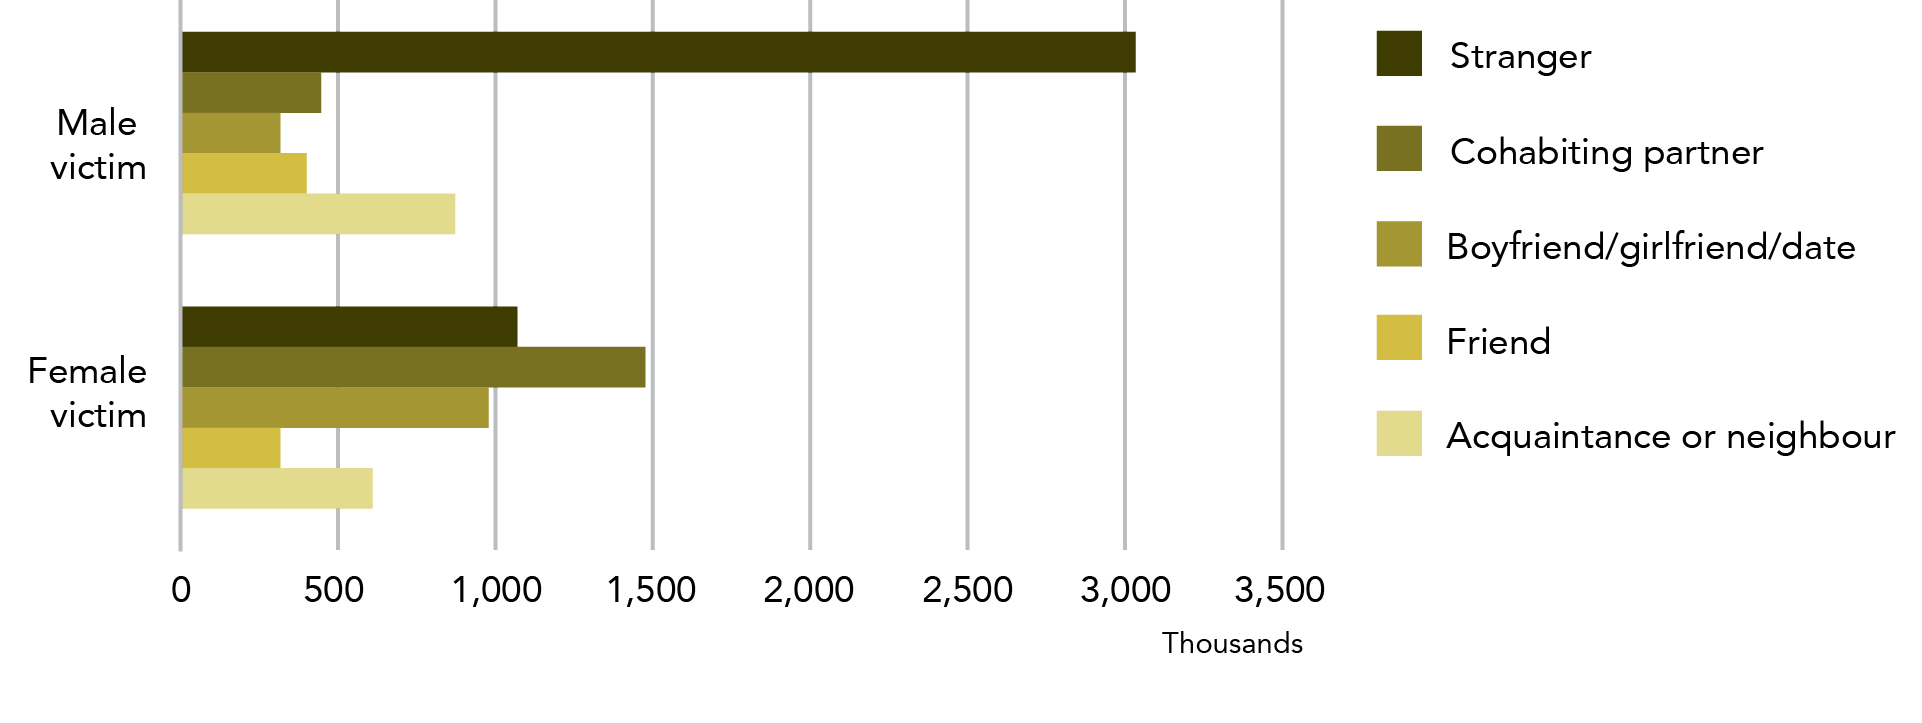
Data table for Graph D:
Perpetrator of violence Male victim Female victim Stranger ~3,030,000 ~1,060,000 Cohabiting partner ~440,000 ~1,470,000 Boyfriend/girlfriend/date ~310,000 ~980,000 Friend ~400,000 ~310,000 Acquaintance or neighbour ~600,000 ~870,000
Note: Data relates to incidents since the age of 15.
Female victim
One in three, or 3.1 million women had experienced violence by a known person (35.6%).
Tbl 4: D17
More than 2.9 million women reported violence perpetrated by a known man (33.7%), of which:
- 2.1 million had experienced physical assault by a man; and
- 1.3 million experienced sexual assault by a man.
Tbl A1: R11, B11, H11
Less than 0.7 million women report violence perpetrated by known women, of which:
- 480,000 women experienced physical assault by a woman; and
- 49,600 women experienced sexual assault by a woman.
R21, B21, H21

The difference in rates of violence for women and men perpetrated by a known person of the same sex as the victim was statistically significant.

The difference in rates of violence for women and men perpetrated by a known person of the opposite sex to the victim was statistically significant.
Reminder: Current and former cohabiting partner
A current cohabiting partner is a person who, at the time of the survey, the survey respondent was living with in a marriage or de-facto relationship.
A former partner is a person who the survey respondent lived with at some point in a marriage or de facto relationship, but who they no longer live with. This includes:
- a partner who was violent towards the survey respondent during the relationship, but the relationship has now ended;
- a partner who was not violent during the relationship, but has been violent since the relationship ended; and
- a partner who was violent both during and after the relationship.
A former partner has, at some point in time, lived with the survey respondent, however the violence may have started after they stopped cohabiting.
Graph E: Since the age of 15, number of women and men who experienced violence: By intimate partner type and sex of victim
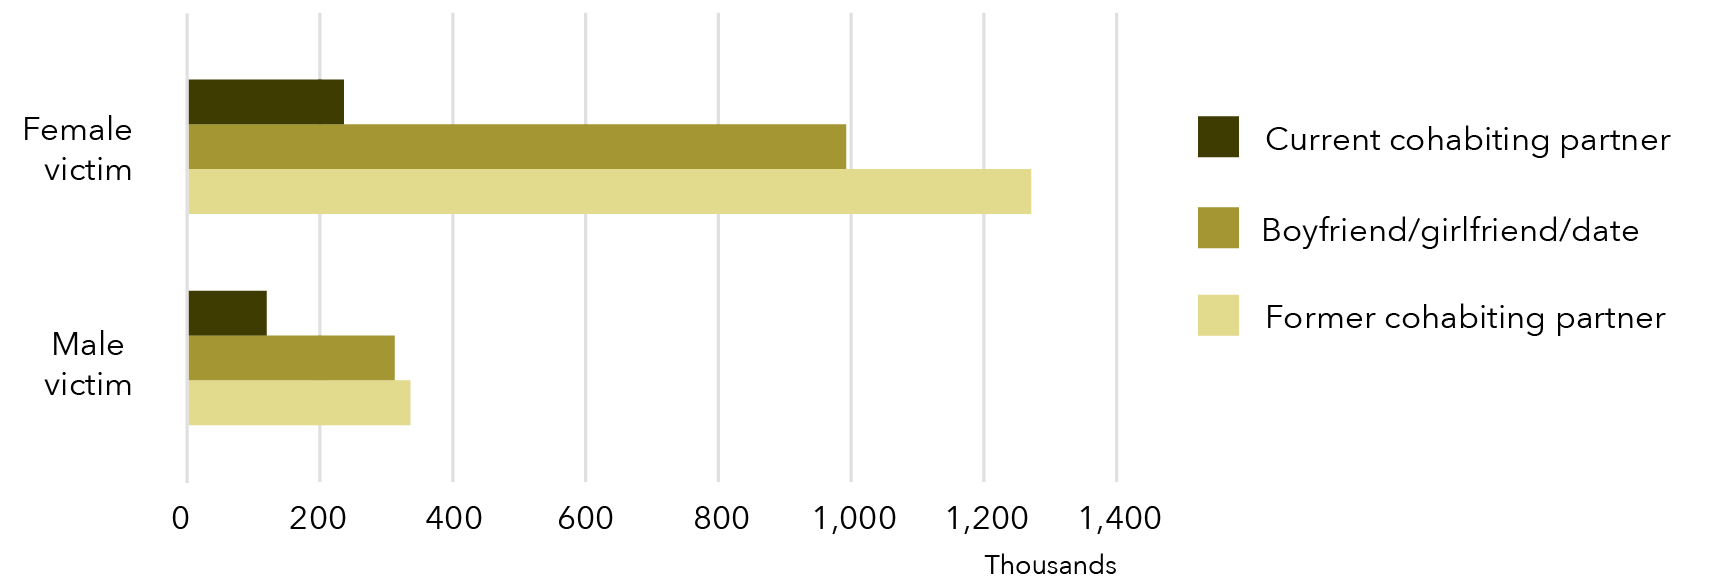
Data table for Graph E:
Intimate partner type Female victim Male victim Current cohabiting partner ~230,000 ~120,000 Boyfriend/girlfriend/date ~990,000 ~310,000 Former cohabiting partner ~1,270,000 ~340,000
Note: Data relates to incidents since the age of 15.
Intimate partner
Intimate partner is a broad definition of partner and includes partners that a person may or may not be living with. This category includes cohabiting partners, as well as boyfriends, girlfriends and dates.
2.2 Intimate partner
More women than men had experienced violence by an opposite sex partner they may or may not have been living with.
Male victim
694,100 men had experienced violence by a female intimate partner, of which:
- 595,800 men had experienced physical assault by a female intimate partner; and
- 67,500* men had experienced sexual assault by a female intimate partner.
Tbl A1: R34, B34, H34
(Data on male same sex intimate partners was not able to be released separately from the “known person” category.)
Female victim
Close to 2.2 million women reported violence perpetrated by a male intimate partner, of which:
- 1.7 million had experienced physical assault by a male intimate partner; and
over 800,000 had experienced sexual assault by a male intimate partner.
Tbl A1: R12, B12, H12
26,000 women reported violence perpetrated by a female intimate partner, of which:
- 22,000* women had experienced physical assault by a female intimate partner; and
- the number of women who reported that they had experienced sexual assault by a female intimate partner was not able to be reported due to data quality concerns.
R22, B22

The difference in rates of violence for women and men perpetrated by opposite sex perpetrators is statistically significant.
Relationship type vs sexual identity
Some people may date or be in a relationship with a person of the same sex but do not identify as gay, lesbian or bisexual. In the context of the PSS, survey respondents who report violence in a same sex relationship are describing their relationship type. At no point during the survey are respondents asked about their sexual identity.
For more information, see Not all women in same sex relationships are lesbians in Section 3: Women’s experiences of partner violence: 1.1.2.2 Female intimate partner violence.
2.3 Cohabiting partner
More than three times as many women as men reported experiencing cohabiting partner violence. For both women and men, violence was more often reported to have been perpetrated by a former cohabiting partner or a non-cohabiting partner (boyfriend/girlfriend/date) than by a current partner.
Male victim
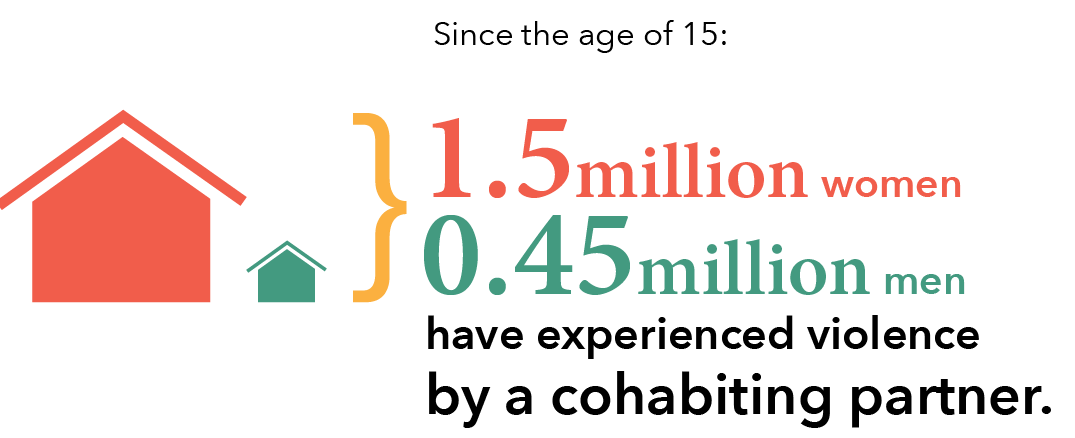
Just under 0.45 million men have experienced violence perpetrated by a cohabiting partner:
- more than 0.3 million men reported violence perpetrated by a former partner;
- more than 0.1 million reported violence perpetrated by a current partner.
Tbl 4: B18, B20, B19
Most men were victimised by female partners:
- 427,900 had experienced violence perpetrated by a female partner. This is one in 20 men in Australia (5.1%); and
- 26,500* (0.3%*) reported violence by a male partner.
Tbl 6: B40, B20
Female victim
Approximately 1.5 million women have experienced violence by a cohabiting partner:
- 1.3 million women reported violence perpetrated by a former partner; and
- 0.2 million women reported violence perpetrated by a current partner.
Tbl 4: D18, D20, D19
Almost all women who had experienced violence by a cohabiting partner reported that this violence was perpetrated by a male:
- 1,470,200 reported violence by a male partner. This is one in six women in Australia (16.8%); and
- 11,100* (0.1%*) reported violence by a female partner.
Tbl 6: D20, D40
What exactly are we talking about? Cohabiting partners
The category of cohabiting partner includes both former and current partners who have lived with the survey respondent.
A current cohabiting partner is a person who, at the time of the survey, the respondent to the survey was living with in a marriage or de-facto relationship.
A former cohabiting partner is a person who the respondent lived with at some point in a marriage or de facto relationship, but who they no longer live with, and includes:
- a partner who was violent towards the survey respondent during the relationship, but the relationship has now ended;
- a partner who was not violent during the relationship, but has been violent since the relationship ended;
- a partner who was violent both during and after the relationship.
A former partner has, at some point in time lived with the survey respondent, however the violence may have started after they stopped cohabiting.
2.4 Boyfriend, girlfriend or date
Violence by a non-cohabiting partner was a significant proportion of violence experienced by women. This type of violence was reported by considerably fewer men than women.
Male victim
An estimated:
- 18,700* (0.2%*) men experienced violence by a boyfriend or male date; and
- 295,100 (3.5%) experienced violence by a girlfriend or female date.
Tbl 6: B23, B43
Female victim
Close to a million women reported violence by a boyfriend or male date (981,300, 11.2%).
Tbl 6: D23
15,100* (0.2%*) women reported violence by a girlfriend or female date.
D43
2.5 Stranger
Most people who are victimised by a stranger, are victimised by a man. Significantly more men than women reported this type of victimisation.
Male victim
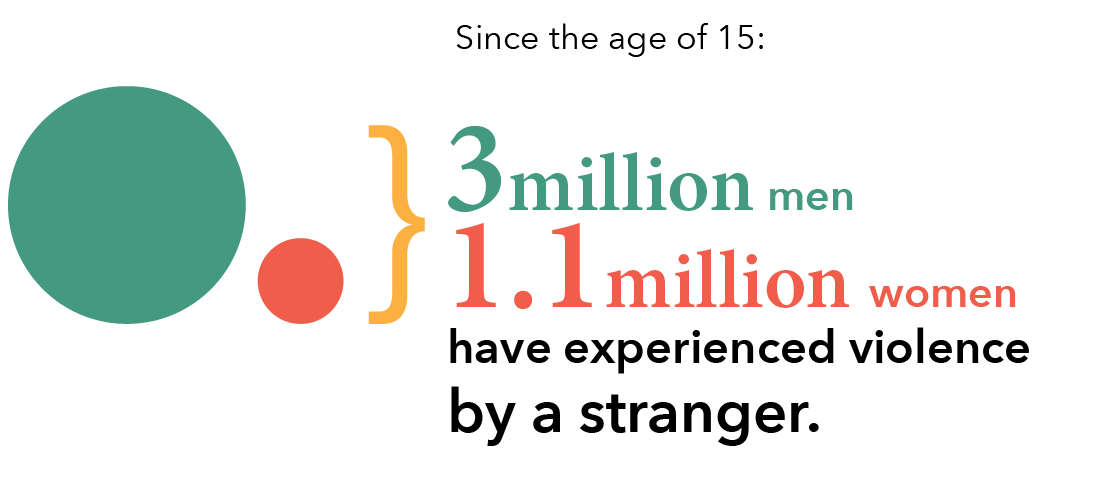
Over three million men had experienced violence perpetrated by a stranger – this is more than one in three men in Australia (35.7%).
Tbl 4: B16
Of men victimised by a stranger, almost all were victimised by a male (2,978,800): 307,900 men were victimised by a female stranger – this is one in ten men victimised by a stranger.
Tbl 6: B18, B38
Female victim
Approximately 1.1 million women had experienced violence perpetrated by a stranger: this is one in eight women (1,068,200, 12.2%). Most of these women were victimised by a male stranger (903,700).
Tbl 4: D16, Tbl 6: D18

There was no statistically significant difference in the number of men (307,900) and women (275,300) who were victimised by a female stranger.
B38, D38

The difference in rates of violence for women and men perpetrated by a stranger of the same sex as the victim was statistically significant.

The difference in rates of violence for women and men perpetrated by a stranger of the opposite sex to the victim was statistically significant.
How can you say it both is and is not statistically significant?
In this section it is possible to test a range of combinations of data for statistical differences. In the paragraph above, only some rates were sufficiently different to be statistically significant.

These differences are statistically significant: Female victims of male violence (903,700) compared to
male victims of female violence (307,900)
(opposite sex comparison);
Female victims of female violence (275,300) compared to
male victims of male violence (2,978,800)
(same sex comparison).

These differences are not statistically significant: Female victims of female violence
compared to
male victims of female violence
(same perpetrator type comparison).
I thought it was one in three?
The statistics “one in three women have experienced domestic violence” and “one in three domestic violence victims are men” have both been circulated in Australian public discourse for several years.
Among women, the “one in three” statistic refers to women’s experience of physical violence by any type of perpetrator. It is accurate to say “one in three” women have experienced:
- physical violence by a male or female perpetrator (34.4%);
- violence (physical and/or sexual) by a known male or female perpetrator (35.6%); and
- violence (physical and/or sexual) by a known male perpetrator (33.7%).
As previously discussed, the PSS collects information on individual incidents of violence by a partner rather than a pattern of violence and control, the latter being a common community and professional definition of domestic violence. The statistic from the PSS that relates most closely to domestic violence is that one in six women have experienced violence by a cohabiting partner (see commentary on “Why don’t you just call it domestic violence?” in Section 3: Women’s experiences of partner violence: 1.1 for an explanation of why using the term “domestic violence” may be misleading).
Regarding men, the statement “one in three victims of domestic violence are men” is also sometimes used. This figure relates to the group of men who have experienced violence by a cohabiting partner (male or female) since the age of 15. Specifically, the PSS estimates that 448,000 of the 1,928,000 victims of cohabiting partner violence were men, meaning that men represent 23.2% of this population and women represent 76.8% of this population.
There are several ways that the aforementioned “one in three” statements may be misconstrued:
- Statistics about the experience of incidents of violence do not necessarily mean that a person has experienced a pattern of violence and control over a period of time which is “domestic violence”. The PSS collects information about incidents of violence, not patterns over a period of time (see above).
- In addition, it is important to be clear on the population that is being considered. In the case of men’s experience of violence, the statement “one in three victims of cohabiting partner violence are men” has as its population all victims of violence in Australia (both male and female) from all perpetrators (both male and female). In comparison, the statement “one in three men in Australia experience cohabiting partner violence” has as its population all men in Australia. The first statement is correct, while the second is not – in fact, the second statement refers to the 448,000 adult men reporting cohabiting violence out of the Australian population of adult men and the correct figure would be “one in 20 men in Australia experience cohabiting violence”.
3 Incident characteristics: What happens in an incident of violence?
3.1 Injury
The following statistics relate to people who have experienced physical assault since the age of 15 and describe their injuries in their most recent incident of physical assault.
Both women and men were more likely to suffer fractured or broken bones/teeth when their assailant was male than when they were assaulted by a female perpetrator. Men were injured more often by male assailants than female, whereas women were injured in approximately equal proportions by male and female perpetrators.
In relation to their most recent physical assault by a male, both male and female victims were equally likely to be physically injured and to see a doctor about their injuries. In comparison to male victims, women had more changes in their routine as a result of their injuries. Women were more likely than men to be physically injured and to see a doctor about their injuries from their most recent physical assault perpetrated by a woman.
Graph F: Proportion and number of women and men, experience of injury in most recent incident of physical assault: By sex of victim and sex of perpetrator
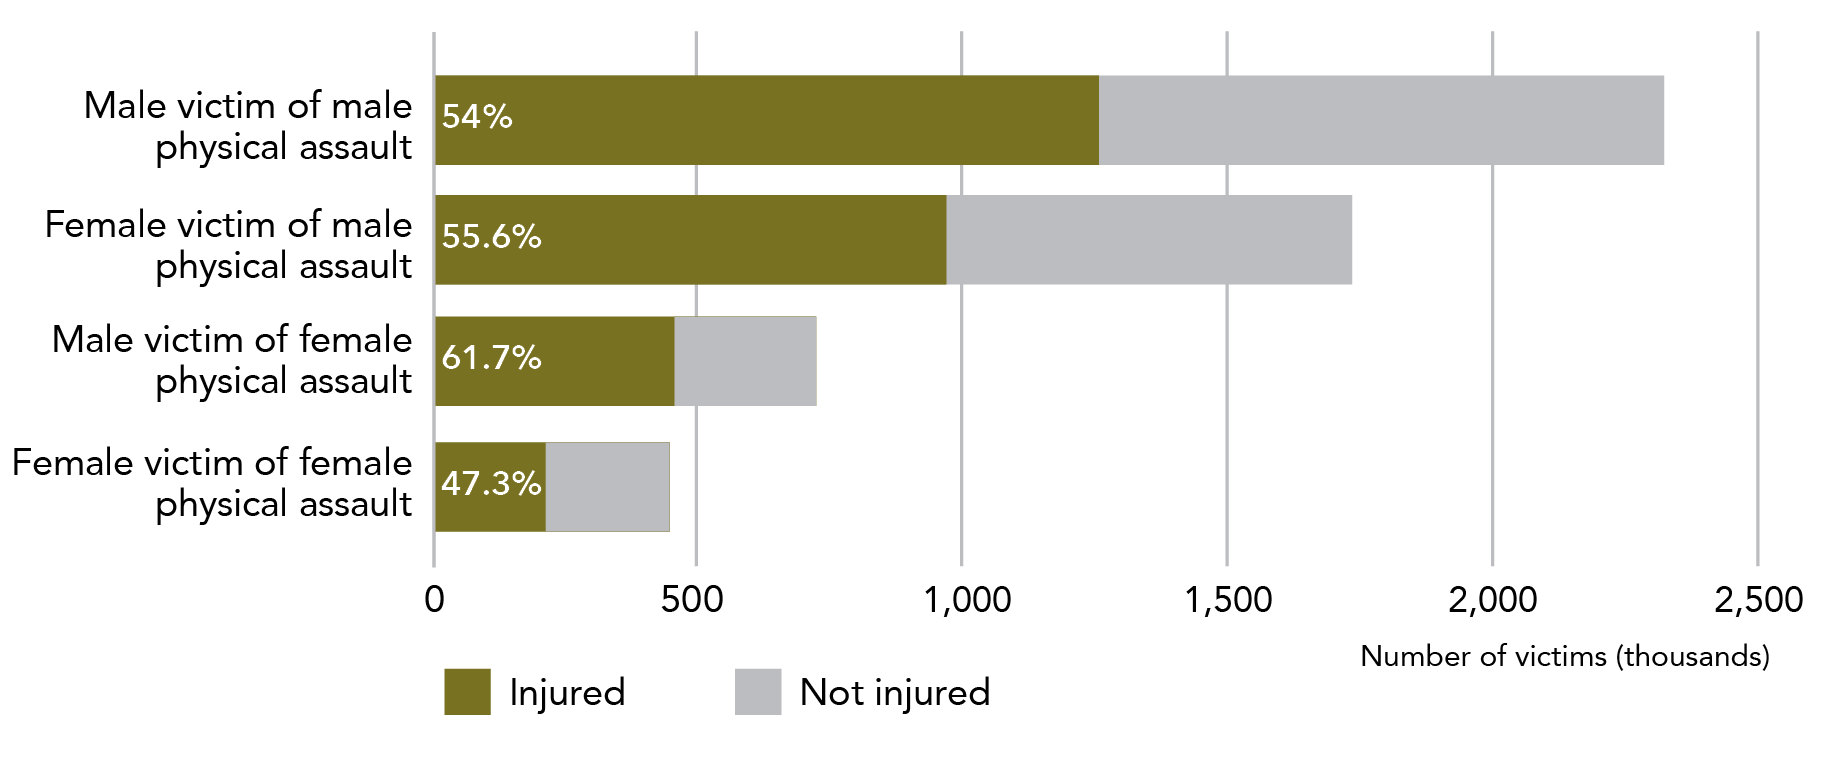
Data table for Graph F:
Perpetrator of violence Injured Not injured Male victim of male physical assault ~1,255,500 (54%) ~1,069,500 (46%) Female victim of male physical assault ~961,880 (55.6%) ~768,120 (44.4%) Male victim of female physical assault ~444,240 (61.7%) ~275,760 (38.3%) Female victim of female physical assault. 47.3% 52.7%
Note: Data relates to incidents since the age of 15.
Most recent incident (MRI) data and the separation of male and female perpetrators
The data in this section is based on reporting of an individual’s “most recent incident” of a particular type of violence. This means that the results do not refer to whether a person has ever done a particular thing (e.g. sought assistance from police) but rather whether they did so for the most recent instance of that type of violence.
MRI data is collected when the ABS asks a survey respondent about their most recent incident of eight types of violence (sexual assault, sexual threat, physical assault and physical threat by a male or female perpetrator). As part of this module, the participant answers who perpetrated the most recent incident.
MRI data does not provide information about patterns of violence; it only provides information about the most recent incident. For example, a person may have been hit 50 times by their boyfriend and once by their best friend, but if the most recent incident was being hit by their best friend, it will be the only one captured in the MRI data.
The MRI data is exceptionally useful for understanding in detail what happened in one instance of violence. By asking about the most recent incident, the ABS also gets the most salient (and thus, hopefully, accurate) data. By asking a lot of detail about one incident only, respondents are not overburdened and are also less likely to confuse incidents (e.g. “did that happen three times or four times ago?”).
MRI data is collected separately for male and female perpetrators. It is not possible to combine perpetrator types. This means that data in this section is always specific to the gender of the perpetrator and is therefore routinely represented in a 2×2 cube of perpetrator and victim gender.
MRI data is highlighted in orange to remind the reader that it should be used carefully.
Note: In the table below, the symbols  and
and  indicate whether there is a statistically significant difference between the statistics for male and female victims (the two columns). This testing has only been completed for the numbers within the row with the symbol.
Table B: Characteristics of physical injury after most recent incident of physical assault: By sex of victim and sex of perpetrator
Male perpetrator:
Icon Female victim Male victim 
In their most recent physical assault by a man, just over half of women were physically injured (55.6%): this is close to a million women. Of women who were physically injured:
In their most recent physical assault by a man, just over half of men were physically injured (54%). This is over 1.25 million men. Of men who were physically injured: Of men who were physically injured:

Nearly 900,000 women obtained scratches, bruises or cuts (92.7%). Over 1.1 million men obtained scratches, bruises or cuts (88.7%). 
One in 24 women were stabbed, shot or otherwise had a deep wound – this is 39,600* women (4.1%*). 70,400 men were stabbed, shot or otherwise had a deep wound inflicted: this is one in 18 men (5.6%). 10,400* experienced a miscarriage. 
Less than one in three women saw a doctor about their injuries (300,700, 31.5%). One in three men saw a doctor about their injuries (419,200, 33.4%). Six out of ten women had changes in routine as a result of their injuries (58.8%). Three out of ten men had changes in routine as a result of their injuries (30.5%). 
Changes in social/leisure activities (298,700, 31.3%), sleeping habits (305,300, 32%), building or maintaining relationships (26.1%, 249,100) were the most common. One in five men experienced changes to their social/leisure activities (244,600, 19.5%), and one in nine had changes to their work, school or study activities (141,100, 11.3%). Table A10, column B Table A10, column H
Female perpetrator:
Icon Female victim Male victim 
In their most recent physical assault by a woman, just over half of women were physically injured (236,000, 52.7%). Of women who were physically injured:
In their most recent physical assault by a woman, less than four out of ten men were physically injured (278,100, 38.3%). Of men who were physically injured:

93.2% of women sustained scratches, bruises or cuts (219,900) 94.6% of men sustained scratches, bruises or cuts (263,200). Less than 1% of women were stabbed, shot or otherwise had a deep wound inflicted (1,800**, 0.8%**). Approximately one in 20 men were stabbed, shot or otherwise had a deep wound inflicted (15,900*, 5.7%*). 
Less than three out of ten women saw a doctor about their injuries (68,100, 28.9%). One in seven men saw a doctor about their injuries (40,400*, 14.5%). Half of the women had changes in routine as a result of their injuries (50.1%). Three out of ten men had changes in usual routine as a result of their injuries (30.8%). Changes in social/leisure activities (86,800, 36.8%), sleeping habits (42,800, 18.1%) were common. – 
Changes in building or maintaining relationships (35,900, 15.2%) were also common. The only change in routine to effect more than one in ten men was building and maintaining relationships (35,300, 12.7%). Table A10, columns D and E Table A10, columns J and K
The changes to routine in this section relate to those that happen due to physical injuries. Many uninjured people will have also had changes in their usual routine; the experiences of these individuals are not reflected in the information above.
Why are all the similar numbers coming up as non-significant?
You may have noticed that the finding that a third of women and a third of men are physically injured was found to be “not significant”
 . Statistical significance testing is a way to test whether numbers are meaningfully different from one another. When it is applied to numbers that are similar, we anticipate that the result will be not significant. This does not mean that this similarity doesn’t matter, but rather indicates that the numbers are, in fact, alike.Instead of reading
  as meaning “this difference is not statistically significant” it may be more helpful in these cases to think of it as meaning “there is no (statistically significant) difference between X and Y”.
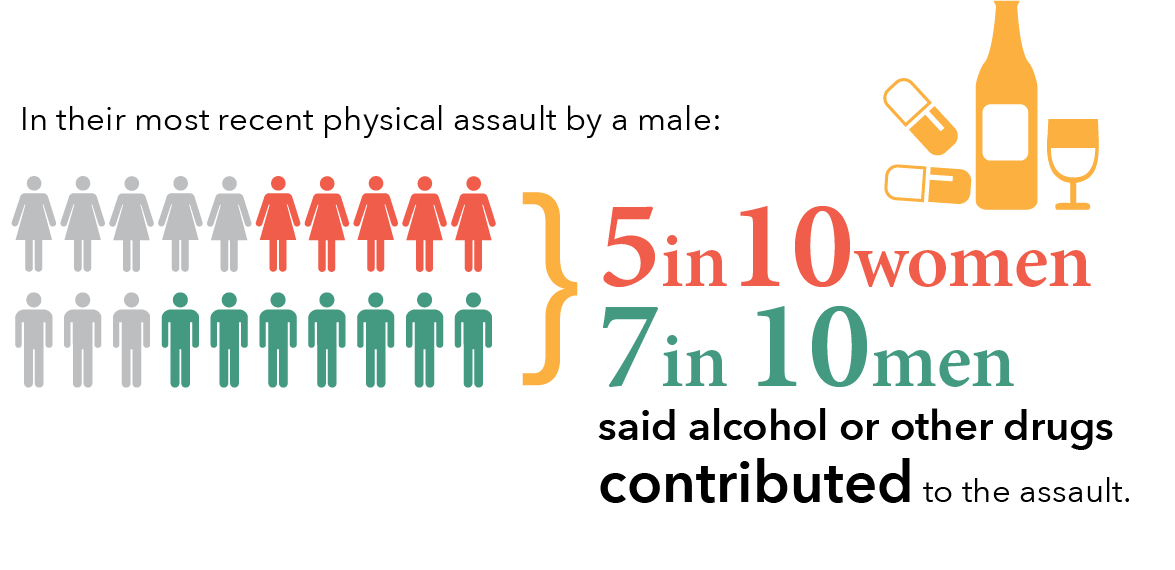
Graph G: Proportion of women and men, incidents involving alcohol, whether victim or perpetrator believed to be under the influence of alcohol or other drugs, most recent incident: By sex of victim
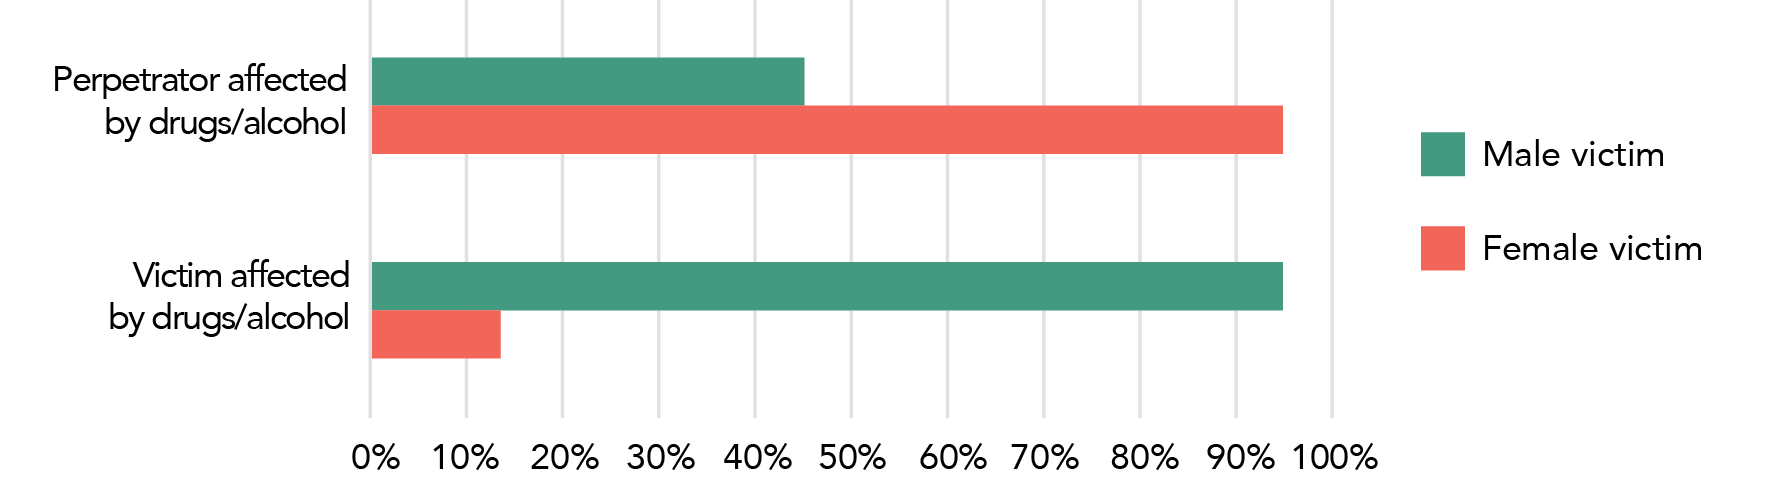
Data table for Graph G:
Group affected by drugs/alcohol Male victim Female victim Perpetrator affected by drugs/alcohol 45% 14% Victim affected by drugs/alcohol 95% 95%
Note: Data relates to incidents since the age of 15. This data is limited to most recent incident of physical assault by a male.
3.2 Alcohol and other drugs
The ABS asks people who had experienced violence since the age of 15 to describe the drug and alcohol use of both victim and perpetrator in their most recent incident of that specific form of violence. This data is collected separately for each of the 8 types of violence (sexual assault, sexual threat, physical assault and physical threat by a male and female perpetrator), however below we look mainly at their most recent incident of physical assault by a male.
Male victim
In nearly 1.6 million incidents, alcohol was believed to contribute to the most recent physical assault by a male. This is about seven out of ten incidents of physical assault of a male by another male (67.7%).
Tbl 18:H14, I14
Regarding their most recent physical assault by a male, male victims reported that:
- they were affected by drugs or alcohol in about 45% of these cases; and
- the perpetrator was affected by drugs or alcohol in 95% of cases.
Female victim
In over 900,000 incidents, alcohol or other drugs were believed to contribute to the most recent physical assault by a male. This is over half the incidents of physical assault of a female by a male (53.4%). A similar percentage was reported for:
- Sexual assault by a male (474,600, 55.7%); and
- Physical threat by a male (351,700, 50%).
Tbl 18: H26, H24, H30
Regarding their most recent physical assault by a male, female victims reported that:
- they were affected by drugs or alcohol in about 14% of these cases; and
- the perpetrator was affected by drugs or alcohol in 95% of cases.
What does “contributed to the incident” mean?
Survey respondents are asked whether they think drugs or alcohol contributed to their most recent incident of physical assault. If they answer “yes” to this question, they are then asked about the nature of the contribution, including whether they were under the influence of alcohol or other substances; whether alcohol or drugs were added to their drink without their consent; and whether they believed the perpetrator was under the influence of alcohol or drugs.
For each scenario, alcohol and other substances are asked about separately.

Graph H: Number of women and men, most common location of most recent incident of physical assault by a male: By sex of victim
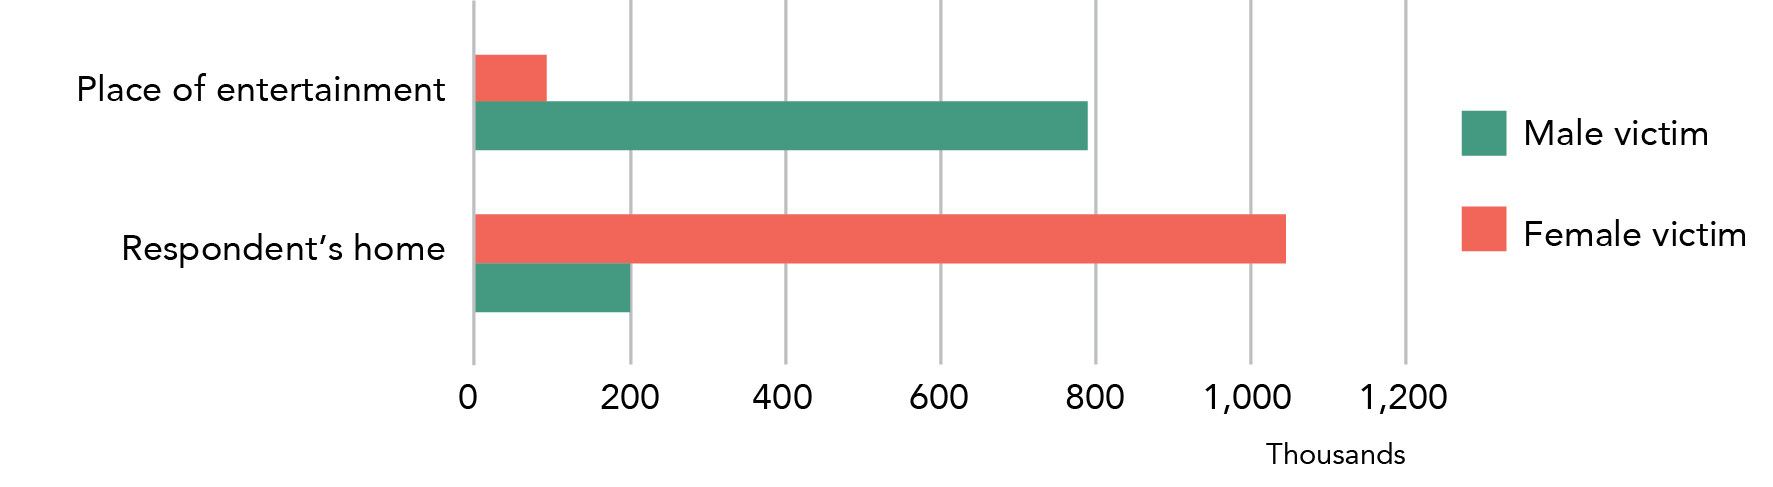
Data table for Graph H:
Location of assault Male victim Female victim Place of entertainment ~800,000 ~90,700 Respondent’s home ~200,000 ~1,040,000
Note: Data relates to incidents since the age of 15.
3.3 Location of incident
The following statistics relate to people who had experienced physical assault since the age of 15 and describe the location of their most recent physical assault.
Men were most likely to experience physical assault in a place of entertainment. Women were most likely to experience physical assault in their own home.
Male victim
For men, a place of entertainment was the most common place for their most recent physical assault:
Close to 800,000 men were physically assaulted by another male while in a place of entertainment. This is about a third of all most recent incidents of a man being physically assaulted by another man (34.1%).
Tbl 19: F17, G17
In addition, over 600,000 men experienced their most recent physical assault by a man outside. More than 300,000 men experienced this type of assault in their workplace.
F18, F16
Men were nine and a half times more likely than women to be physically assaulted by a man in a place of entertainment, with 90,700 women physically assaulted by a male in a place of entertainment. Approximately 100,000 women were physically assaulted by another woman in this location.
F32, H32
Female victim
For women, the most common place for their most recent physical assault to occur was their own home:
Over one million women experienced physical assault by a male in their own home. This represents six out of ten physical assaults of a woman by a man (61.5%).
Tbl 19: F28, G28
Approximately 2.7 times more women than men were assaulted by an opposite sex perpetrator in their home, with close to 400,000 physically assaulted by a woman in this location. In addition, close to 200,000 men were physically assaulted by another man in their home.
F13, H13
Whose home is it?
When a victim and perpetrator live in the same house, the house is categorised as the victim’s home. This means that a house that is categorised as a perpetrator’s house is not the residence of the victim, but a victim’s house may or may not be the perpetrator’s home. The ABS categorises residences in this way as the focus of the survey is on the experiences of the victim of the violence, not the perpetrator.
The most common place for a woman to experience her most recent assault was in a private residence – this was true across all assault types by same and opposite sex perpetrators.
For men, there is much more variation in the most common location of his most recent assault: assault perpetrated by women was most likely to occur in the victim’s home, while violence by another man most commonly occurred in a place of entertainment/recreation or an “other” site outside of the home or workplace .
Table C: Most common location of most recent incident of physical or sexual assault: By sex of victim and sex of perpetrator
Physical assault
Sex of perpetrator Female victim Male victim Opposite sex perpetrator Victim’s own home (1,055,200) Victim’s own home (388,700) Same sex perpetrator Victim’s own home (130,200) Place of entertainment/recreation (793,100)
Sexual assault
Sex of perpetrator Female victim Male victim Opposite sex perpetrator Victim’s own home (381,600) Victim’s own home (56,500*) Same sex perpetrator Perpetrator’s home (where this is not also the victim’s home) (9,400*) “Other” (including place of study, motel, serviced apartment, while waiting or using public transport etc.) (20,700**)
Table 19: Rows 13-19, 28-34
This sub-section has provided some detail of the nature of violent incidents experienced by women and men. Of note is how, for both women and men, injuries tended to be more severe when the assault is perpetrated by a male. In addition, violence in the context of alcohol and other drug use was reported more often by male victims than by female victims. In the next section, we examine the post-incident impacts of violence, as well as the actions that victims take after a violent episode.
What does it mean when you don’t have a statistical testing symbol for a section of text?
Statistical testing has only been performed for a minority of data points. These points were chosen because we thought it was likely that the data would be compared; or, that this type of testing was important in understanding the survey data. Thus, most statistical testing has occurred in this first section of the report that looks at the experiences of violence of women and men.
A statistical testing symbol is used for all instances where a statistical significance test has been completed. If there is no symbol, this means that the test has not been run by the researcher.
4 Post-incident actions and impacts: What happens after an incident of violence?
4.1 Police contact and court appearance
Women and men report similar progressions through the criminal justice system, with about a third of victims contacting police and less than 15% indicating that the perpetrator went to court. While there is some variation by perpetrator type, the overall pattern of steady withdrawal from the criminal justice system is consistent.
Below we provide details of police and court contact for men’s and women’s most recent physical assault. Data on police and court contact is collected through the most recent incident module of the PSS and therefore is unable to be aggregated for different violence types. We have chosen to focus on physical assault as it is the most common form of violence for both women and men, and therefore analysis of this data provides the most robust estimates. Less detailed data is available for sexual assault.
Victims aren’t always aware of judicial responses
It is important to note that information related to the charging of perpetrators and their attendance at court is from the viewpoint of the victim. This information is collected through the survey and relies on the victim’s understanding of the criminal justice response to their assault. In some cases, the victim may not be aware of the judicial processes related to their assault. This may affect the accuracy of the rates reported below.
4.1.1 Physical assault
The following statistics relate to people who have experienced physical assault since the age of 15 and describe their engagement with the justice system in relation to their most recent incident of physical assault.
Police contacted
A little under a third of victims contacted police about their most recent physical assault.
Tbl A11: Row 21
 Regarding women and men who had experienced physical assault by an opposite sex perpetrator, the proportion of female victims who contacted the police was higher than the proportion of male victims.
 There is no statistically significant difference in the proportion of victims who contacted police when comparing women and men who had experienced physical assault by a same sex perpetrator.
Perpetrator charged
In approximately a third of cases where the victim has gone to the police about their most recent physical assault, the respondent reported that the perpetrator was then charged.
Tbl A11: Row 26

There is no statistically significant difference in the proportion of perpetrators charged when comparing women and men who had experienced physical assault by an opposite sex perpetrator.

When considering male perpetrated physical assault, the rate varied slightly:
- 27.8% for male victims; and
- 39% for female victims.
Perpetrator went to court
In about eight out of ten cases, the respondent reported that the charged perpetrator went to court.
Tbl A11: Row 31

There was no statistically significant difference in this rate, regardless of the sex of the victim or perpetrator.
Why are these numbers different?
The statistics above are calculated by determining the percentage of people who have experienced a particular type of violence who go onto the next stage in the criminal justice process.
In contrast, the proportions below are calculated as a percentage of all men/women who have experienced a particular type of violence.
For instance, 219,600 women who were physically assaulted by a man reported that the perpetrator was charged. This is both:
- one in eight cases (12.8%) of women’s most recent incident of physical assault by a man (as below); and
- four in ten (39%) cases where the female victim had gone to the police about her most recent incident of physical assault by a man (as above).
Both statistics are correct – they are just looking at the same information in a different way.
What do you mean by “charged”?
A person is said to have been charged if they are charged with a criminal offence. This includes, but is not limited to, being charged with a breach of a domestic violence order.
Table D: Police involvement after most recent incident of physical assault: By sex of victim and sex of perpetrator
Male perpetrator:
Female victim Male victim Regarding their most recent physical assault by a man (1,716,300): Regarding their most recent physical assault by a man (2,322,800): In one in three instances, the woman contacted police (32.8%): this is more than half a million women. In one in three instances, the man (victim) contacted police (32.1%): this is three quarters of a million men. In one in eight cases, the victim reported that the male perpetrator was charged (219,600, 12.8%). In one in 11 cases, the victim reported that the male perpetrator was charged (207,200, 8.9%). In one in nine cases, the victim reported that the male perpetrator went to court (191,700, 11.1%): this is 87.3% of cases where the perpetrator was charged. In one in 14 cases, the victim reported that the male perpetrator went to court (163,300, 7%): this is 78.8% of cases where the perpetrator was charged. Table A11, columns B and C Table A11, columns H and L
Female perpetrator:
Female victim Male victim Regarding their most recent physical assault by a woman (448,000): Regarding their most recent physical assault by a woman (726,000): In one in three instances, the woman (victim) contacted police (31.6%): this is 141,400 women. In less than one in four instances, the man contacted police (18.8%): this is 136,400 men. In one in nine cases, the victim reported that the female perpetrator was charged (49,000, 10.9%). In one in 18 cases, the victim reported that the female perpetrator was charged (40,400*, 5.5%). In one in 11 cases, the victim reported that the female perpetrator went to court (42,100, 9.4%): this is 85.9% of cases where the perpetrator was charged. In one in 22 cases, the victim reported that the female perpetrator went to court (33,100*, 4.5%): this is 81.8% of cases where the perpetrator was charged. Table A11, columns D and E Table A11, columns J and K
With the exception of the last row of each square, the proportions above are calculated using the number of people having experienced the violence as the total (i.e., the first number in each square).
As discussed earlier in this section, both women and men were more likely to experience violence perpetrated by a man – for men, this violence was mostly perpetrated by strangers or by someone they knew (but were not in an intimate relationship with), while for women this violence tended to be perpetrated by a partner. It is likely that these differences in incident characteristics influence the difference in criminal justice system responses. For example, it seems logical that male-on-male violence resulted in less charges being laid, as laying charges against a stranger is likely to be more logistically difficult than laying charges against a partner.
As disaggregated sexual assault data for male sexual assault victims is not available, a full comparable analysis for sexual assault is not included in this publication.
The following statistics relate to people who have experienced sexual assault since the age of 15 and describe their actions in relation to their most recent sexual assault.
Table E: Police involvement after most recent incident of sexual assault: By sex of victim and sex of perpetrator

Sexual assault committed by a same sex perpetrator is a low prevalence crime. In the context of the PSS, this means that estimates related to these incidents have very high RSEs. Thus, even though more men (33.5%**) than women (4.3%**) had contacted police about being sexually assaulted by a same sex perpetrator, the difference in these numbers was not significant.

Regarding sexual assault committed by an opposite sex perpetrator, women were more likely to contact police than men.
Overall, this section demonstrates that police contact was more common for physical assault than sexual assault and that, regardless of the assault type, the sex of the victim or the sex of the perpetrator, only a minority of people reported their assault to police.
4.2 Advice and support
For both physical and sexual assault, and for both male and female victims, the majority of help seeking related to assaults perpetrated by males. This reflects both: a) the higher absolute numbers of victims in these categories; and b) the higher proportion of victims who sought advice and support about assaults perpetrated by men.
Telling someone is different to getting advice or support
In relation to their most recent incident of violence, the PSS asks participants both about sources of advice and support and people they have told about the incident. The PSS distinguishes between these two types of telling.
To tell someone about an incident only requires that you inform them about the incident: it does not require that the person give you any advice or support.
If you said to someone “John hit me the other day” – this would be telling them about the incident.
You would be getting advice or support if you said to someone “John hit me: could you help me work out what to do about it?”.
Graph I: Proportion and number of women and men, whether sought advice or support about most recent incident of physical assault: By sex of victim and sex of perpetrator
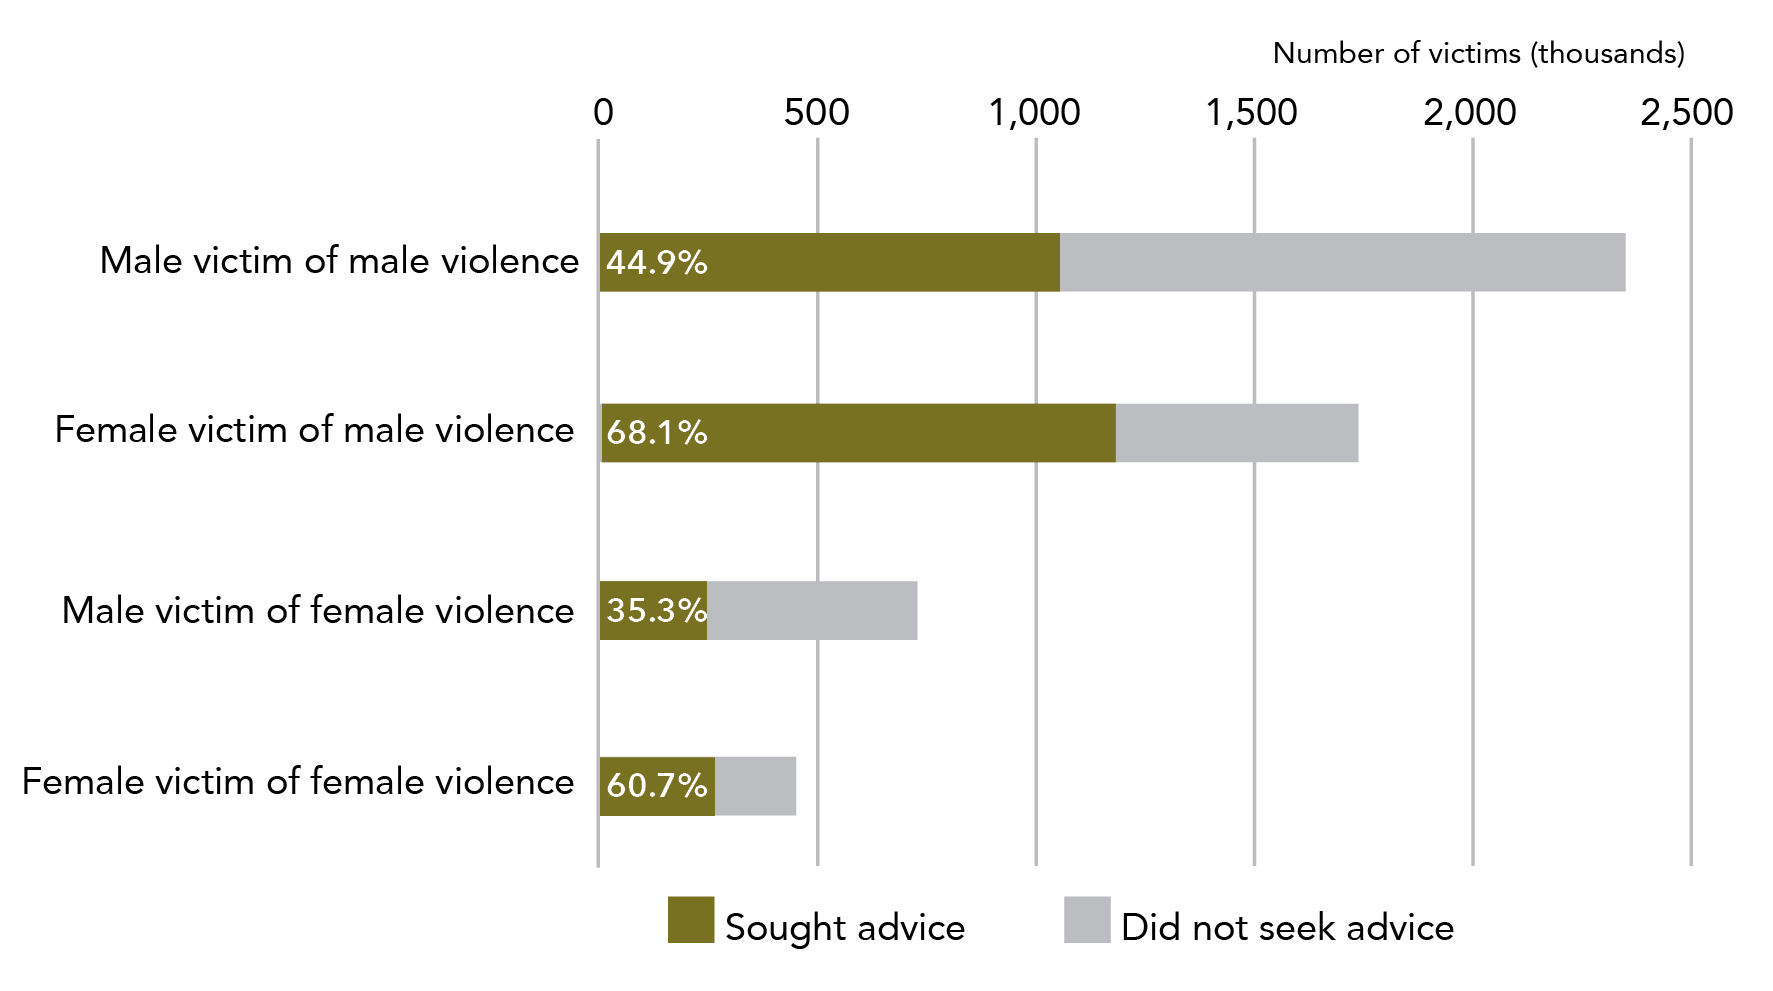
Data table for Graph I:
Victims of violence Sought advice Did not seek advice Male victim of male violence 44.9% 55.1% Female victim of male violence 68.1% 31.9% Male victim of female violence 35.3% 64.7% Female victim of female violence 60.7% 39.3%
Note: Data relates to incidents since the age of 15.
4.2.1 Physical assault
The following statistics relate to people who have experienced physical assault since the age of 15 and describe their actions in relation to their most recent physical assault.
Overall, women sought advice more than men. The highest proportion and largest number of victims who sought advice and support for their most recent physical assault were female victims of male violence.
Table F: Seeking of advice and support after most recent incident of physical assault: By sex of victim and sex of perpetrator
Sex of perpetrator Female victim Male victim Male perpetrator Of women who had experienced physical assault by a man (1,716,300): Close to seven out of ten women who had been physically assaulted by a male had sought support for their most recent incident (1,168,600, 68.1%).
Of men who had experienced physical assault by a man (2,322,800): A little under half of the men who had been physically assaulted by another man sought advice or support for their most recent incident (1,043,000, 44.9%).
Female perpetrator Of women who had experienced physical assault by a woman (448,000): Six out of ten women had sought support when the most recent assault was perpetrated by a woman (271,800, 60.7%).
Of men who had experienced sexual assault by a woman (726,000): A bit over a third of men who were physically assaulted by a woman had accessed support for their most recent incident (256,600, 35.3%).
Tables 16 and A11

Regarding their most recent physical assault, men sought support and advice less often than women (44.9% vs 68.1% for physical assault by a male perpetrator, 35.3% vs 60.7% for physical assault by a female perpetrator).
Tbl 16: C13, C25, C14, C26
Graph J: Proportion and number of women and men, whether sought advice or support about most recent incident of sexual assault: By sex of victim and sex of perpetrator
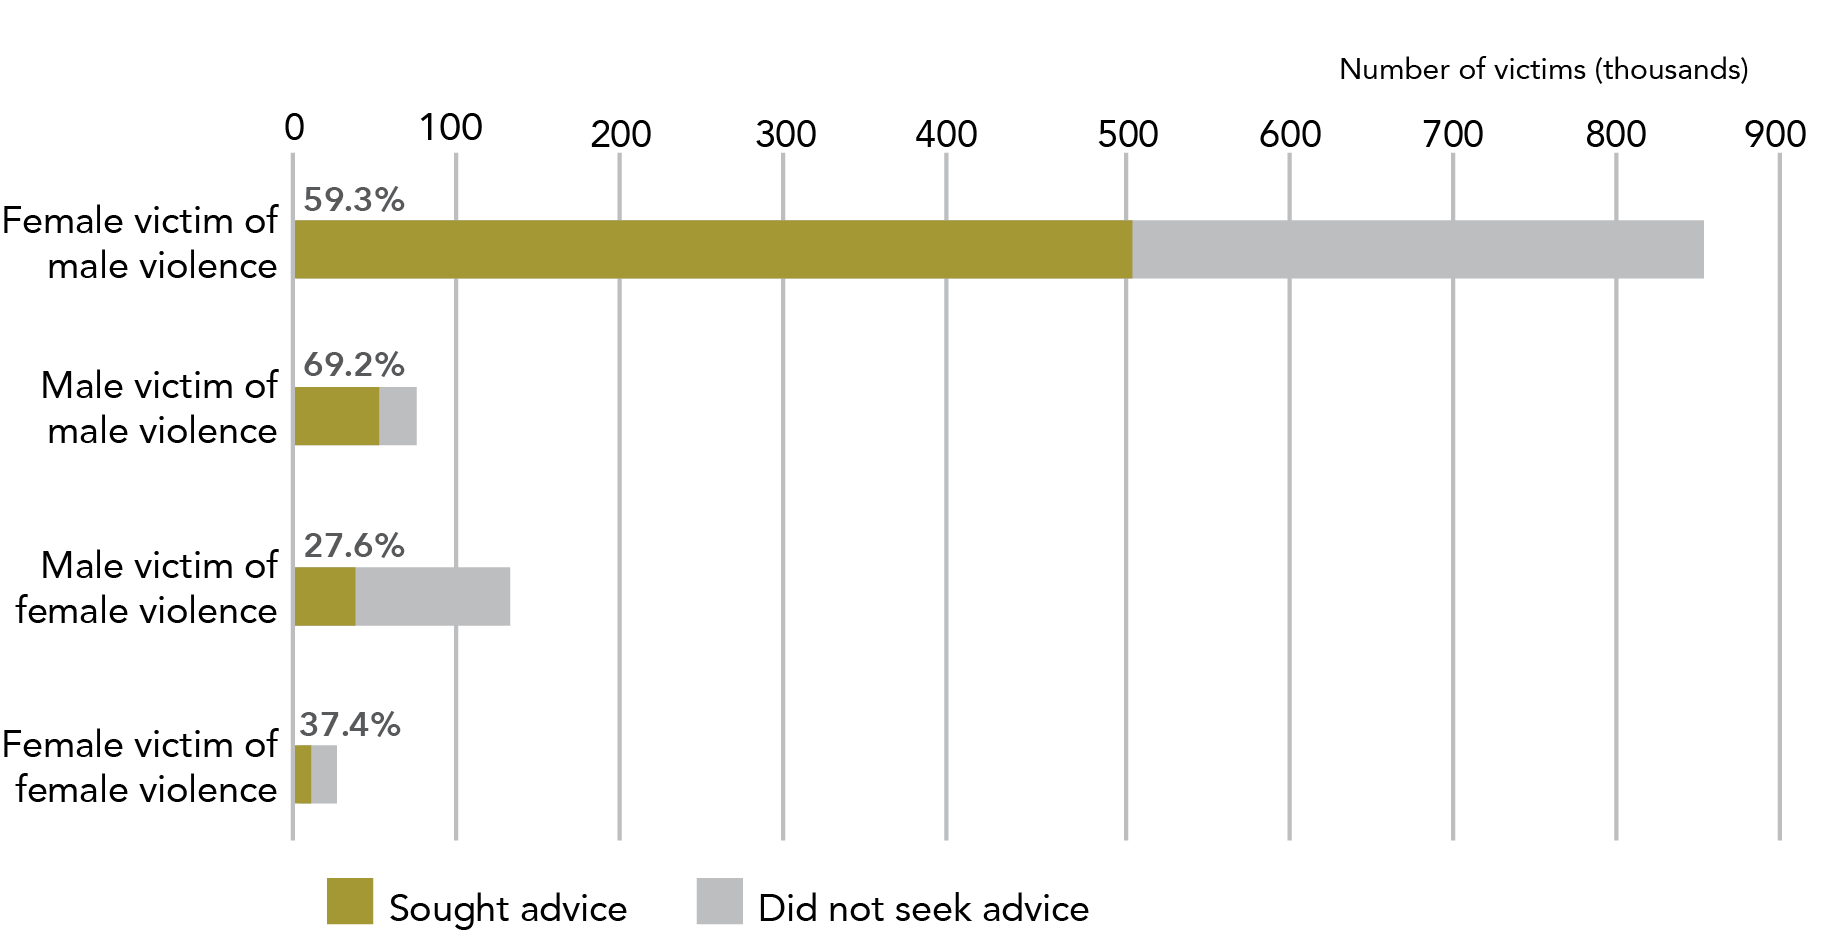
Data table for Graph J:
Note: Data relates to incidents since the age of 15.
4.2.2 Sexual assault
The following statistics relate to people who have experienced sexual assault since the age of 15 and describe their actions in relation to their most recent sexual assault.
Both women and men sought advice and support more often for sexual assaults by a male perpetrator than by a female perpetrator.
Table G: Seeking of advice and support after most recent incident of sexual assault: By sex of victim and sex of perpetrator

There was no statistically significant difference in the rate of advice seeking for women and men who experienced sexual assault by a same sex or opposite sex perpetrator.

Regarding sexual assault committed by an opposite sex perpetrator, women were more likely to contact police than men.
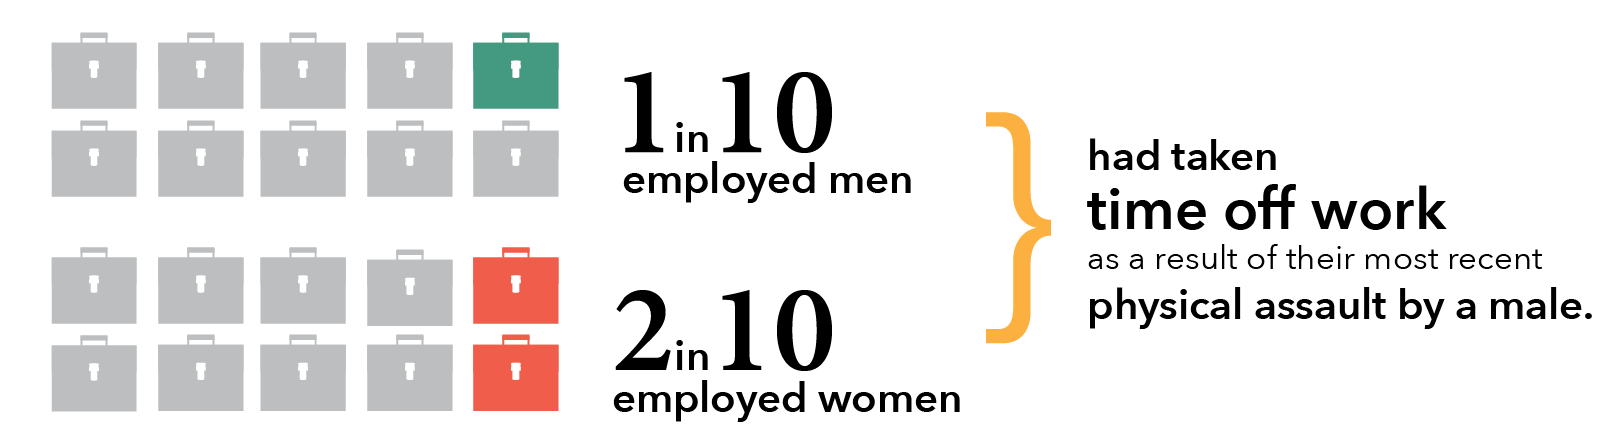
4.3 Time off work
The following statistics relate to people who had experienced violence since the age of 15 and describe whether they took time off work for their most recent physical or sexual assault.
One in ten employed men, and one in five employed women had taken time off work in the year after their most recent physical assault by a male.
Most recent incident of physical assault by an opposite sex perpetrator
238,600 women took time off work as a result of their most recent physical assault by a male: this represents 20% of the women who had experienced this type of assault and were working during that period.
Tbl 20: B11
47,500* men took time off work as a result of their most recent physical assault by a female: this is 7.6% of men who experienced this type of assault and were in work during this period.
B14
Most recent incident of physical assault by a same sex perpetrator
22,900 women took time off as a result of their most recent physical assault by a female: this is 7.8% of women who experienced this type of assault and were in work during this period.
Tbl 20: B22
199,200 men took time off work in the 12 months after their most recent incident of physical assault by a man: this is 10.4% of men who experienced this type of assault and were in work during this period.
B13
Most recent incident of sexual assault by an opposite sex perpetrator
93,200 women who had experienced sexual assault by a man took time off work in the year following their most recent incident. This is:
- 10.9% of all women who had experienced sexual assault by a man; and
- 17% of women who experienced this type of assault and were working during this period.
Tbl 20: B19
8,300** men took time off work as a result of a sexual assault by a female: this is 7.2% of men who were sexually assaulted by a woman and were working during this time.
B12
Most recent incident of sexual assault by a same sex perpetrator
2,100** women took time off as a result of their most recent sexual assault by a woman. This is 11.4%** of women who were sexually assaulted by a woman and were working during this time.
Tbl 20: B20
2.8%** of men who were sexually assaulted by another man took time off work after their most recent incident. The estimated number of men who took time off work after a sexual assault by a male perpetrator was not available.
B11
Between 7.8% (physical assault by a female) and 20% (physical assault by a male) of employed women reported taking time off work in the year following the assault. In contrast, between 2.8% (sexual assault by a male) and 7.8% (physical assault by a male) of employed men reported taking time off due to their most recent assault.
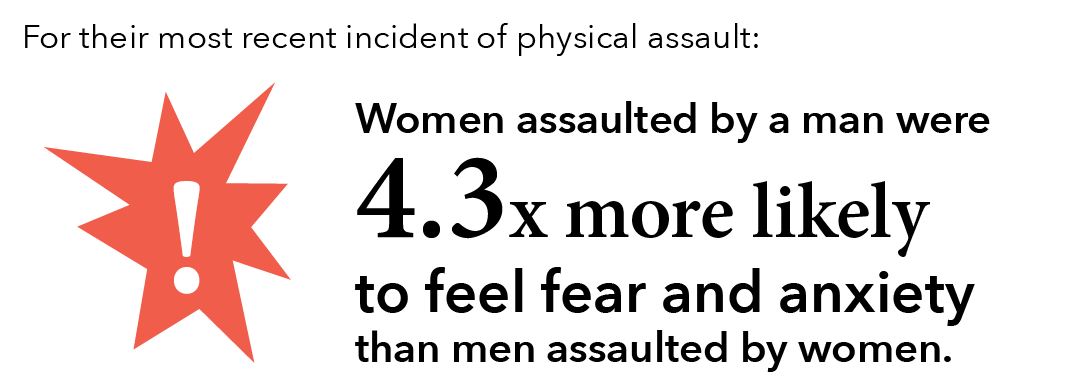
4.4 Fear and anxiety

When compared to male victims, 1.9 times as many women were afraid in the 12 months after their most recent physical assault by a man (524,100 vs 1,007,900).
Tbl A11: H10, B10
When we look at the percentage of victims who had experienced anxiety in the year after the assault, women who were physically assaulted by a male were:
-
 2.6 times more likely to feel fear or anxiety than men who had been physically assaulted by a male; and
-
 4.3 times more likely to feel fear or anxiety than men who had been physically assaulted by a female.
Table H: Fear and anxiety after most recent incident of physical assault: By sex of victim and sex of perpetrator
Sex of perpetrator Female victim Male victim Male perpetrator Of women physically assaulted by a man (1,716,300):  12 in 20 women reported having experienced anxiety or fear in the year after the most recent incident (58.7%).
This is an estimated 1,007,900 women
Of men physically assaulted by a man (2,322,800): Five in 20 men reported having experienced anxiety or fear in the year after the most recent incident (22.6%).
This is an estimated 524,100 men.
Female perpetrator Of women physically assaulted by a woman (448,000):  Eight in 20 women reported having experienced anxiety or fear in the year after the most recent incident (40.2%).
This is an estimated 180,300 women.
Of men physically assaulted by a woman (726,000): Three in 20 men reported having experienced anxiety or fear in the year after the most recent incident (13.6%).
This is an estimated 98,600 men.
Table 17, Rows B and F
More than half of women physically assaulted by a man reported feeling fear and anxiety after their most recent assault. This is the only group of physical assault victims where a majority of respondents reported feeling fear and anxiety.
Graph K: Proportion of women and men who experienced anxiety and fear after their most recent incident of violence: By sex of victim and sex of perpetrator
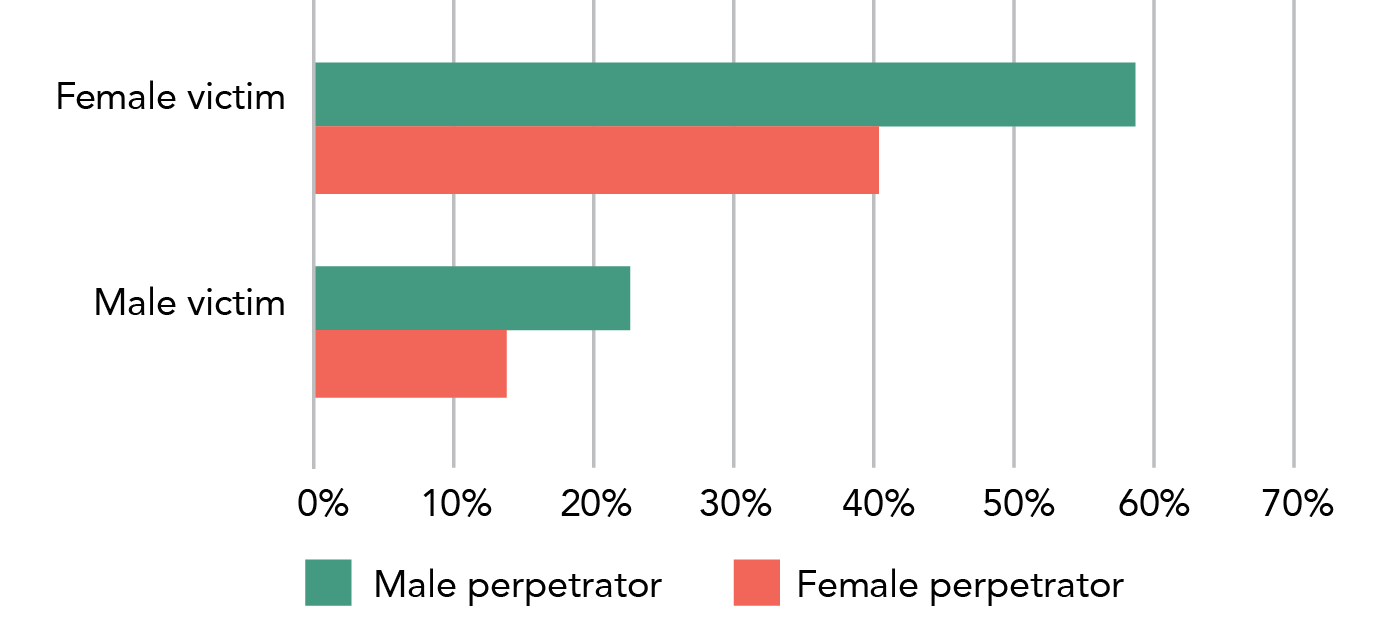
Data table for Graph K:
Location of assault Female victim Male victim Male perpetrator 58% 22.5% Female perpetrator 41% 14%
Note: Data relates to incidents since the age of 15.
In relation to their most recent physical assault, both time off work and fear and anxiety affected a greater proportion of female victims than male victims. Women seek advice and support more often than men, possibly due to the increased likelihood that they are dealing with violence perpetrated by someone they know and/or who they live with. Engagement with the police and courts is a consequence of a minority of assaults, regardless of the sex of the victim or perpetrator. Both women and men experience substantial, and at times debilitating, impacts after a violent incident.
In the next section, we examine in detail data related to women’s experiences of sexual assault.
Section two: Women’s experiences of sexual assault
Sexual assault is experienced by one in six women in Australia. These assaults are almost all perpetrated by men known to the victim. In comparison to other assault types, a smaller percentage of women contacted police about sexual assault. Sexual assaults have substantial post-incident impact, with most women reporting being fearful or afraid in the year after their most recent sexual assault by a male. One in six women have never told anyone about their most recent sexual assault by a male.
This section examines the nature and impact of sexual assault, including its prevalence in the Australian female population; victim demographics; perpetrator demographics; incident characteristics; and post-incident actions and impacts.
Contents for this section
1. Prevalence: How many women are sexually assaulted?
2 Victim demographics: Who does sexual assault happen to?
2.2 State or territory of residence
3 Perpetrator demographics: Who perpetrated the sexual assault?
3.1.1 Sexual assaut by intimate partners
3.1.2 Sexual assault by others
3.2 In the 12 months prior to the survey
4 Incident characteristics: What happened in a sexual assault incident?
4.2.1 Consumption of alcohol and other drugs
4.2.2 Consumption of alcohol and other drugs by perpetrator type
5 Post-incident actions and impacts: What happens after a sexual assault?
5.1.1 Police contact – comparison to other assault types
5.1.2 Contact with police by victim demographics
5.1.3 Contact with police by perpetrator type
5.1.4 Reasons for not contacting the police by perpetrator type
5.2.2 First person told by perpetrator type
5.2.3 Sought advice or support
5.2.4 Advice seeking by victim demographics
5.2.5 Source of advice by perpetrator type
5.3.1 Time off work by perpetrator type
5.3.2 Time of work by victim demographics
5.3.3 Women not in the workforce
Women only from now on!
Section 1 of this report gives an overview of the gendered nature of violence in order to put the rest of the report into context. In the remaining sections – and consistent with the scope of this report and ANROWS’s mandate under the National Plan to Reduce Violence against Women and their Children 2010-2022 – we focus on a description of the victimisation of women.
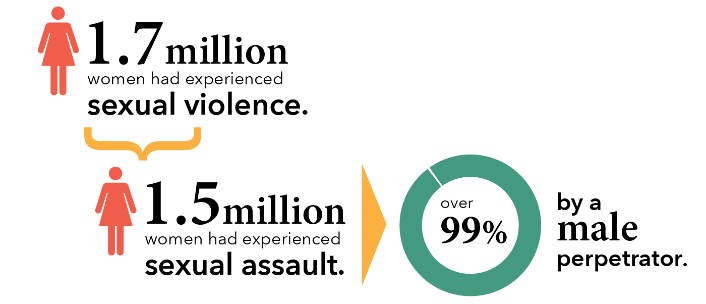
1 Prevalence: How many women are sexually assaulted?
1.2 Since the age of 15
Sexual violence (assault or threat)
Women were more than four times as likely as men to have experienced sexual violence.
Over their adult lifetime, 1.7 million women had experienced sexual violence. This is approximately one in five women (19.4%).
Tbl 1: D39
Sexual assault
Nearly 1.5 million women had experienced sexual assault since the age of 15. This represents:
- 17.1% of all women in Australia; and
-
two out of five (42%) women who had experienced any form of violence since the age of 15.
Tbl 1: D37
Of women who had experienced sexual assault, 99% had experienced sexual assault by a man.
1.3 In the last 12 months
In the year prior to the survey, just over 100,000 women had experienced sexual assault and/or sexual threat.
Tbl 1: D23
87,800 women were sexually assaulted in the year prior to the survey. This is:
- Approximately one in five (18.8%) women who had experienced any form of violence in this period; and
- 1% of the entire female population of Australia.
D21
Violence vs assault
The PSS defines assault as a subset of violence:
- Sexual assault is defined as “an act of a sexual nature carried out against a person’s will through the use of physical force, intimidation or coercion, and includes any attempts to do this. This includes rape, attempted rape, aggravated sexual assault (assault with a weapon), indecent assault, penetration by objects, forced sexual activity that did not end in penetration and attempts to force a person into sexual activity. Sexual assault excludes brief unwanted sexual touching”.
- Sexual violence is defined as sexual assault or the threat of assault (where the victim reasonably believes that the assault could be completed).
This means that all women who have experienced sexual assault will have experienced sexual violence, and more women will have experienced sexual violence than experienced sexual assault.
But isn’t that just wordy?
You may have noticed that the report says “women in Australia” not “Australian women” – this is because you don’t need to be an Australian citizen to complete the survey, you just have to live here.

2 Victim demographics: Who does sexual assault happen to?
When compared to the 12-month national rate of sexual assault, young women (aged 18-24 years) have a higher rate and older women (aged 55+ years) have a lower rate. Apart from these two groups, there was no statistically significant variation in prevalence identified in the data. Research from other sources suggest more between-group differentiations than the PSS has identified. This difference from other research is likely to reflect two key factors:
- Victim demographic analysis must use data related to victimisation in the 12 months prior to the survey. As victim demographics change over time (people get older, they move state, they get a new job), it would be misleading to use lifetime data (i.e. since the age of 15). However, the use of prior year data reduces the sample size, thus increasing the RSE and making it more difficult for variations between groups to be classified as statistically significant.
- Challenges in accessing marginalised communities due to language and structural constraints (see below).
Overall, this section identifies minimal demographic variation in 12 month prevalence of sexual assault.
Graph L: In the last 12 months, proportion of women experiencing sexual assault: By sociodemographic characteristics
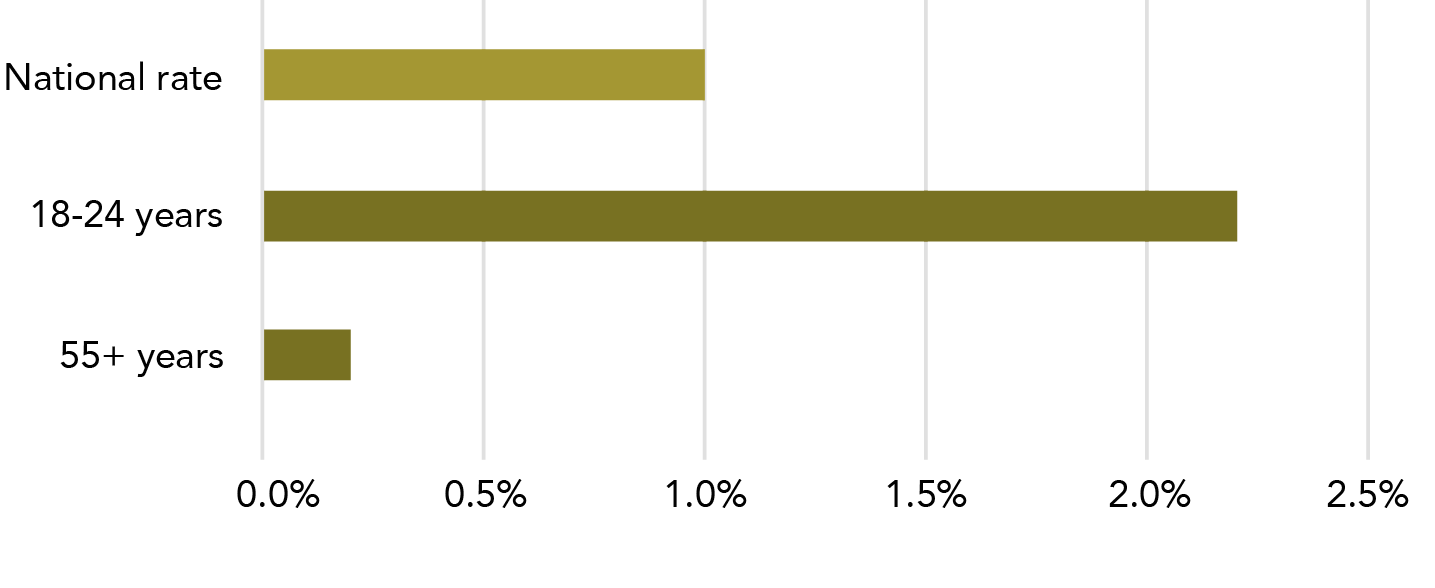
Data table for Graph L:
Sociodemographic characteristic Percentage National rate 1.0% 18-24 years 2.2% 55+ years 0.2%
Note: Includes only sociodemographic characteristics with a 12 month sexual assault rate that is statistically significantly different from the national 12 month sexual assault rate.
Statistical significance has been determined against the national rate
- Statistical testing has been completed for the information in this section.
- All significance testing has been against the national rate for sexual assault in the last 12 months (1%).
- The significance of differences in rates within a group (e.g. between different ages) has not been calculated.
What does statistically significant mean?
Statistical significance testing is a way of determining whether the difference seen between numbers is likely to be a result of a “real” difference or as a result of the research sample. When we say that a difference is “statistically significant”, we are indicating that, according to accepted statistical modelling, in at least 19 out of 20 cases, the difference is “real” and not a chance variation in sample characteristics.
Another way of understanding this is to say that based on a statistical test, we can be 95% sure the result is not by chance but is an accurate representation of the phenomenon; in this case, the difference in rates of sexual assault experienced by particular demographic groups as compared to the national rate.
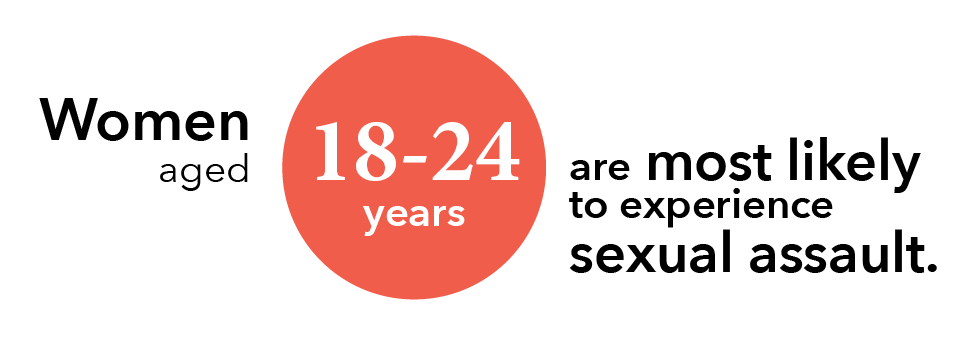
2.1 Broad age groups
The rate of sexual assault varied significantly with age. Young women were at increased risk when compared to the national average, with 2.2%* (23,500*) of women aged 18-24 years having experienced sexual assault in the last 12 months.
Tbl A3: C18
Older women were at decreased risk when compared to the national rate, with 0.2%* (7,000)* of women aged 55 years and older having experienced sexual assault in the previous 12 months.
C22
 The difference between the rates for women aged 18-24 and those over 55 years and the national rate was statistically significant.
2.2 State or territory of residence
Rates of sexual assault of women during the last 12 months did not vary significantly between jurisdictions. Six out of eight jurisdictions had a rate of sexual assault between 0.9%* and 1.2%*. The ACT had a rate of 1.8% and Victoria had a rate of 0.7%*, however there was no statistically significant difference in rates when compared to the national average.
Tbl A3: C8 – 15
Why are you talking about differences that are not statistically significant?
Sometimes the estimated populations were quite different for two groups of respondents but the difference between the groups was not statistically significant. This happens when there is a high RSE for one or both estimates.
We report these non-statistically different numbers as they provide a complete picture of the PSS data and allow the reader to note the full range of estimates that are of interest to them. We do, however, also acknowledge that the differences are unlikely to reflect “real life” differences.
As a compromise between comprehensibility and statistical exactness, we have attempted to provide commentary around non-statistically different numbers without explicitly comparing them.
2.3 Country of birth
Last 12 months

Just over 1% of women who were born in Australia had experienced sexual assault in the last 12 months (67,600, 1.1%). For women who were born overseas, the rate was 0.7%* (20,100*). The difference between these rates and the national rate was not statistically significant.
Tbl 15:C14, C18
Since the age of 15
The difference in rates by country of birth was more noticeable when considering sexual assault since the age of 15. 19.2% (1,159,700) of women born in Australia and 12.4% (334,300) of women born overseas had experienced adult sexual assault. For women born in countries where English was not the main spoken language the rate was 9.3% (162,800), which is less than half the rate for women born in Australia.
Tbl 15:G14, G18, G17

There is a statistically significant difference between the national rate (17.1%) and the rates for women: born overseas; born in a non-English speaking country; and, born in Australia.
G11
What is a main English speaking country?
The ABS defines the United Kingdom, the Republic of Ireland, New Zealand, Canada, South Africa and the United States of America as “main English speaking countries”.
A “non main English speaking country” is any country that is not listed as a “main English speaking country.”
Tbl A17: Footnotes
Does this seem surprising to you?
The ABS acknowledges that the PSS may under-represent people from culturally and linguistically diverse communities. This is because the survey is primarily completed in English. While the ABS provides some foreign language interviewers, this is not always sufficient to ensure that all selected respondents who don’t speak English are able to complete the survey.
2.4 Labour force

There was no difference in the rate of sexual assault for women who were employed and those that were unemployed or not in the labour force: the rate of sexual assault experienced for both groups in the 12 months prior to the survey was 1%.
Tbl A3:C25, C26
How does the PSS define “employed”?
- The PSS uses the standard ABS definition of employment. It includes as “employed”, amongst other scenarios, a person who in the week prior to the interview:
- worked at least an hour for pay (or without pay in a family business);
- was on strike;
- was on workers compensation (and expected to return to work); or
- was an employer.
Glossary
2.5 Level of education

There was no statistically significant difference in rate of sexual assault for women who have (0.9%) and have not (1.1%) received a post-school qualification (e.g. a vocational training qualification or university degree).
Tbl A3:B30, B29
2.6 Disability status
1.5% of women with a disability had experienced sexual assault in the last year (42,800). In comparison, 0.8% of women without a disability had experienced sexual assault in the same time period (45,000).
Tbl A3: B53, B54
Women with a disability represent about half of all female victims of sexual assault in the 12 months before the survey.
 The difference between these rates and the national rate was not statistically significant.
What counts as disability?
The PSS uses a standard measure of core activity limitation that is used in other ABS surveys. The measure assesses the extent to which a person “needs help, has difficulty, or uses aids or equipment with [self-care, mobility or communication]”. A person may be defined as having a profound, severe, moderate or mild disability, depending on the level of core activity limitation that they experience.
A person must have experienced, or be likely to experience, the limitation for at least 6 months in order for them to be classified as a person who has a disability or long-term health condition.
The PSS only selects respondents from private dwellings. Therefore, no women or men living in institutional care settings were interviewed as part of the survey. This is likely to affect the quality of the data related to this population.
Glossary
2.7 Socio-economic status
The ABS provides a range of measures of socio-economic status. The measures selected for this analysis were:
- household weekly income (the amount of money a single household receives each week); and
- the Socio-Economic Indexes For Areas (SEIFA) ranking for the area in which the respondent lives (this measure considers various indicators of socio-economic status for the area in which a person lives).

24,500 (1.8%) women from the most disadvantaged areas (lowest SEIFA quintile) experienced sexual assault in the 12 months prior to the survey. The number of sexual assaults in the other quintiles was between 15,200* and 16,400* (0.8-1%*).
Tbl A3: B46, B47-B50
What is a socio-economic quintile?
The ABS has developed several measures of socio-economic status. The data collected in the ABS Census of Population and Housing allows for the calculation of Socio-Economic Indexes For Areas (SEIFA) rankings for areas. One of these is the Index of Relative Socio-economic Advantage and Disadvantage (IRSAD). Data about the location of PSS respondent’s households can be considered within these rankings. The IRSAD “summarises information about the economic and social conditions of people and households within an area, including both relative advantage and disadvantage measures”.
IRSAD data is presented using quintiles: a quintile is a “grouping that result[s] from ranking households by [the IRSAD rate] and then dividing the population into… five equal groups”.
Household income is also grouped by quintile.
For more information on the IRSAD, see: https://www.abs.gov.au/ausstats/abs@.nsf/Lookup/2033.0.55.001main+features100042011
Where are the statistics on Aboriginal and Torres Strait Islander people?
The PSS does not publish data relating to a person’s Aboriginal and Torres Strait Islander status because they are unable to collect a representative sample of this population.
The ABS and the PSS Survey Advisory Group have agreed that the current survey may not be culturally appropriate for collection from all Aboriginal and Torres Strait Islander persons, with a large amount of investigation, engagement and design work required to ensure maximum data quality. Further, given that approximately one in five Aboriginal people live in remote areas, it is practically difficult to obtain a sample that would allow the ABS to create meaningful estimates related to violence experienced by Aboriginal and Torres Strait Islander people. Some Aboriginal and Torres Strait Islander people in urban and regional areas of Australia may be randomly selected to be part of the survey, however we do not know the extent of this sampling as this data is not collected.
The ABS has a specific Aboriginal and Torres Strait Islander statistics program and acknowledges that quality statistics for Aboriginal and Torres Strait Islander Australians are of critical importance. They are continuing to work with stakeholders and communities to find the best ways to collect data on Aboriginal and Torres Strait Islander Australians’ experiences of violence.
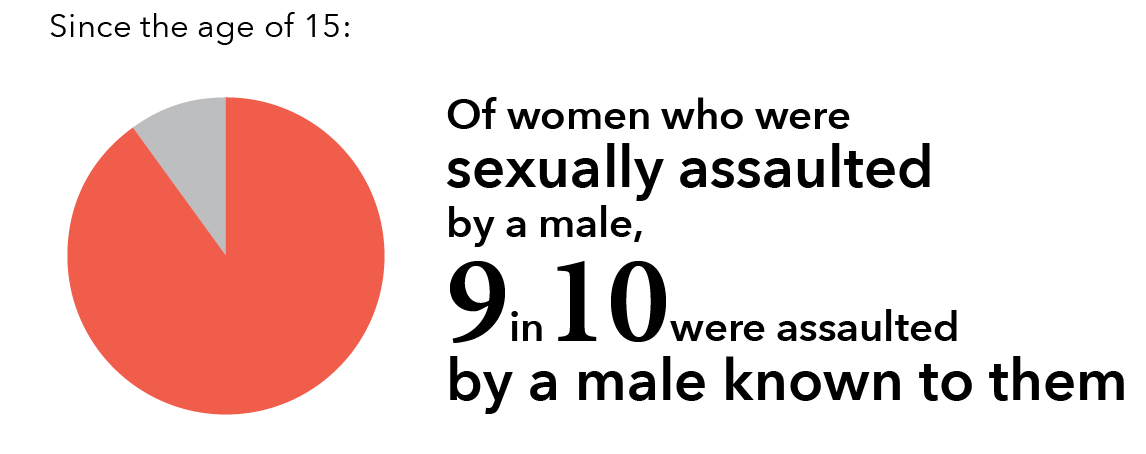
3 Perpetrator demographics: Who perpetrated the sexual assault?
This sub-section examines the relationship between the victim and perpetrator of a sexual assault. The data used in this section relates to the part of the PSS where a respondent is asked about their relationship to the perpetrator at the time of the survey (as opposed to their relationship at the time of the assault). We examine three sets of perpetrator data – the more inclusive “since the age of 15” data, and the two sub-sets of “in the last 12 months” and “most recent incident”. In all cases, women were most likely to be assaulted by someone known to them, with intimate partners (including former and current cohabiting partner, as well as boyfriend/girlfriend/dates) being a substantial portion of this population.
Three kinds of perpetrator data
There are two main reasons why we have provided multiple accounts of the relationship of the victim to the perpetrator:
- The most common perpetrator varies depending on the time frame used.
- The different populations of perpetrators relate to different sections of this report. Specifically:
- Lifetime data (since the age of 15) is most valuable when considering prevalence (part 1 of this section).
- Previous year data is used for victim demographics (part 2 of this section).
- Most recent incident data is used for both incident characteristics (part 4) and post-incident actions and impacts (part 5).
Due to the variation in the data, it is valuable to include all three datasets as each provides a different piece of the puzzle, with none “more true” than the others.
3.1 Since the age of 15
The information in this section:
- Is useful for considering the overall pattern of experiences of sexual assault;
- Can be related to Section 2: 1.1 Prevalence: Since the age of 15; and
- Relates to male perpetrators.
1.5 million women have experienced sexual assault since the age of 15: this is one in six women in Australia.
Tbl 1: D37
3.1.1 Sexual assault by intimate partners
Intimate partner (includes cohabiting partner and boyfriend/date)
Since the age of 15, 805,900 women were sexually assaulted by a male intimate partner: this is one in 11 women in Australia (9.2%).
Tbl A1: H12
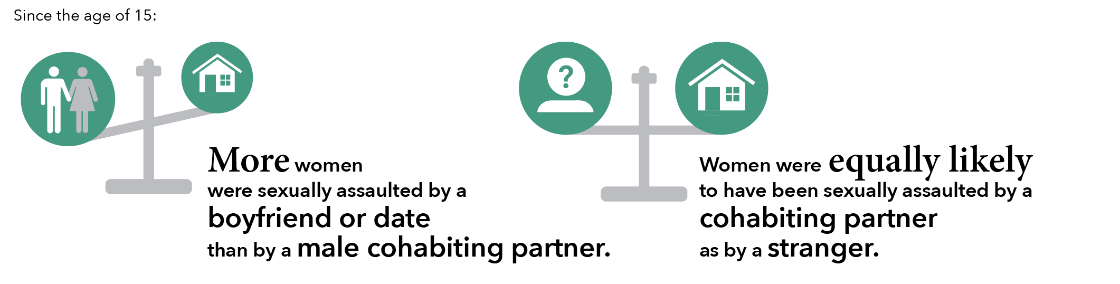
The number of women sexually assaulted by a female partner was too small to report.
H22
Cohabiting partner
At the time of the survey:
- 44,200 women were in a cohabiting relationship with a man who had sexually assaulted them (current partner). This is 3% of women who had been sexually assaulted by a male perpetrator since the age of 15.
- 354,100 were separated from a male cohabiting partner that sexually assaulted them (former partner). This is 23.7% of women who have been sexually assaulted by a male perpetrator since the age of 15.
Tbl A1:H13, H14
Boyfriend/date
Close to half a million women had been sexually assaulted by a boyfriend or male date (469,900). This is a greater number of women than the number who had been sexually assaulted by a male cohabiting partner.[5]
Tbl A1:H15
3.1.2 Sexual assault by others

Women were equally likely to be assaulted by a (male or female) cohabiting partner (397,500) as by a (male or female) stranger (335,000).
Tbl 12: D33
Reminder!
The category of cohabiting partner includes both former and current partners who have lived with the survey respondent in a marriage or de facto relationship.
The category of intimate partner includes both cohabiting partners and boyfriends/girlfriends/dates.
Graph M: In the last 12 months, number of women experiencing sexual assault: By relationship to male or female perpetrator
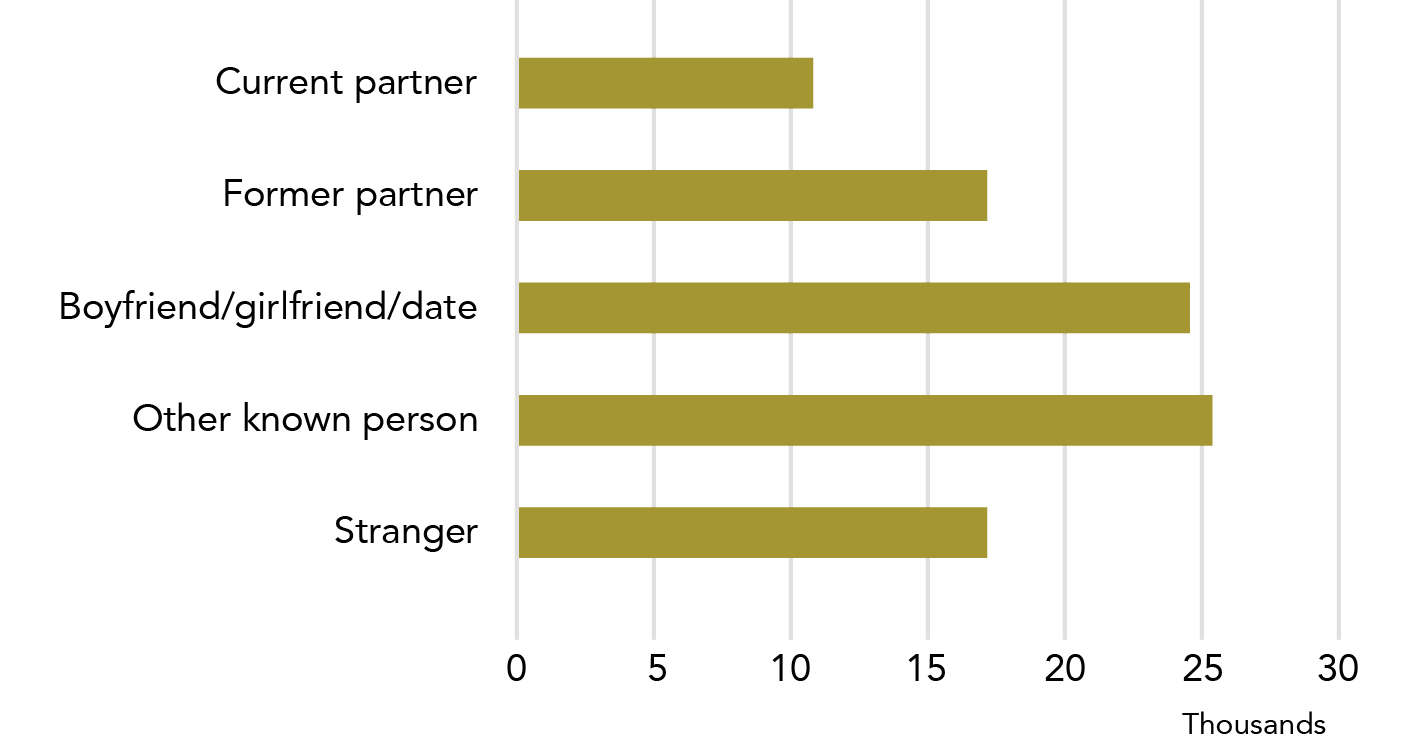
Data table for Graph M:
Relationship Number of sexual assaults Current partner ~11,000 Former partner ~17,000 Boyfriend/girlfriend/date ~24,500 Other known person ~25,500 Stranger ~17,000
3.2 In the 12 months prior to the survey
The information in this section:
- is useful for considering recent assaults and immediate service need;
- can be related to Section 2: 2. Victim demographics;
- relates to both male and female perpetrators (female perpetrators cannot be reported by themselves due to data quality concerns).
A similar pattern of perpetrator types was found in the “12 month” and “since the age of 15” data.
Intimate partner
Of the 87,800 women sexually assaulted in the last year, 75,500 (85%) were sexually assaulted by person known to them.
Tbl A2:H17
Two thirds of these women were assaulted by cohabiting partner, boyfriend, girlfriend or date (52,400).
H12
Of the women who were sexually assaulted by a male intimate partner:
- 20.4% (10,700*) were assaulted by a current partner;
- 32.6% (17,100*) were assaulted by a former partner; and
- 46.9% (24, 600*) were assaulted by a boyfriend, girlfriend or date.
H13, H14, H15
Stranger
The same number of women were sexually assaulted by a former cohabiting partner (17,100*) as by a stranger (17,300*).
Tbl A2: H10
Graph N: Women who had experienced sexual assault by a male, most recent incident: By relationship to perpetrator (proportion)
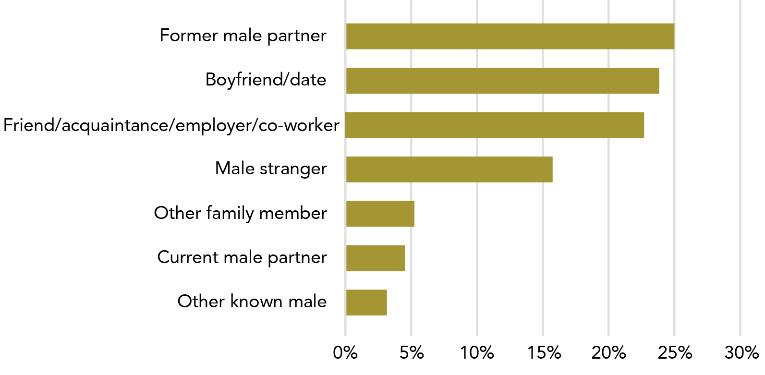
Data table for Graph N:
Relationship Percentage Former male partner 25% Boyfriend/date 24% Friend/acquaintance/employer/co-worker 23% Male stranger 16% Other family member 5% Current male partner 4.5% Other known male 3%
Note: As a person can only have one “most recent incident” this is the only data to add up to 100%. Data includes most recent incidents since the age of 15.
3.3 Most recent incident
The information in this section:
- Can be related to Section 2: 4. Incident characteristics and 5. Post-incident actions and impacts; and
- Relates to male perpetrators and cannot be provided as a gender aggregate as the data for male and female perpetrators is collected separately in the most recent incident module.
Most recent incident (MRI) data has particular limitations that means it should be used carefully. Please see the text box in Section 1: 1.3: Injury (Most recent incident data and the separation of male and female perpetrator) for more detail. MRI data is highlighted in orange to help the reader be aware of when this data is being used.
Sexual assault
For most women, their most recent sexual assault by a male was perpetrated by:
- a previous partner (212,300, 24.9%);
- a boyfriend or date (including an ex) (204,200, 23.9%); or
- a friend, acquaintance, employer or co-worker (192,700, 22.6%).
Tbl A4:G10, G12, G13
About one in 22 women who had been sexually assaulted were assaulted by their current partner in their most recent incident (4.5%, 38,000).
G9
Sexual threat
When considering a woman’s most recent sexual threat, the majority were perpetrated by:
- strangers (35.4%); or
- friends, acquaintances, employers or co-workers (29.1%)
Tbl A4: I8, I13
Why do things get (even more) wordy when we are talking about perpetrators?
The PSS is a victim survey, not a perpetrator survey. This means that it asks people about their experiences of victimisation: it does not ask about experiences of perpetration.
It is not valid to assume that patterns of perpetration mirror patterns of victimisation. For example, imagine that Judy was sexually assaulted by Paul. When asked about her most recent incident, Judy answers regarding this incident. However, since this incident, Paul has assaulted two other women. If he was to answer questions about his most recent perpetration, he would not answer about the incident with Judy.
The data presented here represent victims’ perceptions of incidents.

4 Incident characteristics: What happened in a sexual assault incident?
Almost all of the detailed data on sexual assault comes from the most recent incident (MRI) data module. This data has specific limitations that make it difficult to report in some contexts.
MRI data is collected when the ABS asks a study respondent about their most recent incident of eight types of violence. Two of these types are sexual assault: by a male, and by a female.
MRI data has several limitations that are outlined in detail in Section 1: 3. Incident characteristics. These limitations are a consequence of the fact that MRI data only tells us what happened in the most recent incident.
MRI data is highlighted in orange to help the reader be aware that this information should be used with caution.
The statistics in Part 4 of this section, Incident characteristics, relate to a woman’s most recent incident of sexual assault by a male perpetrator.
4.1 Injury
A quarter of a million women reported being physically injured in their most recent sexual assault by a male. Scratches, bruises and cuts were the most common form of injury. Four out of ten women went to see a doctor due to their assault. Most women had changes in their routine due to their injury.
4.1.1 Nature of injury
Of women who had experienced sexual assault by a male perpetrator, one in three reported that they were physically injured in their most recent incident: this is over a quarter of a million women (284,000).
Tbl A10: F9
For women who were physically injured:
- 88.4% (251,000) experienced scratches, bruises or cuts;
- 11.1% (31,600) experienced fractures or broken bones/teeth; and
- 2.6%** (7,300*) were stabbed, shot or had another form of deep wound.
F14, F15, F16
8,800* women reported a miscarriage as an injury from their most recent sexual assault.
F17
More separations
When a person completes the PSS, they are asked a series of questions about their most recent incident of sexual assault. For the sake of the survey, sexual assault by a male and by a female are asked about separately.
This means that we cannot combine most male and female perpetrator sexual assault data.
More detail on the issue of “double counting” is provided in the text box in Section 3: 3.6 Violence and pregnancy: Why are former and current partner separated?
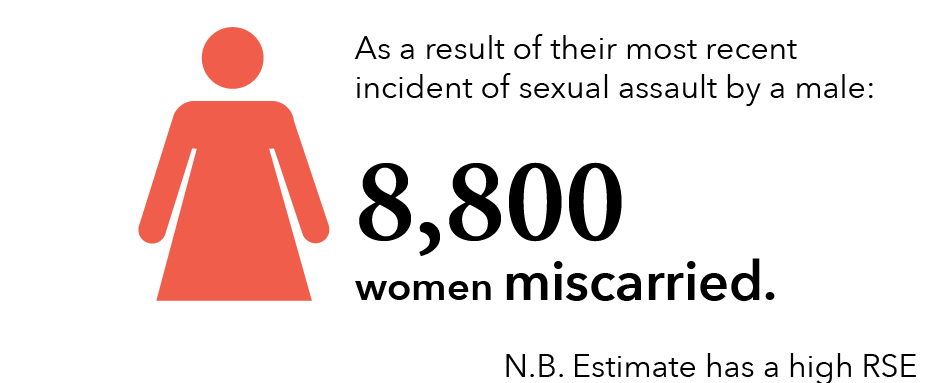
The changes to routine in this section relate to those that happen due to physical injuries. Many uninjured women will have also had changes in their usual routine, and these women’s experiences are not reflected in the information above.
See also: Section 1: 3.1 Injury.
4.1.2 Medical consultation
Four out of ten (105,700, 37.2%) women who were physically injured in their most recent sexual assault by a male consulted a doctor about their injuries.
Tbl A10: F22
In comparison, approximately three out of ten women consulted their doctor for their most recent physical assault (31.5% for physical assault by a male, 28.9% for physical assault by a female).
C22, E22
The PSS asks respondents whether they have seen a doctor about the injuries they sustained in an incident of violence. Some women may have also accessed medical services after a sexual assault for other reasons such as STI testing, pregnancy testing and/or contraception, meaning that the number of women who have seen a doctor after a sexual assault may be larger than what is reported in the PSS.
4.1.3 Impacts of injury
Most women who were injured in their most recent sexual assault by a male reported a change in their usual routine in the 12 months after the incident. These changes were as a result of their physical injury, with the three most common impacts being:
- changes in their sleeping habits (147,200, 51.8%);
- changes in social/leisure activities (131,000, 46.1%); and
- changes in building and maintaining relationships (120,100, 42.3%).
Tbl A10: G35, G27, G33
Graph O: Women who were physically injured in their most recent sexual assault by a male, since the age of 15: By type of injury experienced
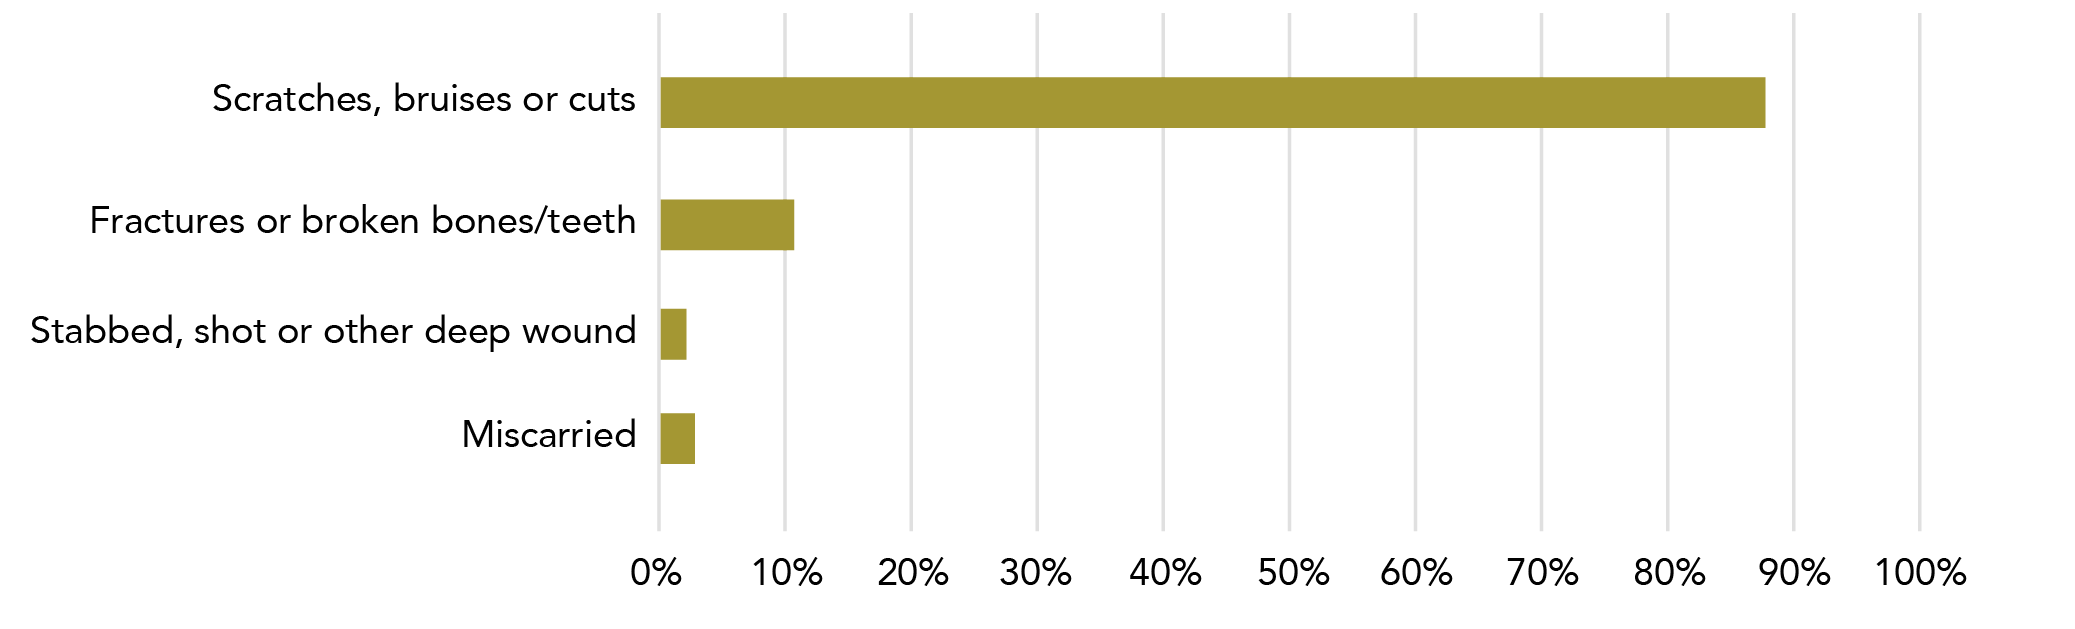
Data table for Graph O:
Type of injury Percentage Scratches, bruises or cuts 88% Fractures or broken bones/teeth 11% Stabbed, shot or other deep wound 2% Miscarried 3%
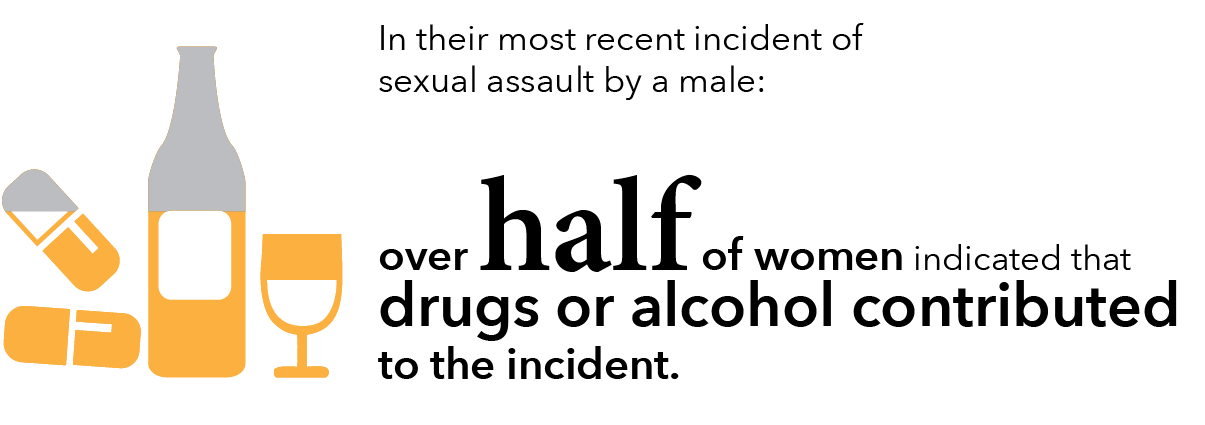
4.2 Alcohol and other drugs
Please see Section 1: 3.2 Alcohol and other drugs for a definition of “contributes to the incident.”
The use of alcohol and other drugs was a common feature of sexual assault incidents with just over half the women survey indicating that this was a contributing factor in their most recent sexual assault by a male. More women assessed that their perpetrator’s (rather than their own) drug and alcohol use contributed to their most recent sexual assault.
4.2.1 Consumption of alcohol and other drugs
Over half the women surveyed indicated that drugs or alcohol contributed to their most recent sexual assault by a male perpetrator (474,600, 55.7%).
Tbl 18: I24
One in five female victims of sexual assault reported that they were under the influence of drugs or alcohol (162,800, 19.1%). This is one in three women who had reported that drugs/alcohol contributed to their most recent sexual assault.
E24
Close to half the respondents reported contributing alcohol/drug use[6] by the perpetrator at the time of the assault (48.2%, 410,900). This represents nine out of ten incidents where the victim indicated that drugs/alcohol contributed to the incident.
G24
Of all incidents of sexual assault where women indicated that alcohol and other drugs contributed to the incident, it was mostly the perpetrator’s use that was assessed as being a contributing factor.
4.2.2 Consumption of alcohol and other drugs by perpetrator type
What’s the deal with the Venn diagrams?
Venn diagrams are used in a number of places in this report to help emphasise where populations do (and do not) overlap. In the section above, they represent how some incidents of violence may involve both victim and perpetrator being under the influence of drugs and/or alcohol – these instances are counted in both perpetrator and victim populations, but are only counted once for the total.
Venn diagrams are intended as a visual reminder of the complexity of the data.
Reminder!
The category of cohabiting partner includes both former and current partners who have lived with the survey respondent in a marriage or de facto relationship.
Two out of three sexual assaults by a stranger were assessed by the victim to have contributing alcohol/drug use (87,400, 65.1%).
Tbl A5:K24
One in two incidents involving known persons, including cohabiting partners, were assessed by the victim to have had contributing alcohol/drug use (387,100, 53.9%).
K25
Of all most recent incidents of sexual assaults by a male perpetrator that involved a contributing use of drug/alcohol (474,600):
- 18.4% were perpetrated by a stranger (87,400);
- 29.4% were perpetrated by a cohabiting partner (139,500); and
- 52.2% were perpetrated by a known person (excluding cohabiting partners, but including boyfriends and male dates) (247,600).
J28, J24, J26, J27
For information about:
The role of alcohol and other drugs in partner violence, see Section 3: 3.4 Alcohol and other drugs.
Perpetrator characteristics for sexual assault, see Section 2: 3.3 Most recent incident.
4.3 Location of incident
Three quarters of women reported that their most recent sexual assault by a male occurred in a private residence, of which, close to 70% were perpetrated by a cohabiting partner or boyfriend/date .
Private residence
The following statistics relate to a woman’s most recent incident of sexual assault by a male perpetrator.
Three out of four sexual assaults occurred in a private residence (627,600, 73.6%), of which:
- 44.7% (381,600) occurred in the victim’s home;
- 14% (119,800) occurred in the perpetrator’s home; and
- 14.8% (126,100) occurred in another person’s home.
Tbl 19: C28, C29, C30
Almost all (93%) sexual assaults perpetrated by a male that occurred in the home were committed by a man known to the victim. Of these most recent sexual assaults by a known person:
- Four out of ten (243,500, 41.7%) were perpetrated by a cohabiting partner.
- Three out of ten (167,200, 28.7%) were perpetrated by boyfriend or date.
Three out of ten (172,600, 29.6%) were perpetrated by an other known male such father, son, brother, teacher, friend etc.
Table A5: Additional analysis, B24-B28
One in 14 (7%) sexual assaults perpetrated by a male in a private residence were perpetrated by a stranger.
Less than 10% of assaults occurred:
- outside (e.g., laneway, carpark, park) (62,400, 7.3%);
- while using or waiting for public transport (5000*, 0.6%)[7];
- in the respondent’s workplace (19,500, 2.3%); or
- in a place of entertainment (52,600, 6.2%).
Tbl 19:C33, C31, C32
Whose home is it?
When a victim and perpetrator live in the same house, the house is categorised as the victim’s home. This means that a house that is categorised as a perpetrator’s house is not the residence of the victim, but a victim’s house may or may not be the perpetrator’s home.
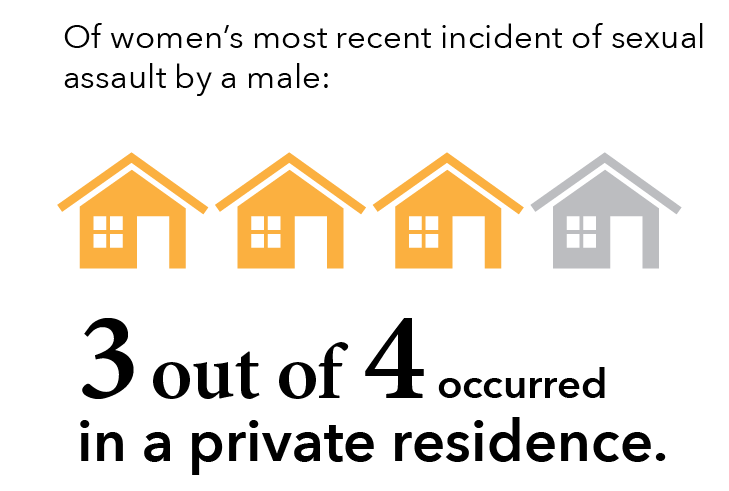
Place of entertainment

Of the 52,600 women who reported their most recent sexual assault was perpetrated by a man in a place of entertainment, a statistically equivalent number of assaults were committed by strangers as known men (including cohabiting partners) (28,000*, 24,600).
Tbl A5: D28, D24, D25
Outside and while using or waiting for public transport
More women experienced their most recent sexual assault while outside or using or waiting for public transport than while in a place of entertainment.
Of the 67,400 women who experienced their most recent sexual assault while outside or waiting for public transport:
- 53.7% were perpetrated by a male stranger (36,200); and
- 46.4% were perpetrated by a known male (31,300).
Tbl A5: F28, F24, F25
For more information about location of partner violence, see Section 3: 3.5 Location of incident.
Graph P: Proportion of women victims, location of most recent incident of sexual assault by a male
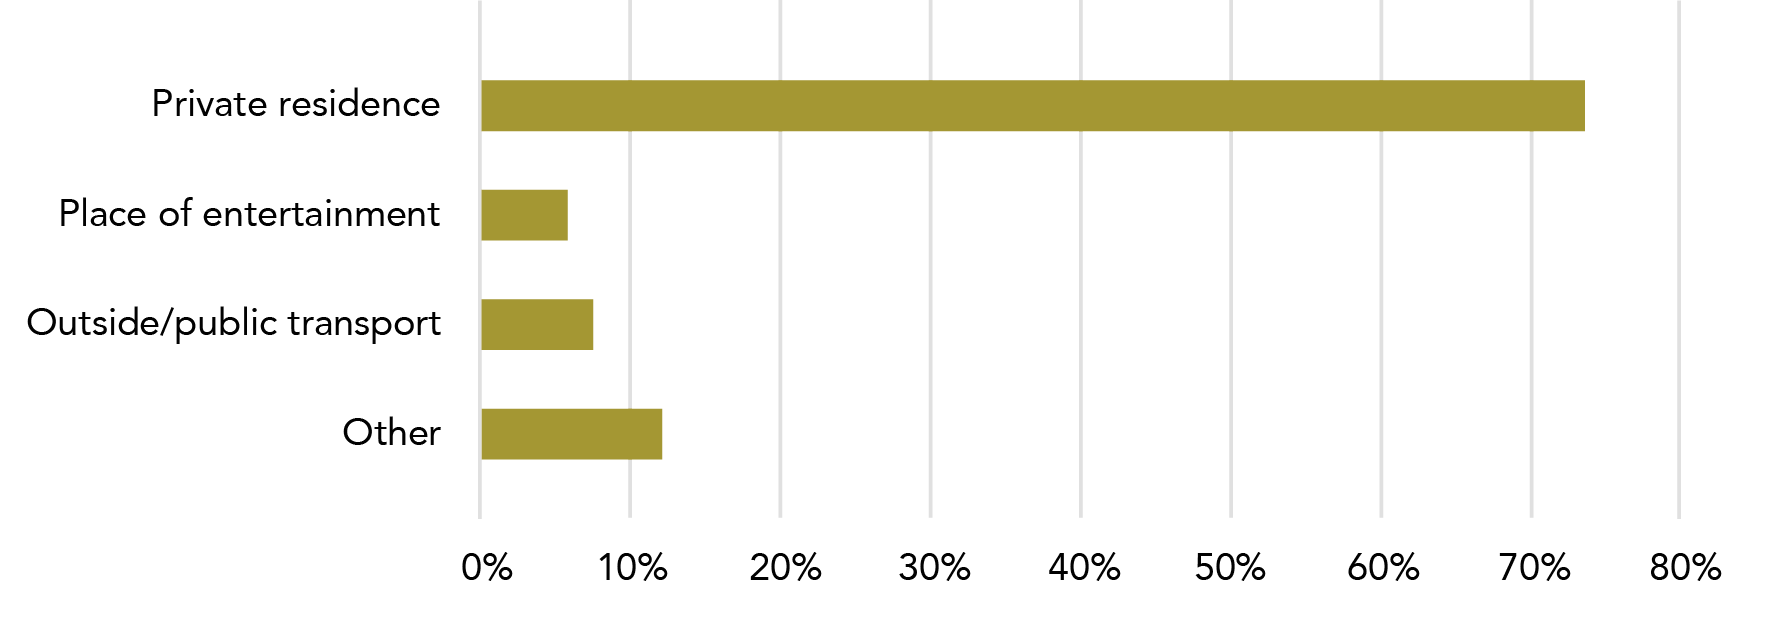
Data table for Graph P:
Location Percentage Private residence ~74% Place of entertainment ~6% Outside/public transport ~7.5% Other ~12%
Note: Data relates to incidents since the age of 15.
In relation to their most recent sexual assault by a male, most women reported that the incident occurred in a private residence, by a man known to them. A slight majority of victims said that the use of drugs and/or alcohol was a contributing factor in their assault. Most women were not physically injured during the assault.
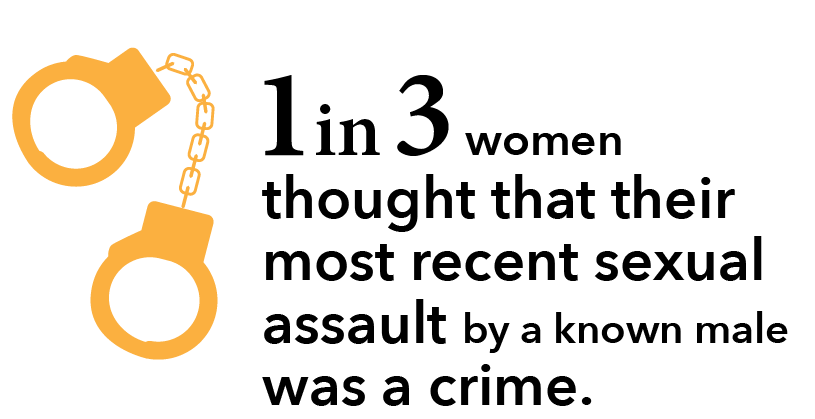
5 Post-incident actions and impacts: What happens after a sexual assault?
5.1 Police and court contact
One fifth of women reported their most recent sexual assault by male to police, and just over one in 20 women indicated that the perpetrator had ended up in court. Although women were more likely to perceive an assault by a stranger as a crime, this did not result in a marked increase in prosecution for this perpetrator type.
5.1.1 Police contact – comparison to other assault types
Most recent sexual assault
One in five women reported their most recent sexual assault by a male to the police (162,800, 19.1%).
Tbl 17: B29, B31, B32
In contrast:
- one in three women contacted police about their most recent physical assault by a male (562,600, 32.8%); and
- one in three women contacted police about their most recent physical assault by a female (141,400, 31.6%).
In the 12 months prior to the survey
Of women who had experienced sexual assault by a male in the year prior to the survey, one in six reported their most recent incident to the police (16.9%*, 14,800*): five out of six (83.1%), or an estimated 72,800, women did not report their most recent incident of sexual assault by a male to the police.
Tbl 17: C16, E16
A smaller percentage reported to the police their most recent incident of sexual assault (16.9%, 14,800), than reported:
- a physical assault by a male (28.3%, 61,000); or
- a physical assault by a female (41.3%, 25,300*).
C16, C18, C19
For information about police contact for all types of partner violence, see Section 3: 4.1 Police and court contact.
Graph Q: Proportion of women who contacted police about their most recent assault: By assault type
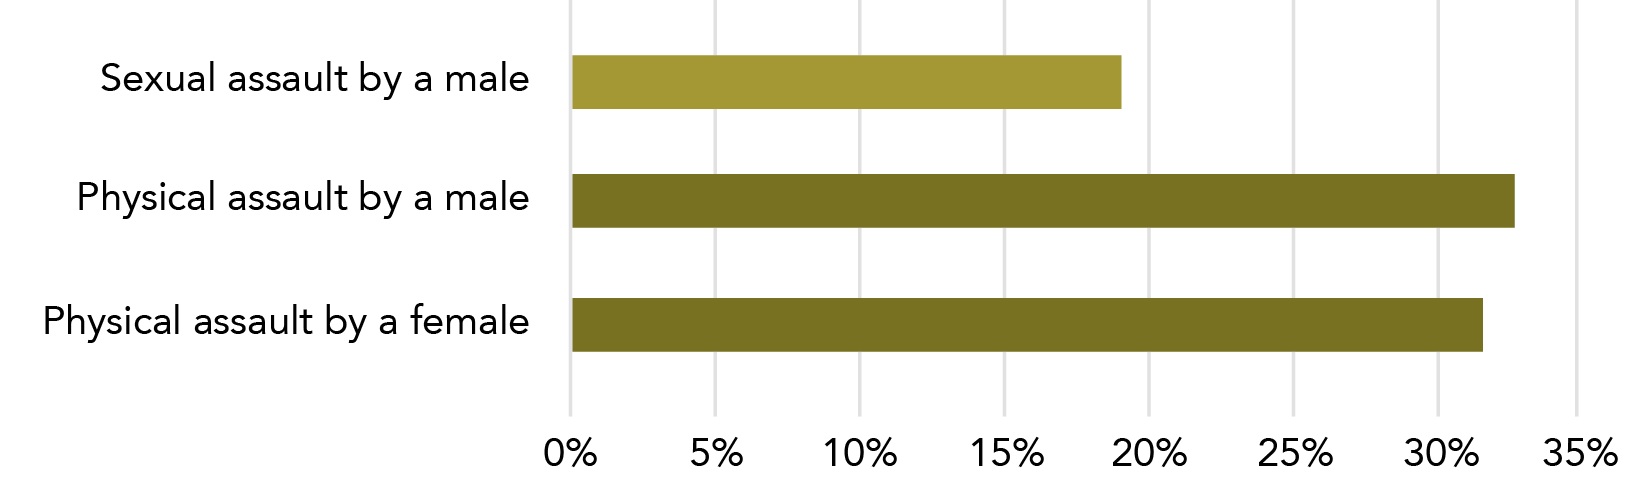
Data table for Graph Q:
Location Percentage Sexual assault by a male 19% Physical assault by a male 33% Physical assault by a female 31.5%
Note: Data relates to incidents since the age of 15.
Figure C: Most recent incident of sexual assault by a male: Police to court flowchart
Based on Tbl A14.
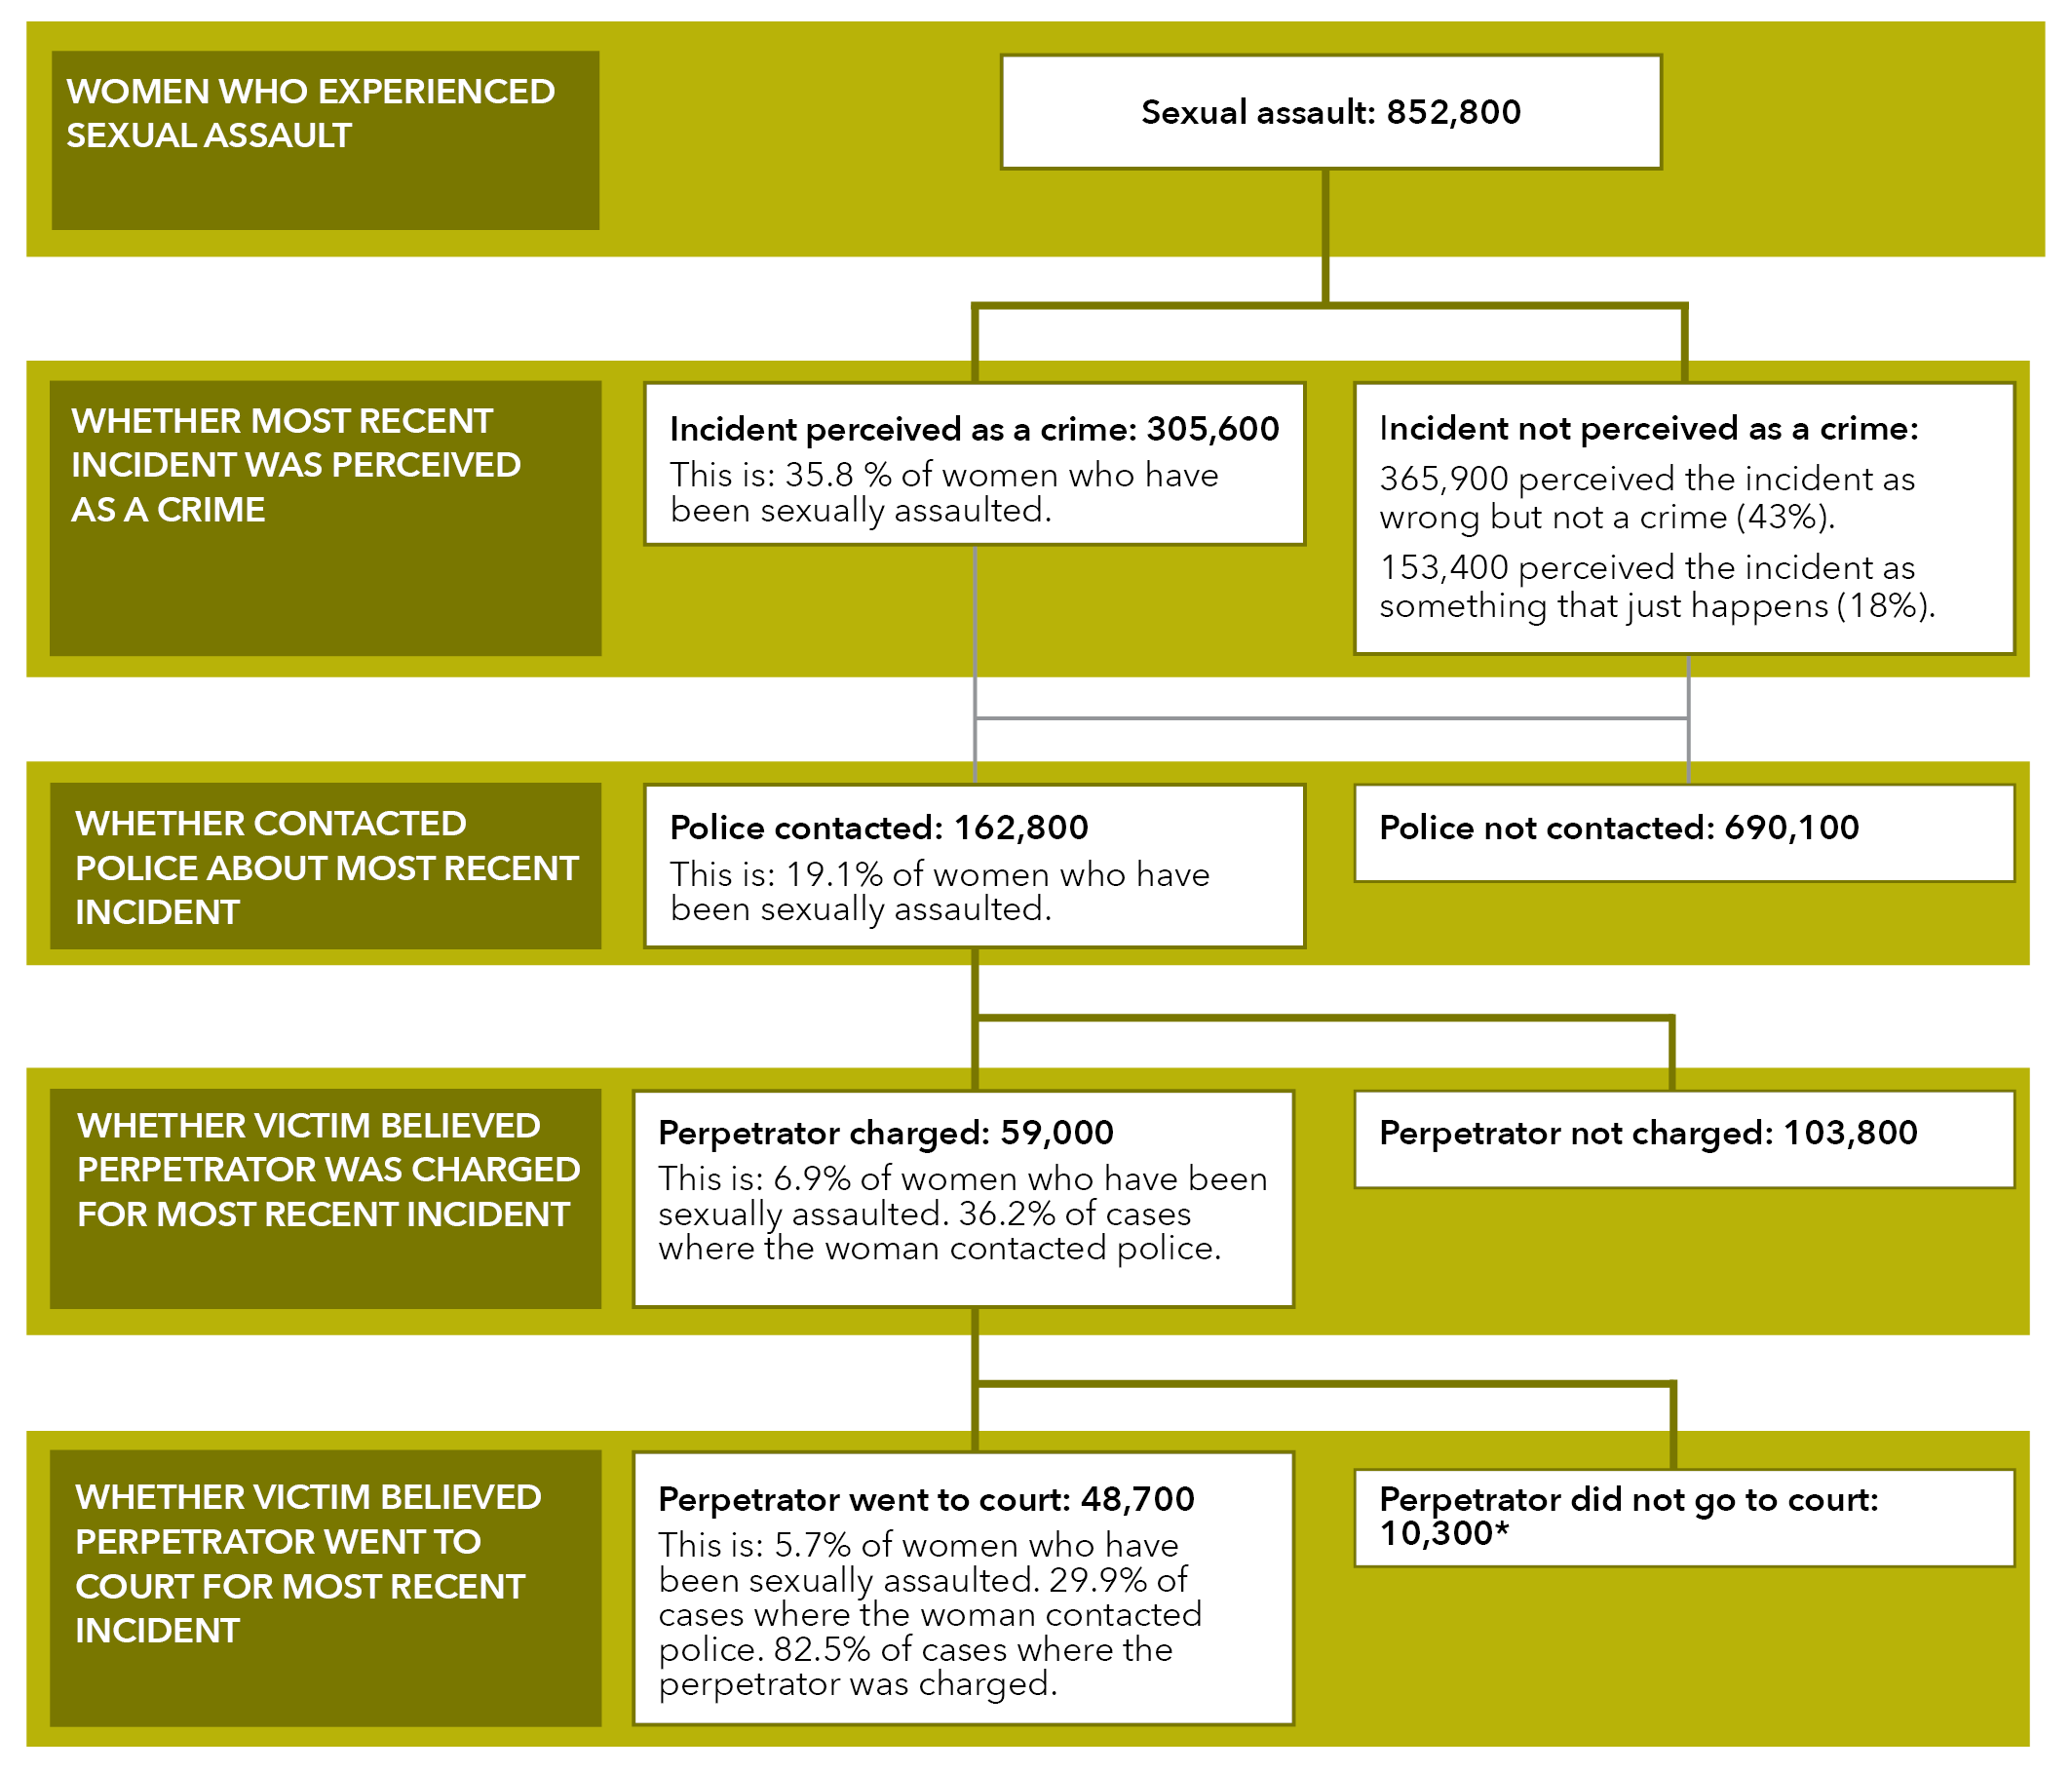
Text alternative:
Women who experienced sexual assault
Sexual assault: 852,800
Whether most recent incident was perceived as a crime
Incident perceived as a crime: 305,600
This is 35.8% of women who have been sexually assaulted.
Incident not perceived as a crime:
365,900 perceived the incident as wrong but not a crime (43%).
153,400 perceived the incident as something that just happens (18%).
Whether contacted police about most recent incident
Police contacted: 162,800
This is: 19.1% of women who have been sexually assaulted.
Police not contacted: 690,100
Whether victim believed perpetrator was charged for most recent incident.
Perpetrator charged: 59,000
This is: 6.9% of women who have been sexually assaulted. 36.2% of cases where the woman contacted police.
Perpetrator not charged: 103,800
Whether victim believed perpetrator went to court for most recent incident.
Perpetrator went to court: 48,700
This is: 5.7% of women who have been sexually assaulted. 29.9% of cases where the woman contacted police. 82.5% of cases where the perpetrator was charged.
Perpetrator did not go to court: 10,300*
Note: A small number of women who did not perceive the assault as a crime contacted the police
5.1.2 Contact with police by victim demographics
There was no statistically significant difference in the rates of police contact for:
- Women who were employed (10,100*, 21%*) and women who were unemployed or not in the labour force (4,600**, 11.8%**).
- Women who had a post-school qualification (8,200**, 18.1%*) and those who did not (15.5%*, 6,500*).
- Women who had a disability or long-term health condition (7,200*, 16.9%*), and those who did not (7,500*, 16.8%*).
Tbl A16: C9, C10, C14, C13, C21, C22
See also: Section 2: 2. Victim demographics, for relevant sub-population data.
Graph R: Women’s most recent sexual assault by a male perpetrator, whether incident perceived as crime at the time and police involvement
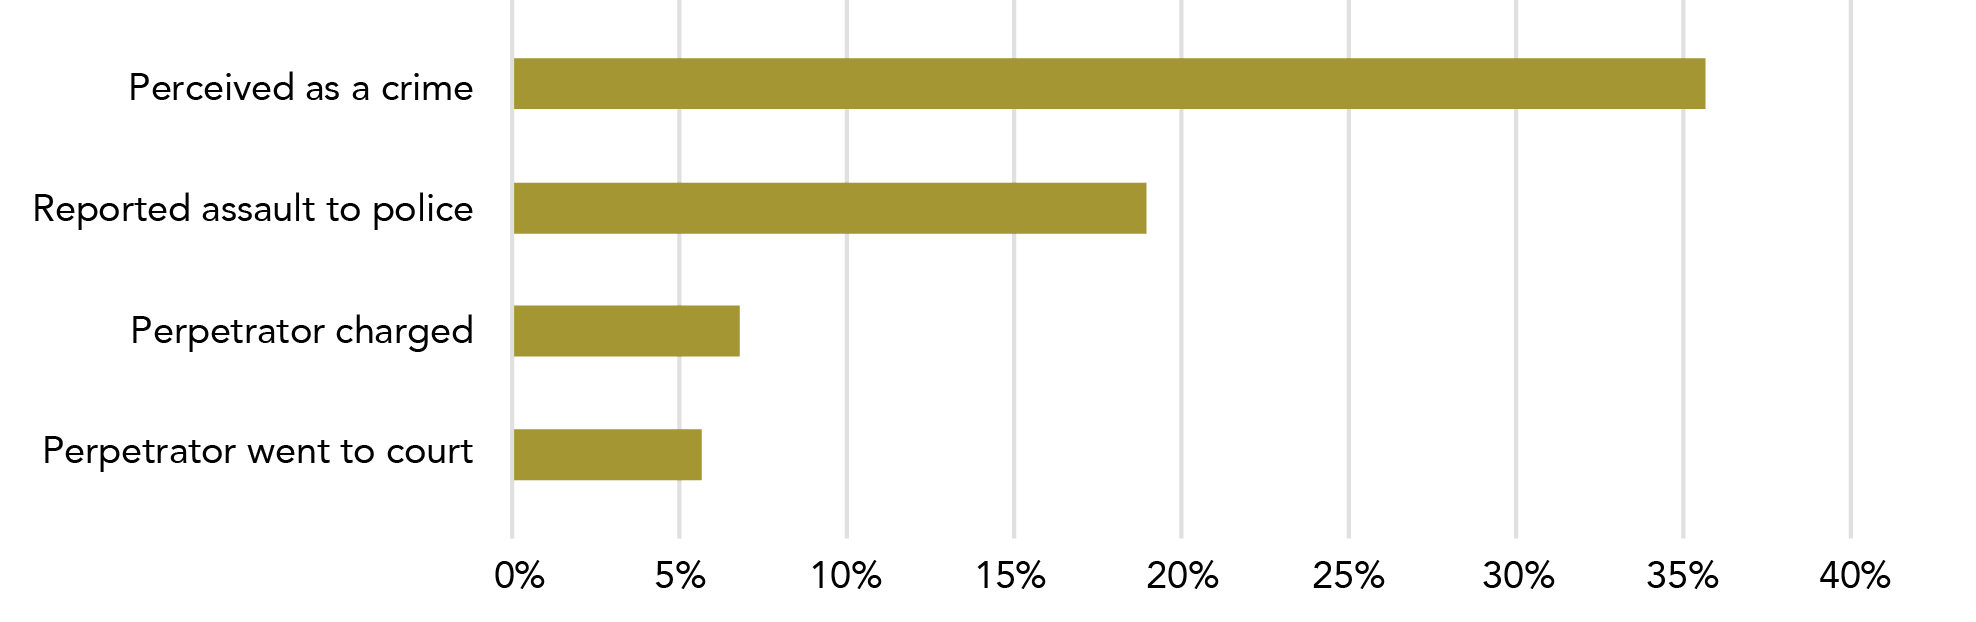
Data table for Graph R:
Location Percentage Perceived as a crime 36% Reported assault to police 19% Perpetrator charged 7% Perpetrator went to court 6%
Note: Information on perpetrator’s involvement in the justice system from victim’s reports in PSS only.
5.1.3 Contact with police by perpetrator type
The following information outlines stages of engagement with the justice system by perpetrator type and relates only to a woman’s most recent sexual assault by a male:
Perceived as crime
 Women were twice as likely to perceive their most recent sexual assault by a male as a crime if the perpetrator was a stranger (61,400, 60.6%), as compared to:
- a male cohabiting partner (83,400, 33.3%); or
- an other known male (140,800, 30.1%).
Tbl A14: C10, E10, G10
Reported assault to police
One in seven (14%, 65,500) women whose most recent sexual assault was by a known male (other than their cohabiting partner) reported their assault to police.
G17
In comparison:
- one in three (46,900, 34.9%) women sexually assaulted by a stranger contacted the police; and
- one in five (50,400, 20.1%) women sexually assaulted by a cohabiting partner contacted the police.
C17, E17
Perpetrator charged
Of women who contacted police about their most recent sexual assault by a male:
- four out of ten reported that the perpetrator was charged if the assault was perpetrated by:
- a cohabiting partner (20,900*, 41.5%); or
- an other known male (26,100*, 39.9%*).
- one in four (11,900*, 25.5%*) who were sexually assaulted by a stranger reported that the perpetrator was charged.
E46, G46, C46
Perpetrator went to court
Of women who reported that the male perpetrator of their most recent sexual assault was charged:
- 99.9% reported that the perpetrator went to court if the assault was by a stranger;
- 72.4% reported that the perpetrator went to court if the assault was by a “cohabiting partner”; and
- 82.8% reported that the perpetrator went to court if the assault was by an other known male.
C51, E51, G51
For information on perpetrator demographics for sexual assault, see Section 2: 3.3 Most recent incident.
Reminder!
The category of cohabiting partner includes both former and current partners who have lived with the survey respondent in a marriage or de facto relationship.
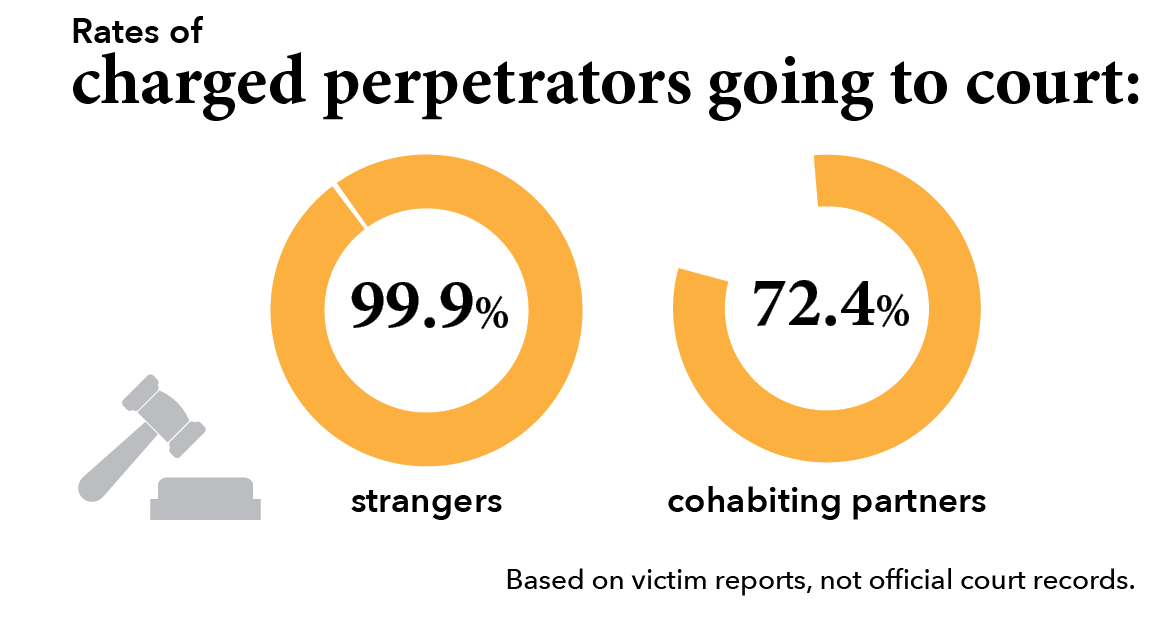
The table below outlines women’s engagement with the justice system based on the perpetrator type for a woman’s most recent incident of sexual assault by a male.
Figure D: Police involvement after most recent incident of sexual assault by a male: By relationship to perpetrator
Based on Tbl A14
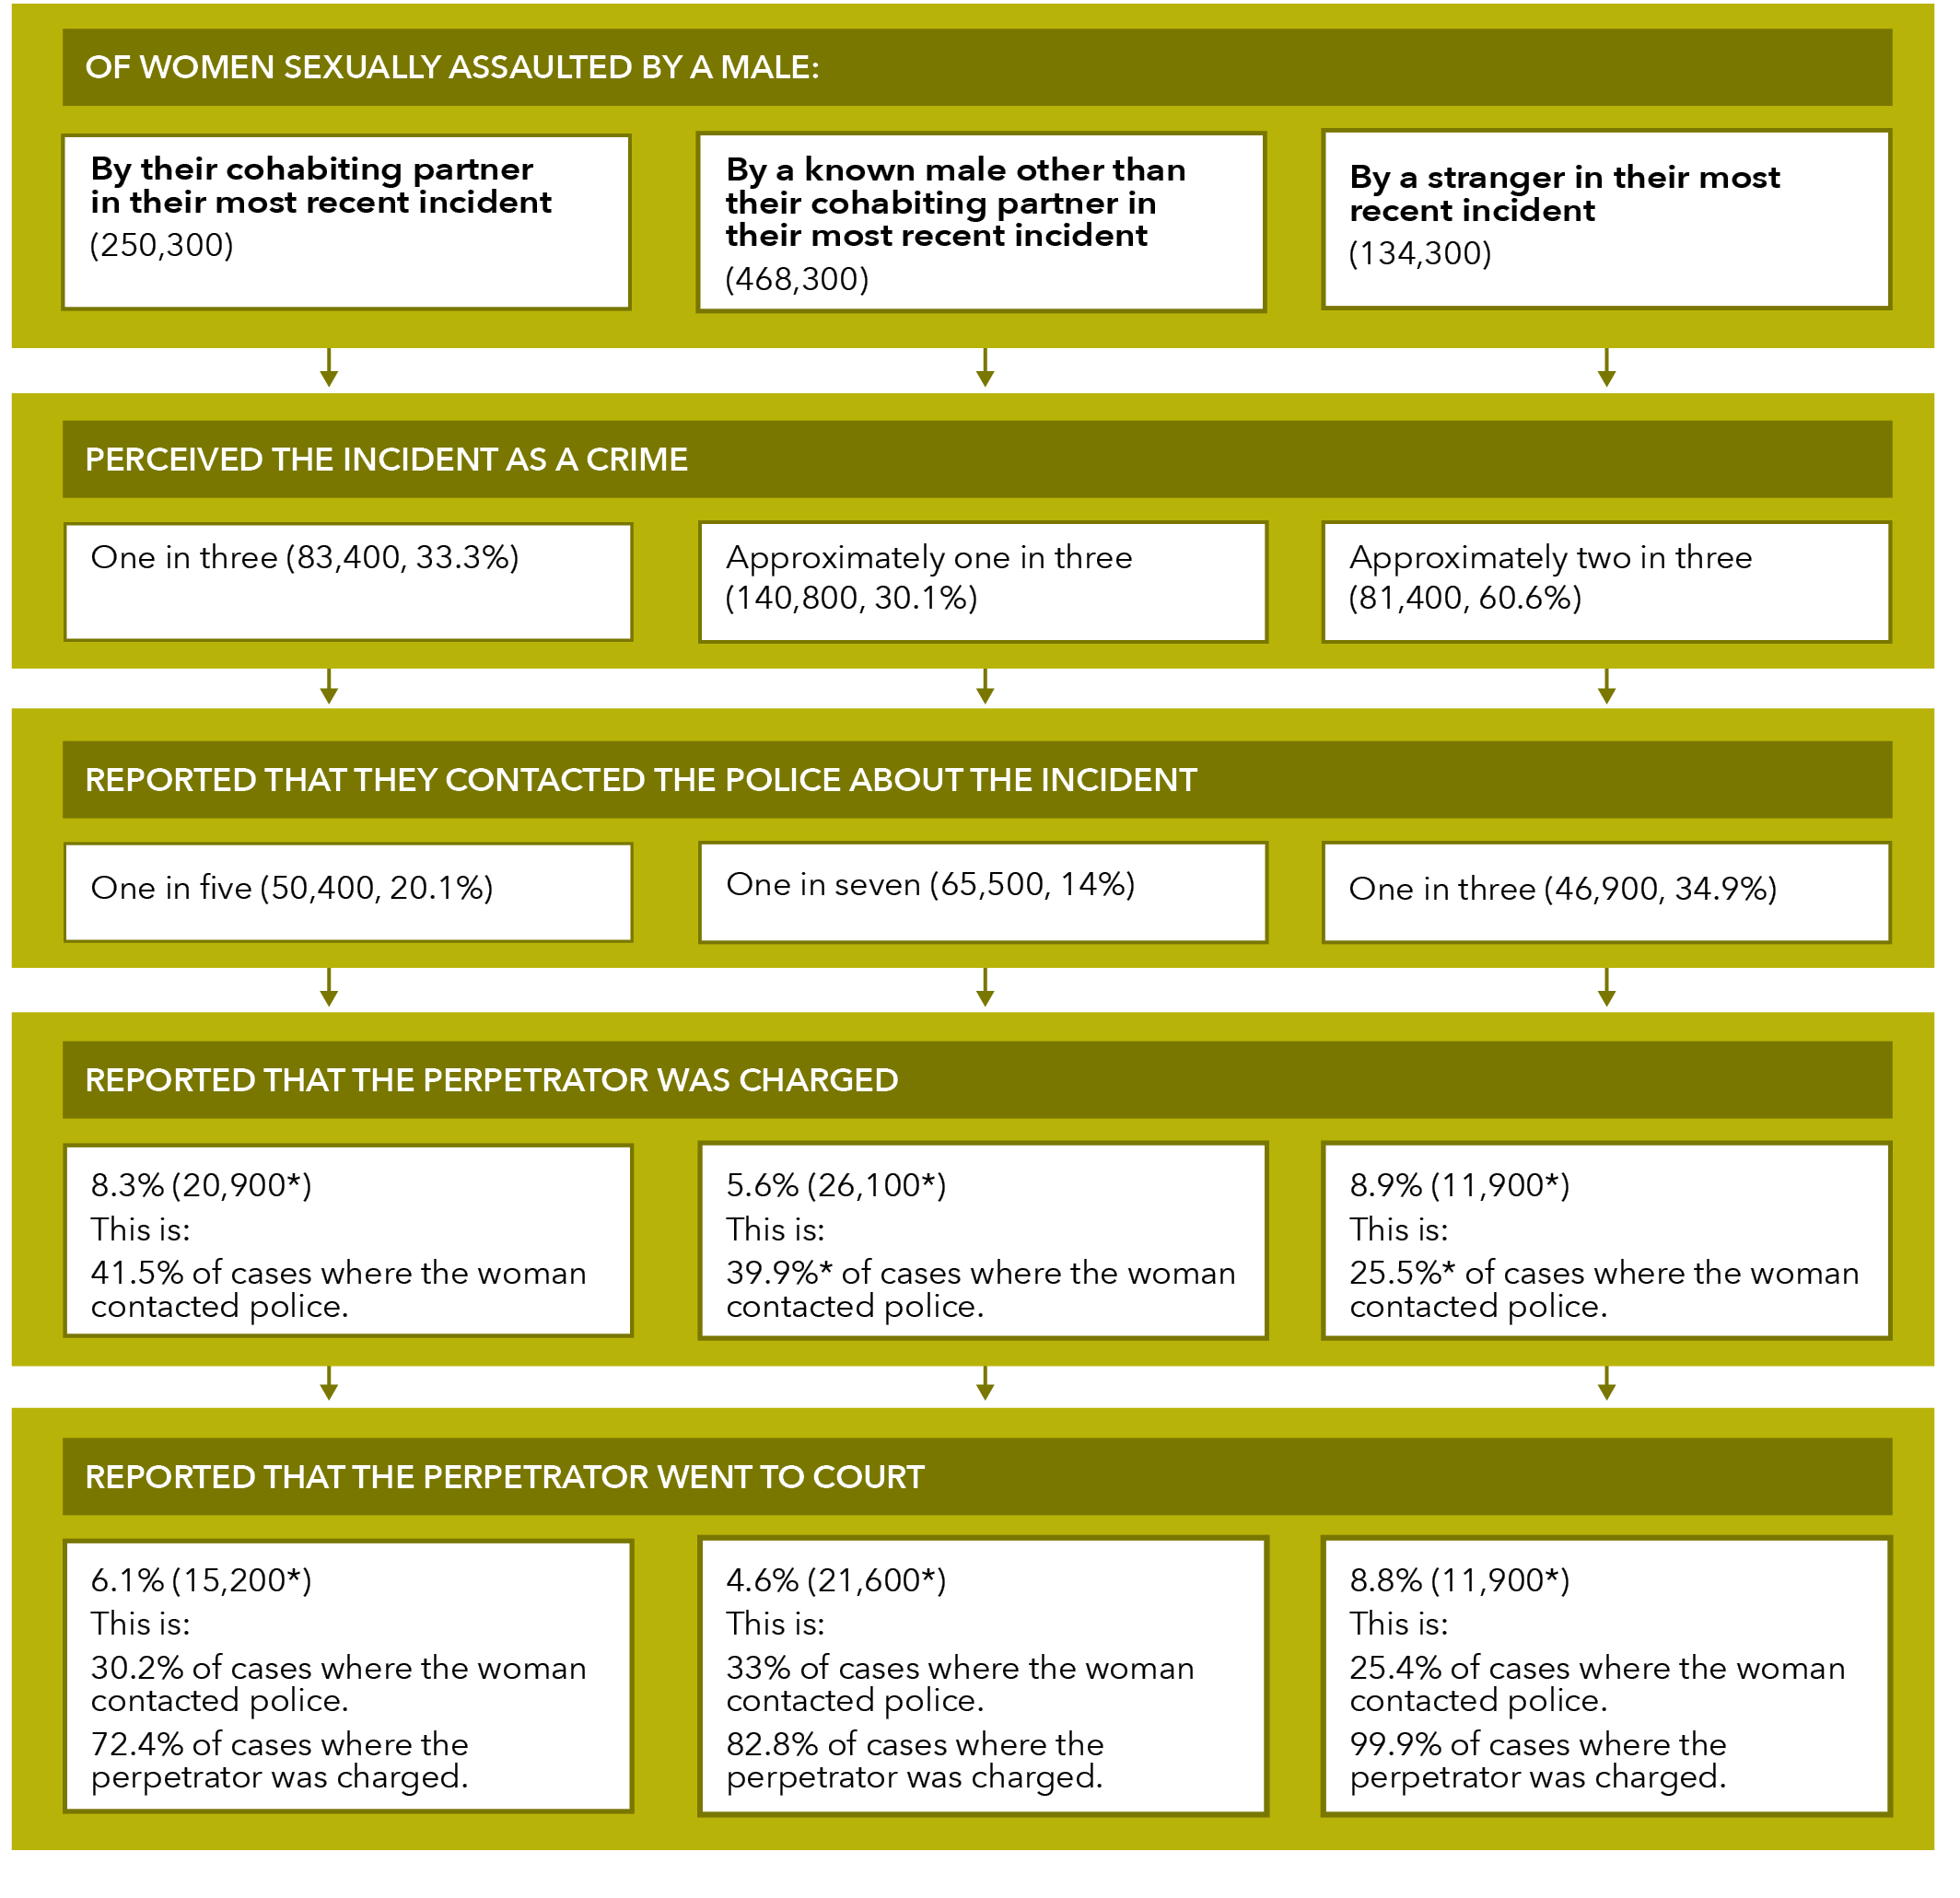
Data table for Figure D:
Action By their cohabiting partner in their most recent incident (250,300) By a known male other than their cohabiting partner in their most recent incident (468,300) By a stranger in their most recent incident (134,300) Perceived the incident as a crime One in three (83,400, 33.3%) Approximately one in three (140,800, 30.1%) Approximately two in three (81,400, 60.6%) Reported that they contacted the police about the incident One in five (50,400, 20.1%) One in seven (65,500, 14%) One in three (46,900, 34.9%) Reported that the perpetrator was charged 8.3% (20,900*)
This is:
41.5% of cases where the woman contacted police. 5.6% (26,100*)
This is:
39.9%* of cases where the woman contacted police. 8.9% (11,900*)
This is:
25.5%* of cases where the woman contacted police. Reported that the perpetrator went to court 6.1% (15,200*)
This is:
30.2% of cases where the woman contacted police.
72.4% of cases where the perpetrator was charged. 4.6% (21,600*)
This is:
33% of cases where the woman contacted police.
82.8% of cases where the perpetrator was charged. 8.8% (11,900*)
This is:
25.4% of cases where the woman contacted police.
99.9% of cases where the perpetrator was charged.
Note: A small number of women who did not perceive the assault as a crime contacted the police
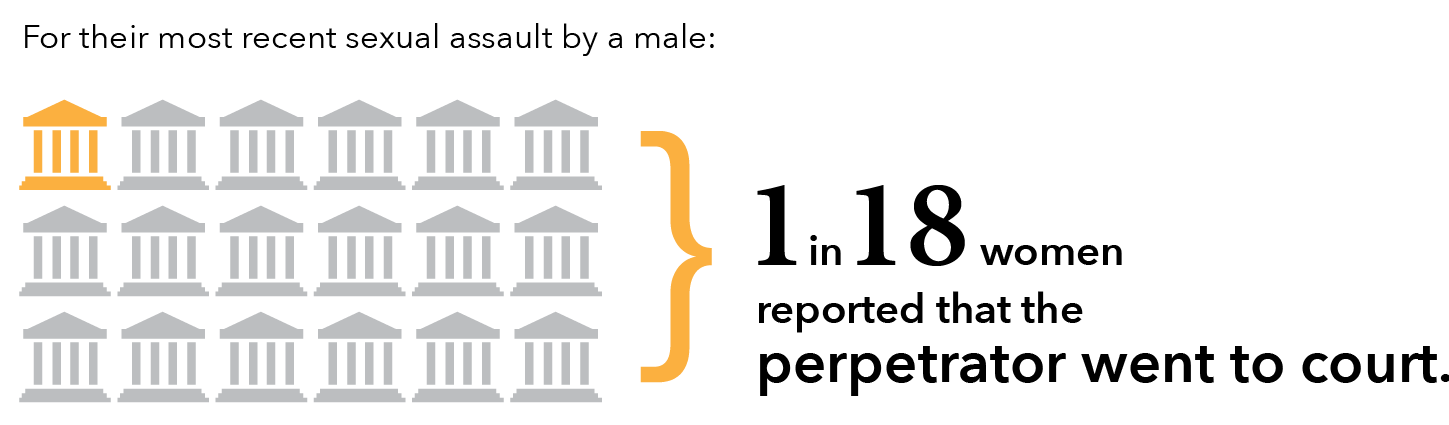
5.1.4 Reasons for not contacting the police by perpetrator type
Common reasons for not contacting the police
Women reported a range of reasons for not reporting their most recent sexual assault by a male to police.
Tble A14:
Approximately half of women reported a main reason that was either “did not regard it as a serious offence or a crime” or “did not want to ask for help/felt they could deal with it by themselves”. This trend was present regardless of the perpetrator type.
Additional analysis
Three out of ten women whose most recent sexual assault was by a cohabiting partner said that the main reason they did not report the incident was because of fear of the person responsible (55,900, 28%). This is between five and eight times the percentage of women who said that this was their main reason when the assault was perpetrated by:
- a stranger (3,100**, 3.6%**); or
- an other known male (21,100, 5.2%).
E38, C38, G38
One in five women whose most recent sexual assault was by a stranger indicated that the main reason that they did not report the incident to police was that they did not “trust the police/think they would believe me/think there was anything they could or would do” (17,500, 20%). This is about double the percentage of women who said that this was their main reason when the assault was perpetrated by:
- a cohabiting partner (17,000, 8.5%); or
- an other known male (44,200, 11%).
C37, E37, G37
Uncommon reasons for not contacting the police
In only 3.8% (26,400) of cases did the woman indicate that the main reason for not reporting her most recent sexual assault was that she did not want the person responsible arrested. Further disaggregation by perpetrator type was not possible, with perpetrator type data for this reason only available for cohabiting partner (11,400*, 5.7%*).
I35, E35
1.6% of women said that the main reason they did not report their sexual assault was cultural or language reasons (11,100).
I40
For information on perpetrator demographics for sexual assault, see Section 2: 3.3 Most recent incident.
The table below outlines the main reasons women did not contact police by perpetrator type for a woman’s most recent sexual assault by a male. When answering this question in the survey, participants could only nominate one main reason.
Table I: Police involvement after a woman’s most recent incident of sexual assault by a male perpetrator, select main reason for not contacting police: By relationship to perpetrator
5.2 Advice and support
One in six women have not told anyone about their most recent sexual assault by a male. Of those women that have told someone, women were most likely to first disclose their assault to a “friend, family member, work colleague or minister of religion”. Women were also most likely to get advice and support from this group, with “counsellor, support work or telephone hotline” and “GP or health professional” also common sources of advice and support.
Please see Section 3: 4.2 Advice and support, for detail on help seeking for women who experience partner physical assault.
Telling someone is different to getting advice or support
According to the PSS, to tell someone about an incident only requires that you inform them about the incident: it does not require that the person give you any advice or support.
If you said to someone “John wanted to have sex and wouldn’t take no for an answer” – this would be telling them about the incident.
You would be getting advice or support if you said to someone “John made me have sex when I didn’t want to: could you help me work out what to do about it?”.
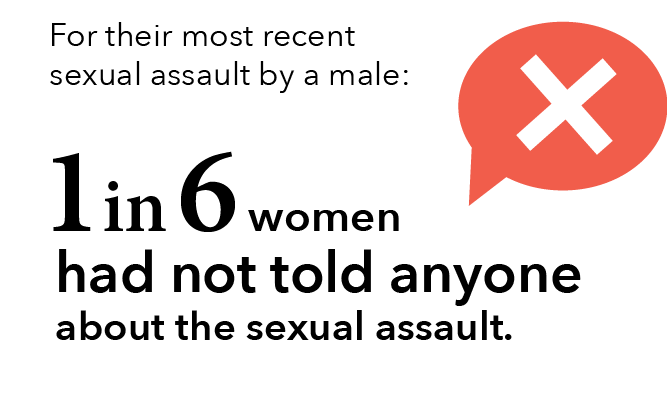
5.2.1 Disclosure
One in six women had not told anyone about their most recent sexual assault by a male (134,100, 15.7%): most of these women were sexually assaulted by their cohabiting partner (76,600).
Tbl A9: H77, F77
Of the 718,700 women who had told someone about their most recent sexual assault by a male:
- three quarters spoke first to a friend, family member, work colleague or minister of religion (531,600, 74%);
- one in 12 spoke first to their GP or other health professional (59,800, 8.3%); and
- one in 15 spoke first to the police (49,200, 6.8%).
H75, H72, H74
5.2.2 First person told by perpetrator type
Regardless of who assaulted them, women were most likely to first tell a friend, family member, work colleague or a minister of religion.
The table below outlines the most common first person told by perpetrator type for a woman’s most recent sexual assault by a male. This table tells us who women are most likely to tell first about their sexual assault.
Table J: Women’s most recent incident of sexual assault by a male perpetrator, first person told: By relationship to perpetrator
Person told Of women physically assaulted by their cohabiting partner: Of women physically assaulted by their cohabiting partner: Of women physically assaulted by their cohabiting partner: Most common first person told Friend/family member/work colleague/minister of religion. (117,200, 46.8%) Friend/family member/work colleague/minister of religion. (317,100, 67.7%) Friend/family member/work colleague/minister of religion. (97,200, 72.4%) Second most common first person told Counsellor, support worker or telephone hotline. (26,000, 10.4%) GP or health professional. (31,100, 6.6%) Police. (11,200*, 8.4%*) Third most common first person told Police. (25,000*, 10%*) “Other” person/service such as refuge/shelter/government housing, community services or legal/financial service. (18,300**, 3.9%**) GP or health professional. (8,500*, 6.3%*) Never told anyone 18.7% (46,800) 16.4% (76,600) 8%* (10,700*) Grid reference Table A9: column D Table A9: column F Table A9: column B
Note: Women can only “first tell” a single person, meaning that they can only select one answer for this question and the total will equal 100%.
5.2.3 Sought advice or support
Three out of five women sought support or advice for their most recent sexual assault by a male (505,400, 59.3%).
Tbl 16: C23
Of the half a million women who sought advice or support for their most recent sexual assault by a male, some of whom received support from more than one source:
- three quarters sought advice or support from a friend, family member, work colleague or minister of religion (375,000);
- a third sought advice or support from a counsellor, support worker or telephone hotline (185,600); and
- a third sought advice or support from a GP or other health professional (183,800).
Tbl A9: H59, H68, H64, H63
“First told” is different to “sought advice”
Although similar, the data for “first told” and “sought advice” provides us with different insights:
- “Sought advice” data shows all the types of person that the victim sought advice from after their assault – this data gives a sense of the number of professionals (and lay people) who need to be comfortable dealing with a disclosure and providing support to a victim.
- “First told” data provides us with information about who women first told about their assaults – these people are likely to need specific skills, as the first disclosure may be more distressing than subsequent disclosures.
5.2.4 Advice seeking by victim demographics
 In regards to their most recent sexual assault by a male:
- three quarters of employed women sought advice or support (36,800, 76.3%); and
- half of the women who were unemployed or not in the labour force sought advice or support (19,400*, 49.4%).
Tbl A16: G9, G10
 There was no statistically significant difference in rates of advice seeking for:
- women who had post-school qualification (30,400*, 67.2%) and those who did not (25,800, 61.1%);
- women who were born in Australia (45,400, 67.3%) and those who were born overseas (10,800*, 53.8%*); and
- women who have a disability or long-term health condition (28,600*, 67%), and those who did not (27,700*, 61.8%).
G14, G13, G17, G18, G21, G22
See also: Section 2: 2. Victim demographics for relevant sub-population data.

5.2.5 Source of advice by perpetrator type
Regardless of who sexually assaulted them, women were most likely to seek advice and support for their most recent sexual assault from a friend, family member, work colleague or minister of religion.
The table below outlines the most common sources of support by perpetrator type for a woman’s most recent sexual assault by a male. Women may have sought support and advice from multiple sources.
Table K: Women’s most recent incident of sexual assault by a male perpetrator, sources of support and advice: By relationship to perpetrator
Source of advice Of women sexually assaulted by their cohabiting partner: Of women sexually assaulted by a known male other than their cohabiting partner: Of women sexually assaulted by a stranger: Most common source of advice Friend/family member/work colleague/minister of religion. (85,300, 34.1%) Friend/family member/work colleague/minister of religion. (227,600, 48.6% ) Friend/family member/work colleague/minister of religion. (62,200, 46.3%) Second most common source of advice Counsellor, support worker or telephone hotline. (73,200, 29.2%) GP or health professional. (86,000, 18.4%) GP or health professional. (34,700, 25.8%) Third most common source of advice GP or health professional. (63,200, 25.5% ) Counsellor, support worker or telephone hotline. (79,800, 17%) Police. (33,600*, 25%) Grid reference Table A9: column D Table A9: column F Table A9: column B
For information on perpetrator demographics for sexual assault, see Section 2: 3.3 Most recent incident.
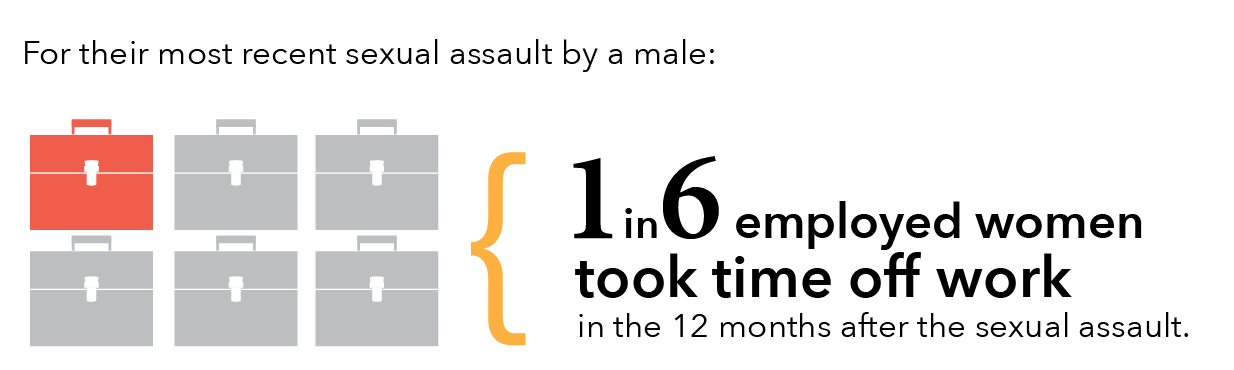
5.3 Time off work
93,200 women reported that they took time off work after in the 12 months after their most recent sexual assault by a male. This represents:
- 10.9% of all women who had experienced a sexual assault; and
- 17% of women who were working in the 12 months after the assault.
Tbl A6: H32, I32
The data below relates only to a woman’s most recent sexual assault by a male.
See also Section 3: 4.3 Time off work for detail on time off work for women who experience partner violence.
5.3.1 Time off work by perpetrator type
When considering women who were in the workforce during the year after their most recent assault:
- One in four women who were assaulted by a stranger took time off work (22.5%*).
- One in five women who were assaulted by a cohabiting partner took time off work (19.8%).
- One in seven women who were assaulted by a known person (excluding cohabiting partner) took time off work (14%).
Tbl A6: Additional analysis of data
See also Section 2: 3.3 Most recent incident for information on perpetrator demographics for sexual assault.
5.3.2 Time of work by victim demographics
One in six employed women took time off work in the year after their most recent sexual assault (17%).
In instances where the perpetrator was a stranger:
- one in six employed women born overseas took time off work (15.5%**); and
- one in four employed women born in Australia took time off work (24.2%*).
In incidents where the perpetrator was a cohabiting partner, employed women who were born in a non-main English speaking country were twice as likely to take time off work than employed women born in Australia (18% vs 37.8%**).
Tbl A7: Additional analysis of data
See also Section 2: 2.3 Country of birth for relevant victim demographic information.
5.3.3 Women not in the workforce
306,000 women who were sexually assaulted reported that they were unemployed or not in the workforce for the 12 months after their most recent assault. Of these women:
- 34.1% (104,500) were assaulted by a cohabiting partner;
- 53.3% (163,000)were assaulted by a known person other than a cohabiting partner; and
- 12.6% (38,600) were assaulted by a stranger.
Tbl A7: P36, L36, N36, J36
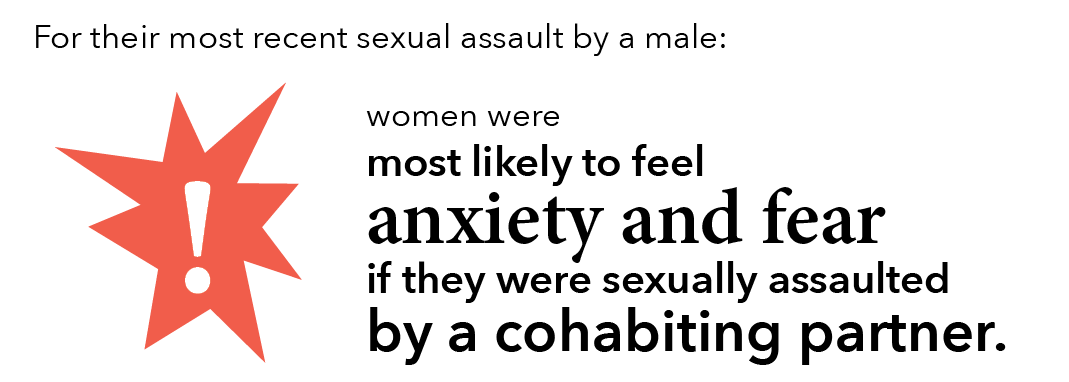
The category of cohabiting partner includes both former and current partners who have lived with the survey respondent in a marriage or de facto relationship.
5.4 Psychological impacts
Fear and anxiety are a common response to sexual assault. Women were equally likely to experience fear and anxiety in the year after the assault if their most recent incident was perpetrated by a cohabiting partner or a stranger. However, due to the higher absolute number of assaults by known males (including boyfriends/dates), a greater number of women reported feeling fear and anxiety after assaults by this type of perpetrator.
Six out of ten women had experienced fear or anxiety after their most recent incident of sexual assault by a male: this is over half a million women (517,600, 60.7%).
Table A13: H10
When reporting their most recent incident of sexual assault by a male:
- Three quarters of women who were sexually assaulted by a male cohabiting partner reported being anxious or afraid for their personal safety during the 12 months after the incident (185,100, 74%).
- Two thirds of women who were sexual assaulted by a male stranger reported being anxious or afraid for their personal safety during the 12 months after the incident (86,200, 64.2%).
- Half of women reporting sexual assault by a known male other than a cohabiting partner reported being anxious or afraid for their personal safety during the 12 months after the incident (246,300, 52.6%).
E10, C10, G10
 Women were more likely to feel anxiety and fear after their most recent incident of sexual assault by a male if the perpetrator was a cohabiting partner when compared to an assault by a known male (but not when compared to an assault by a male stranger).
See also Section 3: 4.4 Psychological impacts, for detail on fear and anxiety for women who have experienced partner violence.
Graph S: Proportion and number of women who experienced anxiety and fear after their most recent sexual assault by a male: By relationship to perpetrator
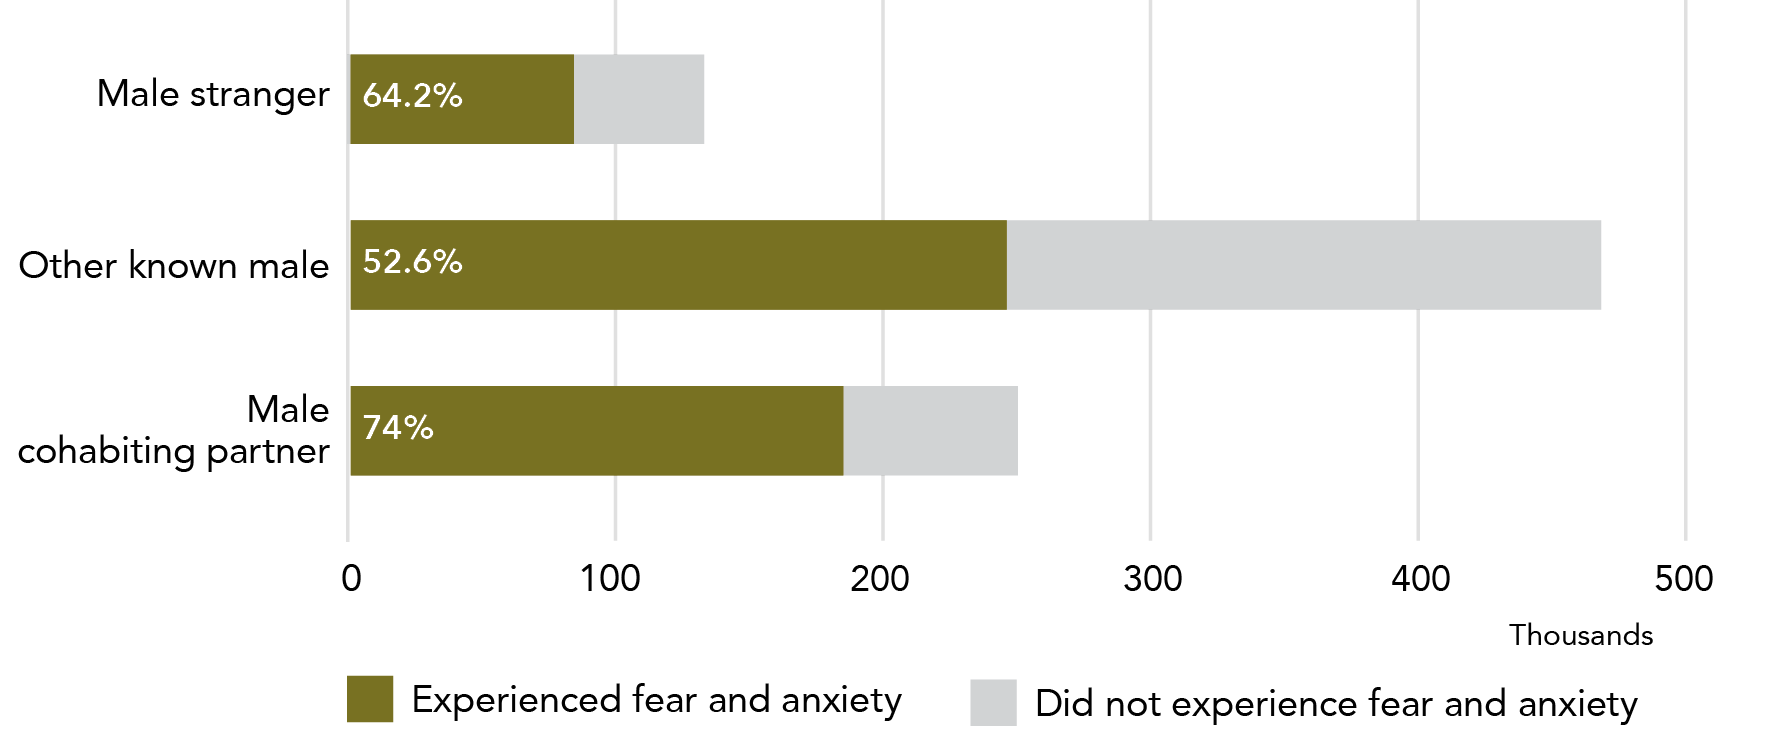
Data table for Graph S:
Relationship Experienced fear and anxiety Did not experience fear and anxiety Male stranger 64.2% (~85,000) 35.8% (~48,000) Other known male 52.6% (~247,000) 47.4% (~223,000) Male cohabiting partner 74% (~185,000) 26% (~65,000)
Note: Data relates to incidents since the age of 15.
This sub-section has outlined a range of post-incident impacts of sexual assault. A fifth of women reported their most recent sexual assault to the police, with approximately 5% indicating that the perpetrator went to court. Most women spoke to someone about their assault, although disclosure was not as common for women who were sexually assaulted by their cohabiting partner. Sexual assault frequently resulted in women experiencing anxiety and fear, with women who were either in a cohabiting relationship with the perpetrator or were victimised by a stranger more likely to feel anxiety.
Using a similar report structure, the following section examines women’s experiences of partner violence.
Section three: Women’s experiences of partner violence
Section three of this report provides a detailed examination of the PSS data relating to women’s experiences of partner violence. One in six women reported violence by a partner they had lived with (cohabiting partner) and one in four reported violence by a partner they may or may not have lived with (i.e. a combined total for cohabiting partner and boyfriend/girlfriend/date).
Similar to the previous section, in this section we examine prevalence in the Australian female population, victim demographics, incident characteristics and post-incident actions and impacts. Due to the additional data collection in the PSS related to partner violence, this chapter is able to provide significantly more detail on incident characteristics and post-incident impacts.
For high level prevalence and demographic data we have included a new, more inclusive, category of partner. The term intimate partner is used to refer to this new category, which includes both cohabiting partners and boyfriend/girlfriend/dates. This new category is valuable in understanding the full extent of partner violence in Australia.
Contents for this section
1 Prevalence: How many women does partner violence happen to?
1.1.2 Intimate partner violence (broad definition)
1.1.2.1 Male intimate partner violence
1.1.2.2 Female intimate partner violence
1.1.3 Boyfriend, girlfriend or date violence
1.1.4 Cohabiting partner violence
1.1.4.1 Former and current cohabiting partner
1.1.4.2 Former cohabiting partner only
1.2.2 Intimate partner violence (broad definition)
1.2.3 Cohabiting partner violence
2 Victim demographics: Who does partner violence happen to?
2.2 State or territory of residence
2.4 Labour force participation
3 Incident characteristics: What happens in partner violence incidents?
3.2 How recently did violence occur?
3.3 Emotional abuse by a partner
3.3.3 Anxiety and fear due to emotional abuse (since the age of 15)
3.3.4 Link between emotional abuse and cohabiting partner violence
3.6.1 Current cohabiting partner
3.6.2 Former cohabiting partner
3.7 Violence witnessed by children
3.7.1 Current cohabiting partner
3.7.2 Former cohabiting partner
4 Post-incident actions and impacts: What happens after a partner violence incident?
4.1.1 Contact with police by victim demographics/a>
4.1.2 Contact with police by extent of violence
4.2.3 Advice seeking by victim demographics
4.2.4 Advice seeking by extent of violence
4.4.1 Anxiety and fear in the 12 months after violence
4.4.2 Fear by extent of violence
4.4.3 Fear and anxiety by type of violence
4.4.4 Fear and anxiety by type of perpetrator
4.4.5 Changes in routine due to fear and anxiety
4.5.1 Temporary separations from a current partner
4.5.2 Temporary separations prior to final separation from former male partner
4.5.3 Reasons for returning to partner
4.5.4 Final separation from former partner
4.5.5 Reasons for last separation

1 Prevalence: How many women does partner violence happen to?
1.1 Since the age of 15
One in four women in Australia have experienced violence by an intimate partner (broadly defined) – approximately two-thirds of these women have lived with the violent partner at some time. Of women who have lived with their violent partner, most had experienced more than one incident of violence.
1.1.1 All violence
Since the age of 15, two out of five women in Australia had experienced some form of violence (3,560,600, 40.8%).
Tbl 4: E13
Close to three million women, or one in three women in Australia experienced violence by a male who they knew[8](2,943,200, 33.7%).
Tbl A1:S11
One in four women had experienced violence by a male intimate partner (broadly defined – see below) (2,194,200, 25.1%). Women who have experienced male intimate partner violence represent three quarters of women who have experienced violence by a known male.
S12
See also Section 3: Partner violence: 1.2 Violence in the last 12 months.
Graph T: Proportion of women experiencing partner violence since the age of 15: By perpetrator type
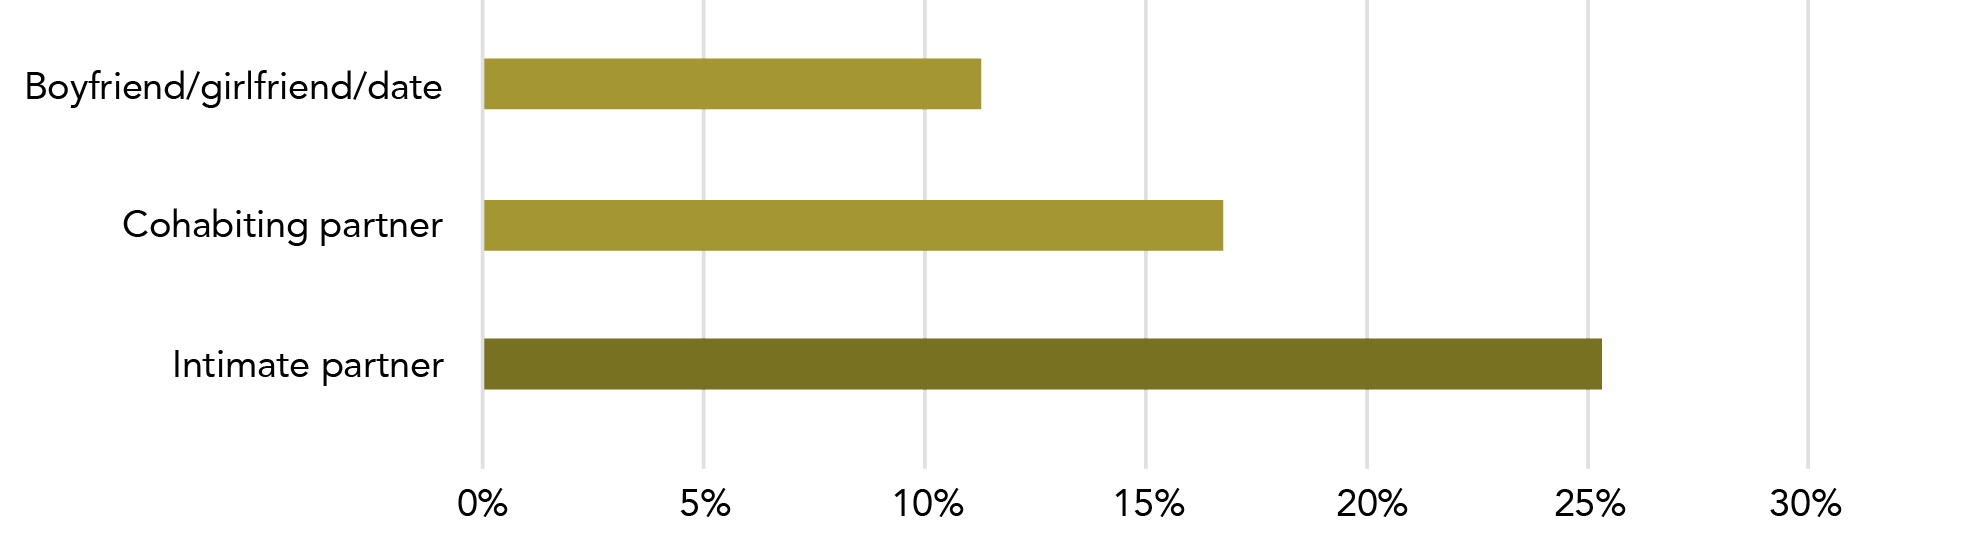
Data table for Graph T:
Perpetrator type Proportion Boyfriend/girlfriend/date 11% Cohabiting partner 17% Intimate partner 25.5%
Note: A woman may experience violence by both a boyfriend/girlfriend/date or a cohabiting partner but will only be counted once in the intimate partner total.
1.1.2 Intimate partner violence (broad definition)
Note: Intimate partner violence is an aggregate prevalence category comprised of boyfriend/girlfriend/date and cohabiting partner. Some women will have experienced violence by both a cohabiting partner and boyfriend/girlfriend/date. In order to avoid double-counting, these multi-victimised women are included only once in the intimate partner category. Data relates to incidents since the age of 15.
In order to distinguish intimate and cohabiting partner data, these data items have been coloured.
1.1.2.1 Male intimate partner violence
All violence
If we use a broad definition of intimate partner that includes male cohabiting partners, boyfriends and male dates, then since the age of 15:
Close to 2.2 million women have experienced at least one incident of violence by a male intimate partner: this is one in four women (25.1%).
Tbl A1: R12, S12
Can I compare sexual assault and partner violence statistics?
Not really. The way information is collected in the PSS means that an individual respondent can show up in multiple groups in the final estimates. The PSS groups respondents into “populations” based on their experiences of violence:
Partner violence is defined as:
- any type of violence
- perpetrated by a particular type of person
Sexual assault is defined as:
- a particular type of violence
- perpetrated by any type of person
A woman who is sexually assaulted by her cohabiting partner will show up in the “partner violence” data, but it will not be possible to identify that the violence she experienced from her partner was sexual assault.
(Partner violence encompasses four “types” of violence perpetrated by cohabiting partners: physical assault, physical threat, sexual assault and sexual threat – respondents who are considered to have experienced partner violence may have experienced one or more of these types, but we cannot tell which type/s).
In addition to showing up in the “partner violence” data, a woman who is sexually assaulted by her cohabiting partner may show up in the “most recent incident” data, but only if her most recent sexual assault was perpetrated by her partner. For a woman whose most recent incident of sexual assault was perpetrated by someone other than her partner, the ABS will have no detailed information about the sexual assault committed by her partner. Moreover, the data for MRI by a cohabiting partner may not be representative of all sexual assaults by a cohabiting partner.
The population of women whose most recent incident of sexual assault was perpetrated by their cohabiting partner is a sub-set of the partner violence population. This means that when considering the data presented here, the “sexual assault” and “partner violence” populations cannot be compared to one another.
Physical violence
Over 1.8 million women have experienced physical violence by a male intimate partner:
Tbl A1: F12
Over 1.7 million women have experienced physical assault by a male intimate partner: this is one in five women in Australia (19.6%).
B12 C12
432,100 women reported physical threat by a male intimate partner: this is one in twenty women in Australia[9] (4.9%).
D12 E12
Sexual violence
One in ten women in Australia have experienced sexual violence by a male intimate partner (873,000, 10%):
Tbl A1: L12
- Over 800,000 women have experienced sexual assault by a male intimate partner: this is one in 11 women (9.2%).
- 126,500 women have experienced sexual threat by a male intimate partner.
H12, I12, J12
Why don’t you just call it domestic violence?
The PSS classifies a person as having experienced partner violence if they have experienced, at any point since they turned 15, at least one incident of violence (assault or threat) by a partner. In the broader community, as well as by professionals working to prevent violence against women, the term “domestic violence” tends to be used to refer to a sustained pattern of violence and threat that works to create a context of coercive control. Although the PSS “cohabiting partner violence” cohort will include women who have experienced coercive control, it will also include women whose experience of violence is much more sporadic and incidental (see Section 3: Partner violence: 1.1.4.3: Extent of violence).
1.1.2.2 Female intimate partner violence
Using the broad definition of an intimate partner, 0.3% of all women in Australia have experienced violence by a female intimate partner since the age of 15 (26,000):
Tbl A1: S22, R22
- 24,900 women reported physical violence by a female intimate partner.
- Data for women who experienced sexual violence by a female intimate partner was not reported due to data quality concerns.
F22, L22
Not all women in same sex relationships are lesbians
The PSS does not collect data on the sexual identity of survey respondents.
The information above is about women who have experienced violence by a female partner, girlfriend or date. This data tells us about the sex of the person the female victim was in a relationship with – it does not indicate their sexual identity. Women in this category may, or may not, identify as lesbian – they could, among other things, identify as bisexual, queer, curious, heterosexual or straight. This identity could also change over time, so that, for example, a woman may not identify as lesbian at the time of the survey, but may have done so at the time of the assault.
(Similarly, not every woman who experiences sexual violence by a man identifies as heterosexual.)
According to the Australian Study of Health and Relationships, the population prevalence of women in cohabiting same sex relationships is 0.55%. This is five or six women in every thousand. This population prevalence would mean that the number of respondents to the PSS who are in same sex cohabiting relationships is very low. The small sample size means that the statistics on this population are unlikely to be reliable. It also means that there is very limited data able to be reported from the PSS about women who experienced violence by a same sex partner.
Grulich et al., 2014
Warning – definition change ahead!
The information above uses a broad definition of partner that includes both cohabiting partners and boyfriends/girlfriends/dates. The information below separates data about cohabiting partners and about boyfriends/girlfriends/dates.
The broader definition gives us a better sense of the scale of the problem of intimate partner violence. However, most of the PSS data is limited to cohabiting partners.
1.1.3 Boyfriend, girlfriend or date violence
Close to a million women have experienced violence perpetrated by a “boyfriend, girlfriend or date” (990,700). This is two thirds the number of women who reported being victimised by a cohabiting partner.[10]
Tbl 4:D21
1.1.4 Cohabiting partner violence
1.1.4.1 Former and current cohabiting partner
What exactly are we talking about? Cohabiting partners
The category of cohabiting partner includes both former and current partners who have lived with the survey respondent.
A current cohabiting partner is a person who, at the time of the survey, the survey respondent was living with in a marriage or de-facto relationship.
A former partner is a person who the survey respondent lived with at some point in a marriage or de facto relationship, but who they no longer live with, and includes:
- A partner who was violent towards the survey respondent during the relationship, but the relationship has now ended.
- A partner who was not violent during the relationship, but has been violent since the relationship ended.
- A partner who was violent both during and after the relationship.
A former partner has, at some point in time lived with the survey respondent, however the violence may have started after they stopped cohabiting.
Approximately 1.5 million women, or 16.9% of all women in Australia, have experienced violence by a current or former cohabiting partner: this is one in six women. This equals 41.6% of women who have experienced violence at some point since the age of 15.
Tbl 4: D18 E18
16.8% of women had experienced violence perpetrated by a male partner (1,470, 200) and 0.1% by a female partner (11,100*).[11]
Tbl 6: E20 E40
Some of the women who experienced cohabiting partner violence had also experienced violence from other types of perpetrator.
1.1.4.2 Former cohabiting partner only
I thought it was one in three?
The statistic “one in three women have experienced violence” refers to women’s experience of physical violence by any type of perpetrator.
In contrast, one in six women have experienced violence by a cohabiting partner (see Section 3: 1.1 for an explanation of why using the term “domestic violence” may be problematic, and see Section 1: 2.5 for a detailed explanation of one in three statistics.).
Of women who had experienced violence by a male or female cohabiting partner, 85.6% were victimised by a partner with whom they were no longer in a relationship at the time of the survey (although the vast majority experienced violence while in the relationship) (1,267,200).
Tbl 4: D20
Some women experienced violence by both a former and current partner.
1.1.4.3 Extent of violence
Current cohabiting partner
For women who were in a relationship with their violent cohabiting partner at the time of the survey, two thirds had experienced more than one incident of abuse (154,500, 65.1%).
Tbl 22:D13
Of women who had experienced more than one incident of violence by their current partner, three out of five reported that the violence occurred “a little of the time” (93,200).
D18
Approximately 15,400* women reported that the violence happened all or most of the time. This represents:
- 10% of the women who experienced violence more than once; and
- 6.5% of women who had experienced violence once or more than once by their current cohabiting partner.
D16, Additional analysis
Women who were no longer with their abusive partner reported more frequent abuse than women who were still in a relationship with the abusive partner.
Is that really a “violent partner”?
The term “violent partner” is used in this report to refer to a partner who has perpetrated at least one act of violence, including either threat or assault. The use of this term does not indicate that the partner was necessarily repeatedly violent in the relationship. The term is used as a shorthand and should not be read as having the connotations of repeated violence that may be associated with it in other contexts.
Former cohabiting partner
73% of women who had experienced violence by a former cohabiting partner reported that the violence occurred more than once: this is close to a million women (925,100).
Tbl 22:
E28, D28
Of women who had experienced abuse more than once, 347,900 women reported having experienced abuse all or most of the time, with about half this number reporting abuse that had happened a little of the time (197,200).
D31, D33
Women who had experienced the most frequent abuse (all or most of the time) represented:
- Over a third (38%) of women who experienced abuse more than once; and
- 27% of women who had experienced violence once or more than once by their former cohabiting partner violence.
Additional analysis
Be careful with comparisons
Some of the prevalence data reported in this section looks at women’s experiences of violence by both male and female partners, however much of the detailed analysis is limited to male perpetrators (e.g. where data is collected separately for male and female perpetrators, such as most recent incident data). The focus on male perpetrators also reflects the reality that the vast majority of women report that intimate partner violence is perpetrated by a male partner. Therefore care should be taken when comparing prevalence information and other data in this report, as the populations may be different.
For more statistics related to extent of violence, please see:
Section 3: Partner violence: 3.2 How recently did violence occur?
Section 3: Partner violence: 4.1.5 Contact with police by extent of violence.
Section 3: Partner violence: 4.2.4 Advice and support: Advice seeking by extent of violence.
Section 3: Partner violence: 4.4.2 Psychological impacts: Fear by severity of violence.
1.2 In the last 12 months
The following information relates only to incidents that occurred in the 12 months prior to the woman taking the survey.
1.2.1 All violence
In the last 12 months, one in 20 women in Australia had experienced violence (467,300, 5.3%). Most of these women knew their perpetrator.
Tbl 3:D13
See also: Section 3: 1.1.1 Since the age of 15: All violence
1.2.2 Intimate partner violence (broad definition)
Of women who experienced violence by a known person (346,400), about half experienced violence by an intimate partner (including cohabiting partners and boyfriends, girlfriends and dates) (186,900).
Tbl A2:R11, R12
One in 50 women in Australia experienced at least one incident of violence by an intimate partner in the 12 months prior to the survey (2.1%).
S12
 An equal number of women were victimised by:
- a cohabiting partner they remained in a relationship with (66,200, 0.8%);
- a cohabiting partner that they were separated from by the time they completed the survey (66,300, 0.8%); or
- a boyfriend, girlfriend or date (68,700, 0.8%).[12]
R13, R14, R15
1.2.2.1 Type of violence
All violence
In the year prior to the survey, nine out of ten women who reported violence by an intimate partner experienced assault (sexual and/or physical). One in four reported threat (sexual and/or physical).
Tbl A2:N12, P12
84% of women who experienced intimate partner violence experienced physical violence (assault and/or threat) (157,400).
F12
One in three women who experienced intimate partner violence had at least one incident of sexual violence (assault and/or threat) in the last year (55,000).
L12
Assault only
Of women who experienced male intimate partner violence:
- Seven out of ten experienced physical assault by their cohabiting partner, boyfriend/girlfriend or date (135,900).
- 28% experience sexual assault (52,400)
B12, H12
These numbers include women who, in the 12 months prior to the survey, had experienced separate incidents of physical and sexual assault.
Remember!
Women who reported having experienced violence may have experienced any combination (or only one) of: physical assault, physical threat, sexual assault and sexual threat.
Comparing violence in different relationship types
More women reported having experienced sexual assault by a boyfriend/girlfriend or date than by a current cohabiting partner (24,600 vs 10,700).
Tbl A2:H15, H13
More women reported physical assault in their current cohabiting relationship (53,800) than by:
- a former partner (42,600); or
- a boyfriend/girlfriend/date (41,300).
B13, B14, B15
Of women who had experienced violence in the last year, a greater number reported physical violence than sexual violence: of these women, most had experienced at least one assault.
For more comparisons by type of perpetrator see also:
Section 3: Partner violence: 4.4.4 Fear and anxiety by type of perpetrator.
Section 2: Sexual assault: Perpetrator characteristics.
1.2.3 Cohabiting partner violence
In the 12 months prior to completing the survey, 132,500 women experienced violence perpetrated by a cohabiting partner. This is 1.5% of all women in Australia, and 28.4% of women who experienced violence during this time.
Tbl 3: D18, E18
The same percentage of women experienced violence by a cohabiting partner in the 12 months prior to the 2005 and the 2012 surveys (1.5%).
Tbl 21: D12, E12
Graph U: Number of women who experienced assault during the last 12 months: By perpetrator type
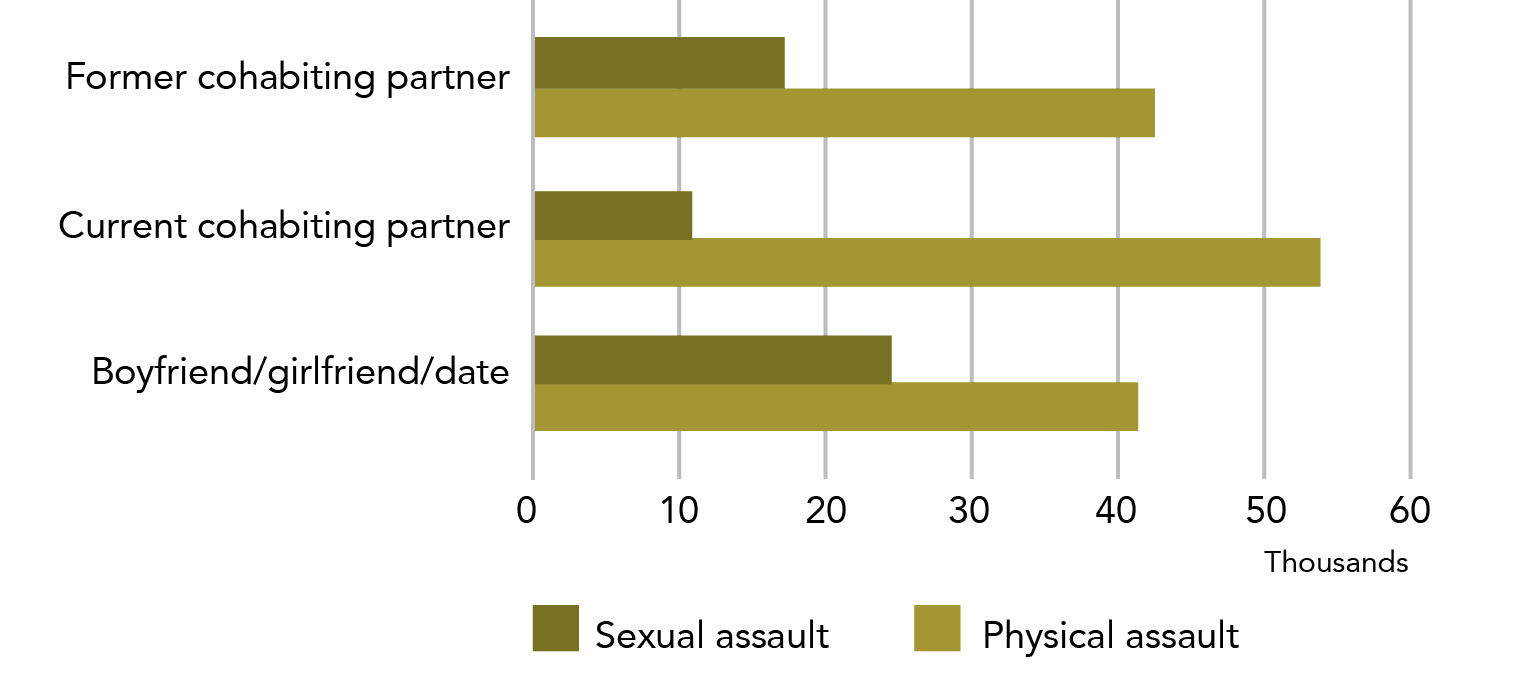
Data table for Graph U:
Relationship Sexual assault Physical assault Former cohabiting partner ~17,000 ~42,000 Current cohabiting partner ~11,000 ~54,000 Boyfriend/girlfriend/date ~25,000 ~41,000
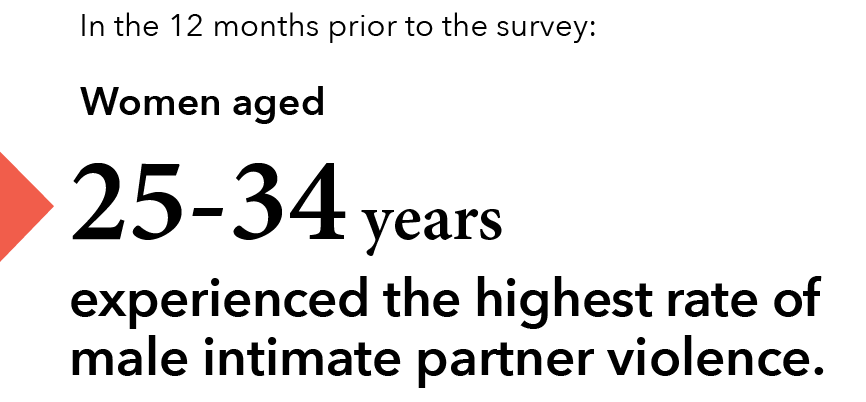
2 Victim demographics: Who does partner violence happen to?
This section outlines a range of key demographic features of victims of cohabiting and intimate partner violence. Statistically significant variation was associated with age, a lack of post-school qualifications and country of birth. No statistically significant variation was identified for the 12 month prevalence of either the categories of cohabiting or intimate partner violence for state or territory of residence, labour force participation, disability status or socio-economic status. With the exception of findings related to location, all data below relates to male partners only.
Statistical significance has been determined against the national rate
Statistical testing has been completed for the information in this section. All significance testing has been against the national rate (i.e., 1.5% for cohabiting partner violence and 2.1% for intimate partner violence).
The significance of differences in rates within a group (e.g., between different ages) has not been calculated.
Tbl A18: B56, Tbl A17: G57
The following demographic information includes data using both the broad and narrow definitions of “partner”.
Recall that:
- Cohabiting partner is a person that the respondent is living with in a marriage or de facto relationship.
- Intimate partner is a broad definition of partner and includes partners that a person may or may not be living with. This category includes cohabiting partners, as well as boyfriends, girlfriends and dates.
2.1 Broad age group
The rate of intimate and cohabiting male partner violence varied with age.
18-24 years
When compared to the rate for all ages, in the year prior to the survey young women were not at increased risk of male cohabiting partner violence (15,500, 1.4%*).
Tbl A18: B18

However, when we used the broader definition of partner, young women were at a statistically significant increased risk of male intimate partner violence (33,500, 3.1%). This result is to be expected as this younger group is more likely to have non-cohabiting intimate relationships.
Tbl A17: F19
25-34 years
The highest rate of male cohabiting partner violence was found in women aged 25-34 years, possibly reflecting the tendency for women of this age to cohabit with their partners.
More than one in 40 women in this age group experienced male cohabiting partner violence in the 12 months prior to the survey (44,300, 2.7%).
Tbl A18: B19
This age group also has the highest rate of male intimate partner violence (61,200, 3.8%), with approximately one in 25 women in this age range having experienced intimate partner violence.
Tbl A17: F20
 The difference between these rates and the national rate is statistically significant.
35-54 years
The rate of male cohabiting and intimate partner violence was consistent with the national rate for women aged 35-44 and 45-54 years.
Tbl A17: F21-22, Tbl A18: B20-21
Over 55 years
Older women were at decreased risk, with 0.4%* (12,800*) of women aged 55 years and older having experienced male cohabiting partner violence in the previous 12 months.[13]
Tbl A18: B22
 The difference between this rate and the national rate is statistically significant.
2.2 State or territory of residence
 None of the states and territories differed significantly from the national estimate for either male cohabiting partner violence or male intimate partner violence.
Tbl A18: C8 – C15, Tbl A17: G9 – G16
2.3 Country of birth
1.6% of women who were born in Australia experienced male cohabiting partner violence in the 12 months prior to completing the survey (94,800).
Tbl A18: B33
For women who were born overseas, the rate is 1.3% (34,600), of which the majority are from countries where English is not the main language (27,100*).
C34 C36
The rate of male cohabiting partner violence experienced by women from main English speaking countries (7,500*, 0.8%*) was about half that of women from countries where English was not the main language (27,100*,1.5%).
C35 C36
The pattern was more marked when we consider the broader category of intimate partners:
Women born in Australia had the highest reported rate of male intimate partner violence (136,100, 2.3%), while women born in other English speaking countries had the lowest (11,600*, 1.2%*).
Tbl A17:F34 F36
 The difference between the rates of violence experienced by women from countries where English is the main language and the national rate was statistically significant for both cohabiting partners and intimate partners. All other rates were consistent with the national rate.
Information on the definition of “main English speaking country” is in Section 2: Sexual assault: 2.3 Country of birth.

2.4 Labour force participation
In the year prior to the survey, there was no difference in the rate of male cohabiting partner violence experienced by women who were employed and those that were unemployed or not in the labour force: the rate of sexual assault experienced for both groups in the 12 months prior to the survey was 1.5%.
Tbl A18: C25 – C26
When considering the broader definition of intimate partner violence, there is a statistically insignificant variation between women who were employed and women who were unemployed or not in the workforce (112,500, 2.3% vs 68,300, 1.8%).
Tbl A17: G26 – G27
 These rates are not significantly different to the national rate.
Information on the definition of labour force is in Section 2: 2.4 Labour force participation.
2.5 Level of education
 Women with a post-school qualification (79,200, 1.7%) reported a statistically equivalent rate of male cohabiting partner violence as women with no post-school qualification (50,200, 1.3%).
Tbl A18: C29 C30
 In contrast, when we used the broader definition of intimate partner, 1.7 times as many women who had a post-school qualification (120,700, 2.5%) reported male intimate partner violence compared to women with no post-school qualification (60,100, 1.5%).
Tbl A17: G31 G30
 The difference in the rate of intimate partner violence and the national rate was statistically significant. All other rates are consistent with the national rate.
Graph V: Proportion of women who experienced male partner violence in the last 12 months: By partner type and sociodemographic characteristics
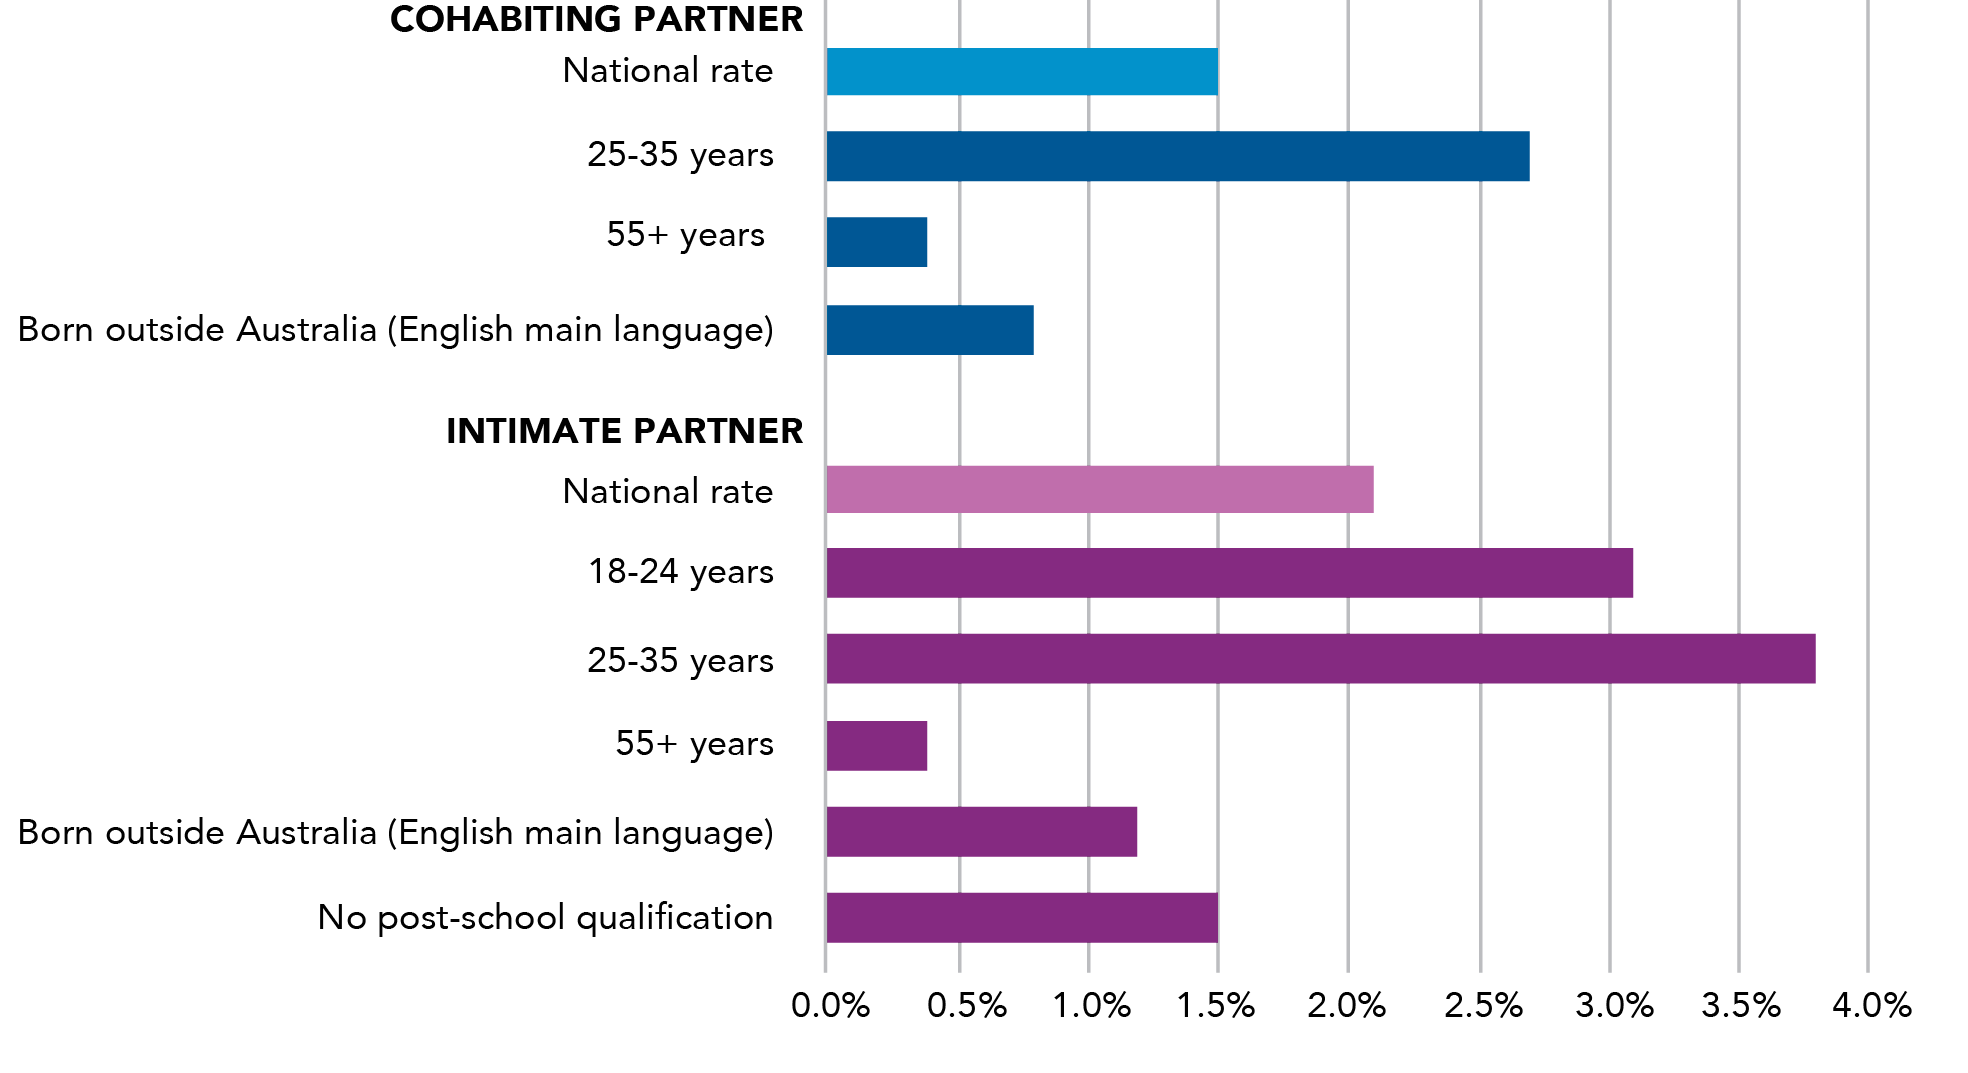
Data table for Graph V – Cohabiting Partner:
Sociodemographic characteristic Percentage National rate 1.5% 25-35 years 2.7% 55+ years 0.4% Born outside Australia (English main language) 0.8%
Data table for Graph V – Intimate Partner:
Sociodemographic characteristic Percentage National rate 2.1% 18-24 years 3.1% 25-35 years 3.8% 55+ years 0.4% Born outside Australia (English main language) 1.2% No post-school qualification 1.5%
Note: Includes only sociodemographic characteristics with a 12 month partner violence rate that is statistically significantly different from the national 12 month partner violence rate
2.6 Disability status
Women with a disability were more likely to experience male partner violence in the year prior to the survey when compared to women without a disability. This is true for both:
the narrow definition of cohabiting partner (51,200, 1.8% vs 78,300, 1.3%); and
Tbl A18: C53 – C54
the broader definition of intimate partner (73,900, 2.6% vs 106,800, 1.8%).
Tbl A17: G54 – G55
 The difference between the rates of violence by a male cohabiting or intimate partner for women with and without disability and the national rate was not statistically significant.
Women with a disability represent about 40% of all female victims of cohabiting and intimate partner violence and 32.3% of the entire survey respondent population (those who had, and had not, experienced violence).
Information on the definition of disability is in Section 2: 2.6: Disability status.
2.7 Socio-economic status
The PSS provides mixed evidence regarding the socioeconomic characteristics of women who experience partner violence. A consistent, but statistically insignificant decrease in violence was seen with increased household income for male cohabiting partner violence and the increased ranking in the Socio-Economic Index of Advantage/Disadvantage for male intimate partner violence.
However, these patterns did not hold for:
- household weekly income for intimate partner violence; and
- the index of advantage/disadvantage for cohabiting partner violence.
Information on the measures of SES status is in Section 2: 2.7 Socio-economic status.
Household weekly income
The rate of male cohabiting partner violence decreased with higher household weekly earnings:
For women with household incomes in the bottom 40%, the rate of cohabiting partner violence was 1.8%.
Tbl A18: C39 – C40
The rate was 1.7% (22,800) for women with an average income (between 40% and 60%).
C41
The rate was 1.6%* (18,700*) for those with a bit more money than most (top 20-40%) and 1.4% (15,600) for those who have the most household income (top 20%).
C42 C43
Socio-Economic Index of Advantage/Disadvantage
The same pattern was present when considering the more expansive cohort of intimate partner violence and the Socio-Economic Index of Advantage/Disadvantage.
The rate of male intimate partner violence in the last 12 months for the most disadvantaged women (lowest quintile) was 2.9% (40,500). For the most advantaged women (in the most advantaged two quintiles), the rate of intimate partner violence was 1.6%.
Tbl A17: G47 – G51
 The difference between the rates for measures of socio-economic status and the national rate was not statistically significant.
2.8 Location
Women who lived outside capital cities at the time of the survey (84,400, 1.5%) experienced the same rate of cohabiting partner violence in the previous year as women who lived in capital cities (48,000, 1.6%). These estimates include both opposite and same sex partners.
Tbl A22: I8 – I9
 The difference in rates of violence by location was not statistically significant.
This isn’t what I was expecting… is this another limitation of the PSS?
Within the PSS, a person is understood as having experienced cohabiting partner violence if, since the age of 15, they have experienced at least one incident of a partner either hurting them or threatening to do so (see the introduction for exact definition).
A large number of the women who were classified as having experienced cohabiting partner violence had only experienced a single incident (27% for former partner, 34.9% for current partner). Although some of these women are likely to have experienced substantial impacts from that single incident, it is plausible that some would not have experienced “domestic violence” in the way that it is commonly understood (i.e., as a sustained pattern of abuse that results in fear and intimidation).
Differences between the PSS and qualitative domestic violence research are not surprising given these different definitions. Put concretely, we must expect differences in the lived experience of women who are living in a woman’s refuge (a common qualitative study population) and a woman who has experienced, at some point since she was 15, one incident of assault or threat by a cohabiting partner.
For further data by demographic characteristics of victims, see:
Section 1: 2. Victim demographics
Section 2: 2. Victim demographics
Section 3: 4.1.1 Contact with police by victim demographics
Section 3: 4.2.3 Advice seeking by victim demographics
Section 4: 2. Victim demographics
Why haven’t you described perpetrator characteristics for partner violence?
In the section on sexual assault, there is a sub-section on perpetrator characteristics. This sub-section is not included in the partner violence section of the report.
The PSS collects limited information on a victim’s account of the characteristics of their perpetrator(s). This incident related data is limited to the relationship that the victim had with the perpetrator (“type” of perpetrator) and the perpetrator’s gender. Thus, we are unable to give any further demographic detail than what is already embedded in the selection of population for this section.
Some comparison between cohabiting partners and other perpetrator types is included in the sub-sections on Incident Characteristics and Post-incident Impacts and Actions.
3 Incident characteristics: What happens in partner violence incidents?
This sub-section describes the characteristics of the partner violence incidents. The majority of incidents involved physical violence, most of which was physical assault (rather than threat only). About half the women who reported having experienced violence by their current cohabiting partner also reported emotional abuse. A similar percentage reported that alcohol/drug use contributed to their most recent incident of violence. Almost all incidents occurred in a private residence. The majority of women who had children in their care at the time of violence reported that their children heard or saw the violence. Most women reported that their most recent incident of cohabiting partner violence occurred more than ten years ago.
Most recent incident (MRI) data has particular limitations that means it should be used carefully. Please see Section 1, ‘Most recent incident data and the separation of male and female perpetrators’ for more detail. MRI data is highlighted in orange to help the reader be aware of when this data is in use.
3.1 Type of violence
Intimate partner violence may involve physical and/or sexual violence.
More women reported that their partner (male or female) perpetrated physical violence than sexual violence, although some women may have experienced both types of violence.
As noted earlier, 2.2 million women had experienced intimate partner violence since the age of 15.
Tbl A1: R12
3.1.1 Physical violence

Since the age of 15, approximately 1.8 million women had experienced physical assault and/or physical threat by a male intimate partner (including cohabiting partner, boyfriend or date). This represents eight out of ten (83.3%) women who have experienced any type of violence by a male intimate partner.[14]
Tbl A1: F12
Most women reported physical violence from a former cohabiting partner:
- 226,800 women experienced physical violence by a current male cohabiting partner;
- 1,149,000 women experienced physical violence by a former male cohabiting partner; and
- 580,300 women experienced physical violence by a boyfriend or date.
F13, F14, F15
Women who are counted in the PSS as having experienced physical violence may have experienced physical assault, physical threat or both.
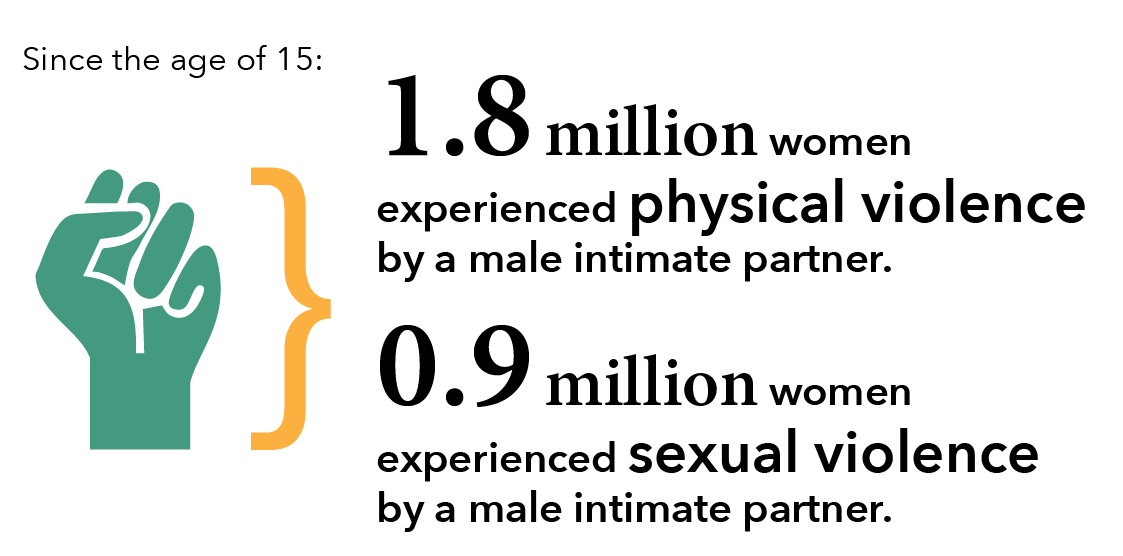
Physical assault
Nine out of ten women who reported physical violence by a male intimate partner indicated that they experienced physical assault. This was true for current cohabiting partner, former cohabiting partner and boyfriend/date.
Tbl A1: B13 – B15
Physical threat
Of women who had experienced male intimate partner physical violence, between one in six (boyfriend or date) and one in four (former cohabiting partner) women had experienced physical threat.
D13 – D15
3.1.2 Sexual violence
Since the age of 15, 873,000 women had experienced sexual assault and/or sexual threat by a male intimate partner. This represents 40% of women who experienced violence by a male intimate partner. These women may, or may not, have also experienced physical violence.
Tbl A1: L12
Most women reported sexual violence from a boyfriend or date:
- 44,900 women experienced sexual violence by a current male cohabiting partner;
- 382,000 women experienced sexual violence by a former male cohabiting partner; and
516,600 women experienced sexual violence by a boyfriend or date.
L13, L14, L15
Sexual assault
Of women who have experienced intimate male partner sexual violence, between 91% (boyfriend or date) and 98.4% (current cohabiting partner) women had experienced sexual assault.
H13 – H15
Sexual threat
Of women who have experienced male intimate partner sexual violence, one in six women had experienced sexual threat by a former cohabiting partner.
J13 – J15
For more detail of prevalence of sexual assault by a partner, see: Section 2: Sexual assault: 1 Prevalence.
It might be tempting, but…
It is not possible to determine how many women had experienced both sexual and physical violence within a single relationship. The survey asks these questions separately and it is impossible to cross-tabulate the information.
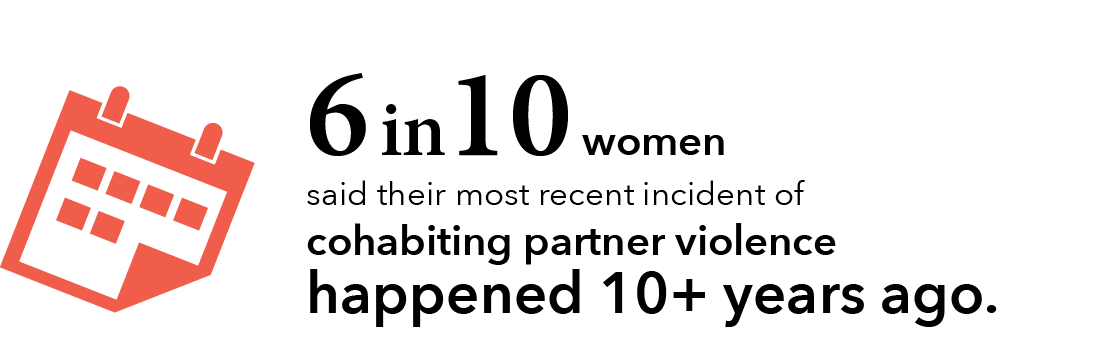
Warning – definition change ahead!
The information above uses a broad definition of partner that includes both male cohabiting partners and boyfriend/date. The information below is about cohabiting partners only.
3.2 How recently did violence occur?
The majority of cohabiting partner violence occured 10 or more years ago.
For women who had experienced male cohabiting partner violence:
- Six out of ten said that the most recent incident of this form of violence occurred ten or more years ago (880,100, 59.9%).
- One in six (15.8%) respondents said their most recent incident of male cohabiting partner violence occurred less than two years ago. Of these:
- one in nine (8.8%) said their most recent incident occurred in the 12 months prior to the survey.
Tbl A19: R14 – R1,5 R9 – R10, R9
Graph W: Women who experienced cohabiting partner violence since the age of 15, when the most recent incident occurred
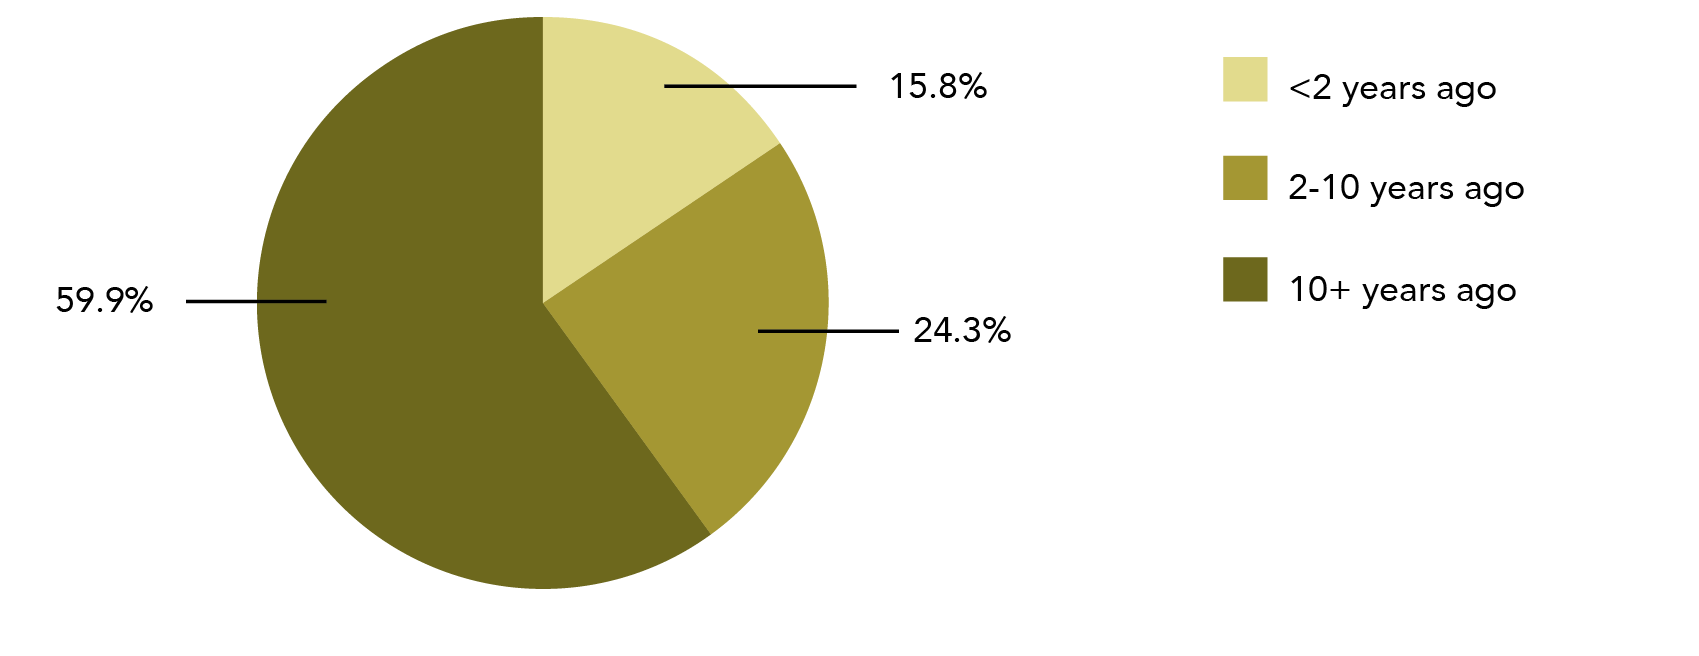
Data table for Graph W:
When the most recent incident occurred Percentage 10+ years ago 59.9% 2-10 years ago 24.3% <2 years ago 15.8%
Note: Data relates to incidents since the age of 15.
Most of the numbers in this section are based on a single incident, potentially a long time ago. Could this mean we are exaggerating the problem?
No. What it means is that the PSS is defining the problem based on behaviours, rather than the meaning or impact of those behaviours. Some women may experience few incidents of violence, but the impact may be very high. Some may experience a lot of violence but not experience this as traumatic or problematic. The PSS tries to disentangle these groups in some of the questions, but it doesn’t include or exclude people from the category of experiencing cohabiting partner violence based on their response to the violence.
However, we need to be careful exactly how we report these statistics – if we say that 1.4 million women have experienced domestic violence, rather than 1.4 million have experienced violence by a partner, then we risk exaggerating the issue. While time consuming and frustrating, being exact with words is important because it ensures that the statistics are accurate.
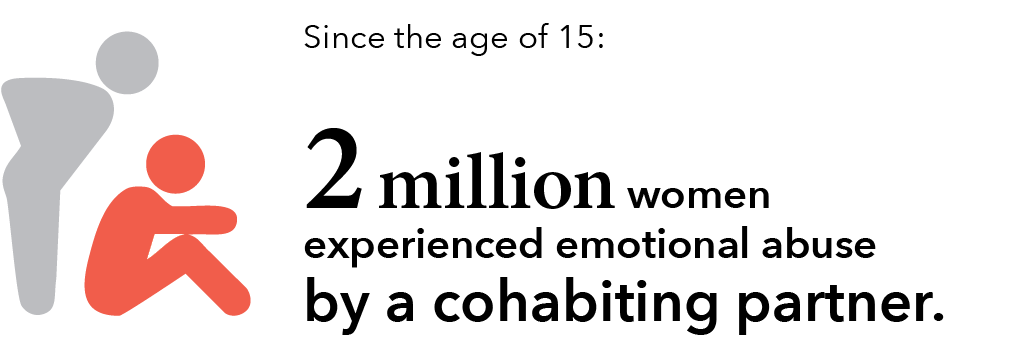
3.3 Emotional abuse by a partner
Emotional abuse is a common aspect of abusive relationships. About half the women who reported that they had experienced violence by their current cohabiting partner also reported that they had experienced emotional abuse by that partner (assuming that they did not have more than one current partner that they were living with).
What is emotional abuse?
Emotional abuse is defined in the PSS as “behaviours or actions that are aimed at preventing or controlling [a partner’s] behaviour with the intent to cause them emotional harm or fear”.
Emotional abuse is only reported for cohabiting partner relationships.
Examples of emotional abuse include deliberate acts to stop or try to stop a partner from:
- contacting family or friends;
- using the telephone, internet or car;
- knowing about or having access to household money;
- working or earning money; or
- studying.
Other examples (not exhaustive) include constant put downs; destroying property; depriving them of medical or psychological care; threatening to harm children, pets or self (but not threats to harm the survey respondent – this would be sexual or physical threat).
Glossary
3.3.1 Since the age of 15
Former or current cohabiting partner
Over 2.1 million women in Australia had experienced at least one incident of emotional abuse by a former or current cohabiting partner since the age of 15: this is one in four women in Australia (24.5%).
Tbl 32: E22
Former cohabiting partner only
Approximately 1.8 million women reported that they had experienced emotional abuse from a partner they were no longer in a relationship with: this is one in five women in Australia (1,840,600, 21.1%).
D24
Current cohabiting partner only
Since the age of 15, an estimated 392,100 women have experienced emotional abuse from a cohabiting partner who they were in a relationship with at the time of the survey: this is one in 22 women (4.5%).
D23, E23
3.3.2 In the last 12 months
One in 20 women in Australia had experienced emotional abuse by a former or current partner in the 12 months prior to the survey (406,800, 4.7%).
Tbl 32:E13
Approximately half of these women had experienced emotional abuse by their current cohabiting partner in the 12 months prior to the survey (217,000, 2.5%).
E14
The other half experienced emotional abuse by a former cohabiting partner (191,300, 2.2%).
E15
3.3.3 Anxiety and fear due to emotional abuse (since the age of 15)
Three out of four women had experienced anxiety or fear due to emotional abuse by a former cohabiting male partner (1,382,600, 76.3%).
Tbl 33:B18
Three out of five women experienced anxiety or fear when this abuse was by:
- a current male cohabiting partner (243,700, 62.5%); or
- a former female cohabiting partner (23,300*, 62.5%).
B16 B19
Being afraid of violence vs being afraid due to emotional abuse
The information in this section relates to fear and anxiety caused by emotional abuse. In the context of the PSS, this is different to fear and anxiety caused by violence. For more information on this distinction and for information on the fear and anxiety as a result of partner violence, please see Section 3: Partner Violence: 4.4 Psychological impacts.
Graph X: Number of women who have experienced violence, emotional abuse or both from a current cohabiting partner
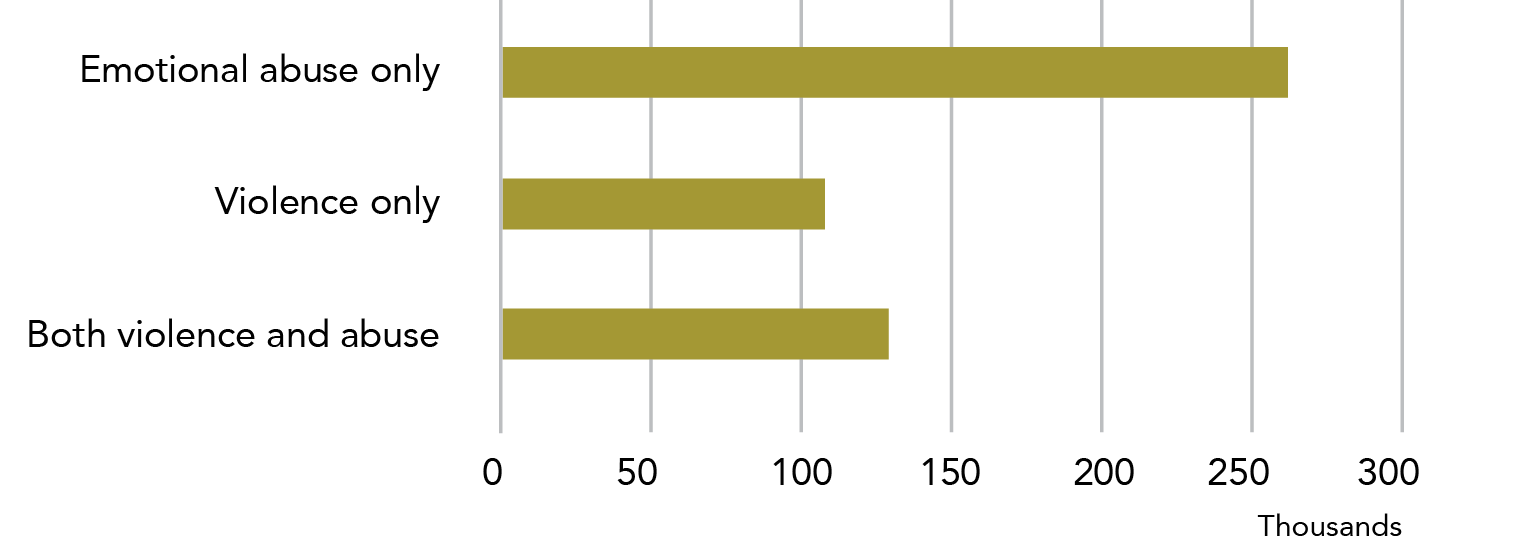
Data table for Graph X:
Type of abuse Number Emotional abuse only ~260,000 Violence only ~110,000 Both violence and abuse ~130,000
Note: Data relates to incidents since the age of 15.
The following statistics relate to the number of women who had experienced both emotional abuse and violence from the same partner, as well as outlining the number of women who had experienced one type of abuse/violence but not the other.
In order to look at these relationships, we are limited to data about current cohabiting partners. We also make the assumption that women are not living with multiple partners at the same time.
3.3.4 Link between emotional abuse and cohabiting partner violence
About half the women who reported having experienced violence by their current cohabiting partner also reported emotional abuse.
Two thirds of women who had experienced emotional abuse by their current cohabiting partner had not experienced violence by that partner.
Below we examine the interaction between violence and emotional abuse in more detail.
See below for references
3.3.4.1 Since the age of 15
Current cohabiting partner emotional abuse and violence
Since the age of 15, 129,400 women had experienced both emotional abuse and violence from their current cohabiting partner. This is:
- 33% of women who had experienced current cohabiting partner emotional abuse;
- 54.6% of women who have experienced current cohabiting partner violence;
- 1.5% of women in Australia.
Tbl A21: B9 C9 Tbl A20: C12
Current cohabiting partner emotional abuse but not violence
Since the age of 15, 262,800 women had experienced emotional abuse but not violence from their current cohabiting partner. This is:
- 67% of women who had experienced current cohabiting partner emotional abuse;
- 3% of women in Australia.
Tbl A21: B10
Current cohabiting partner violence but not emotional abuse
Since the age of 15, 107,800 women had experienced violence but not emotional abuse from their current cohabiting partner. This is:
- 45.4% of women who had experienced current cohabiting partner violence;
- 1.2% of women in Australia.
Tbl A21: D9 E9
Current cohabiting partner emotional abuse or violence
Since the age of 15, 499,900 women had experienced either emotional abuse and/or violence from a current cohabiting partner. This is:
- 1.9 times as many women as had experienced current cohabiting partner emotional abuse only;
- 4.6 times as many women than had experienced current cohabiting partner violence only;
- Approximately one in 17 (5.7%) women in Australia.
Tbl A20: B20, C20

3.3.4.2 In the last 12 months
Current cohabiting partner emotional abuse and violence
In the 12 months prior to the survey, 42,100 women experienced both emotional abuse and violence from a current cohabiting partner: this is 0.5% of women in Australia.
Tbl A20: C9 B9
Current cohabiting partner emotional abuse or violence
In the 12 months prior to the survey, 241,100 women had experienced either emotional abuse or violence from a current cohabiting partner: this is 2.8% of women in Australia.
B17 C17
See also: Section 3: Partner Violence: 4.4 Psychological impacts.
Most women who reported experiencing emotional abuse reported being anxious or fearful due to the abuse. Although emotional abuse is common in relationships that have included at least one incident of violence, it is certainly not a universal feature of these relationships.
Why is the writing so repetitive?
You may have noticed that sometimes the same sentence structure is used when talking about different populations (e.g. women who have experienced emotional abuse, violence or both) with the same variables (e.g. prevalence in the last 12 months). We do this so that:
- the reader is easily able to compare across populations;
- the reader can be familiar with the structure of the sentence (and therefore the data) and use this structural knowledge to help them understand the content;
- we ensure that if a piece of text is taken out of this report, it still includes the information that is needed for it to be accurate; and
- we can write accurately about a survey that provides detailed but complex data (e.g. in order to give the statistics in the dot points of the previous paragraph on cohabiting emotional abuse or violence, we needed to identify and address ten variables).
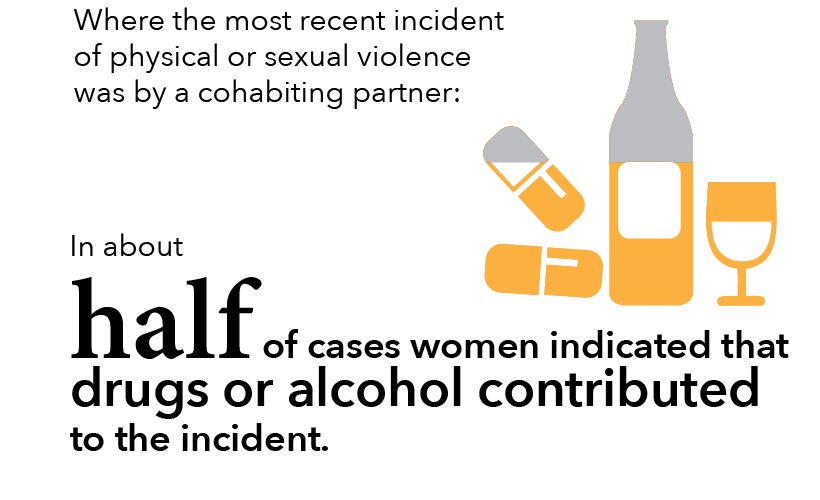
A (very) partial picture: Most recent incident data
Some of the data we have about partner violence comes from the most recent incident (MRI) data module. This data has specific limitations that makes it difficult to report in some contexts.
MRI data is collected when the ABS asks a survey respondent about their most recent incident of eight types of violence (sexual assault, sexual threat, physical assault and physical threat by a male or female perpetrator). As part of this module, the participant answers who perpetrated the most recent incident.
A person’s most recent incident of violence may, or may not, be their most recent incident of partner violence. For example, imagine that Joe has experienced sexual assault by both a partner and a friend. The assault by the friend happened after the assault by the partner. Although Joe has a most recent incident of partner sexual assault that she could answer questions about, when she responds to the survey with the ABS staff member, she will answer about her most recent sexual assault (i.e., by the friend).
MRI data does not provide information about patterns of violence; it only provides information about the most recent incident. A person may have been hit 50 times by their boyfriend and once by their best friend, but if the hit by the best friend was the most recent incident, it will be the only one captured in the MRI data.
MRI data does not provide information about whether someone has ever done something (e.g., gone to the police), it only says how many people have done so in their most recent incident.
MRI data is highlighted in orange to help the reader be aware that it should be used carefully.
3.4 Alcohol and other drugs
Warning – definition change ahead!
The following section includes data for women who had a male cohabiting partner(s).
Alcohol and other drugs “contributed to the incident”
Survey respondents are asked whether they think drugs or alcohol contributed to their most recent incident of eight types of violence.
“Contributing” may include if the victim was under the influence of alcohol or other substances; if the victim believes that alcohol or drugs were added to their drink without their consent; or if the victim believed the perpetrator was under the influence of alcohol or drugs.
For each scenario, alcohol and other substances are asked about separately.
The following data refers to a woman’s most recent incident of violence by a male perpetrator (MRIMP). See A (very) partial picture above for information about how this information is collected.
Where a woman’s MRIMP was perpetrated by a male cohabiting partner, about 50% of respondents reported that alcohol/drugs contributed to the most recent incident.

Alcohol and other drug data is collected by type of incident and cannot be collated. Between 47.2% (physical threat) and 55.7% (sexual assault) of women said that alcohol/drug use contributed to the most recent incident of that type of violence when it was perpetrated by a male cohabiting partner. The difference across violence types was not statistically significant.
Tbl A5: K18 K25
For information about alcohol use in relation to sexual assault, including cohabiting partner sexual assault, see Section 2: 4.2 Alcohol and other drugs.

3.5 Location of incident
Three quarters of a million women reported that their MRIMP of physical assault was perpetrated by a cohabiting partner and occurred in a private residence. A quarter of a million women reported that their MRIMP of sexual assault by a cohabiting partner occurred in the same location.
Tbl A5: B12 B26
For more information about location of incidents in relation to sexual assault, including partner sexual assault, see Section 2: 4.3 Location of incident.
Graph Y: Proportion of women victims, location of most recent incident of assault by a male, where assault perpetrated by cohabiting partner: By violence type and location
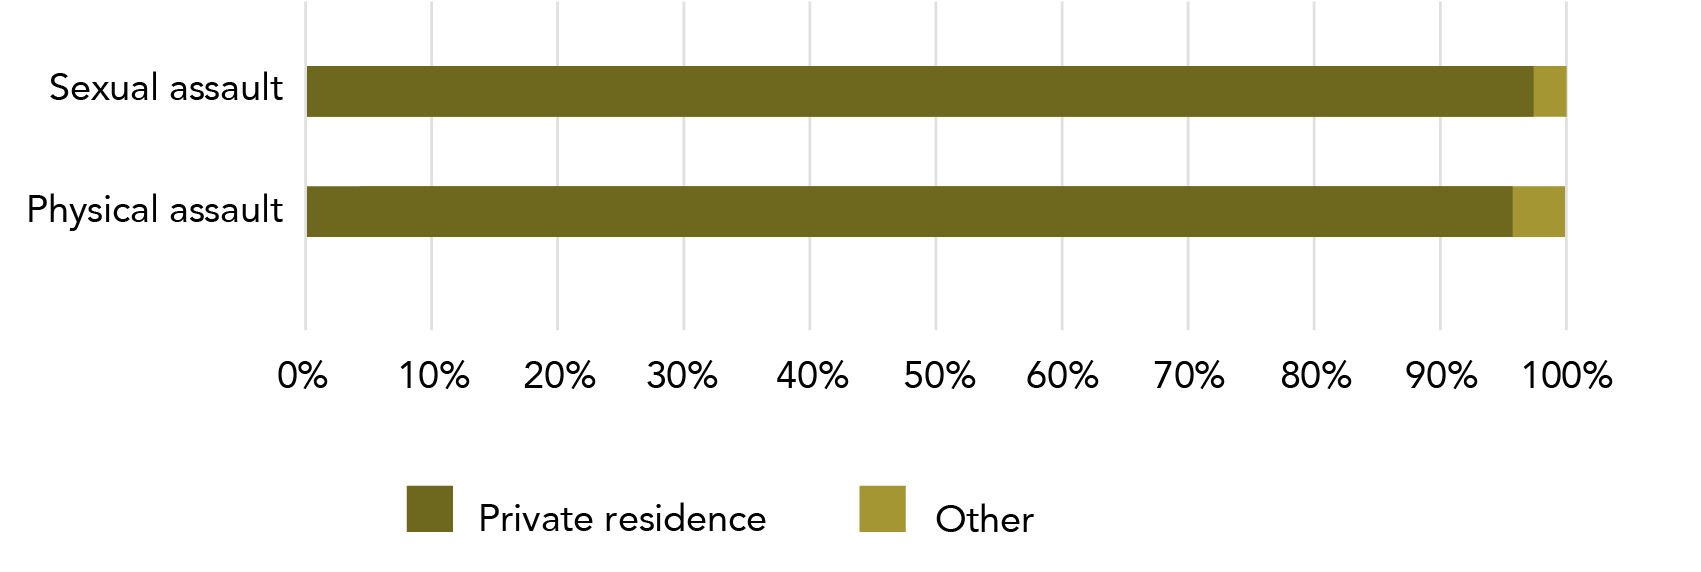
Data table for Graph Y:
Type of Assault Private residence Other Sexual assault 97% 3% Physical assault 96% 4%
Note: Data relates to incidents since the age of 15. Data limited to women whose most recent incident of assault was by a cohabiting partner – this data will exclude women who experienced assault by a cohabiting partner if this violence was not their most recent physical/sexual assault by a male.
No more blue and purple after this!
The rest of this section deals only with cohabiting partners and so we have ceased the colour distinctions for cohabiting and intimate partners.
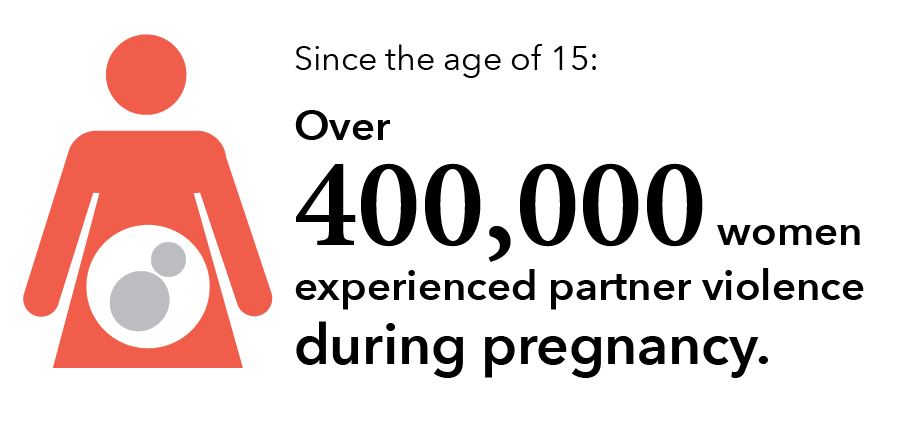
3.6 Violence and pregnancy
Violence during pregnancy is experienced by a minority of women who have been pregnant during a violent cohabiting relationship.
Why are former and current partner separated?
Statistics on violence perpetrated by a cohabiting partner are collected in a range of places in the PSS. For statistics collected in the partner module, the research participant is asked the same set of questions for a former and current partner. This means that they give two answers to each question.
In some cases (as above), the ABS is able to combine the results for former and current cohabiting partner violence. However, in several cases, this is not possible.
To explain why we sometimes need to keep these statistics separate, imagine that Jenny had experienced violence by both her former and current partner. In her survey interview, the ABS staff member asked her “did you call the police?” Jenny answers “Yes” for former partner and “No” for current partner. When it comes time for the ABS to analyse this data, former and current partner are separated, and they can easily record and analyse this information.
Now imagine if we try to combine former and current partner data for Jenny: in one scenario she called the police and in another she did not. At a data level, Jenny has both called the police and has not called the police. Both things are equally true, but they can’t be recorded that way if we combine the data.
If the ABS was to prefer one answer to another (as it would have to do if it was to combine data on former and current partner), then it could be, rightfully, accused of bias. The only way to keep the data balanced is to report former and current partner separately.
Although it may be tempting to combine former and current partner data, it is important to keep these statistics separated. If you combine these numbers, you are ignoring the logic of the survey. Any combined number (that hasn’t been combined by the ABS) is not statistically valid as it will include a number of individuals who have been double counted across the two data sets.
3.6.1 Current cohabiting partner
An estimated 180,600 women had experienced violence by a current cohabiting partner and were pregnant during the relationship. One in five (21.7%) of these women experienced violence during their pregnancy: four out of five of these women did not experience violence while they were pregnant.
Tbl 27: B16
Of the 39,100 women who did experience violence during pregnancy, three out of five (24,000*, 61.4%) experienced violence for the first time during pregnancy.
B14 B12
More women reported that they experienced violence by a former cohabiting partner than a current cohabiting partner during pregnancy (see below).
This data is also represented in the flowchart below.
Figure E: Violence and pregnancy: Current cohabiting partner flowchart
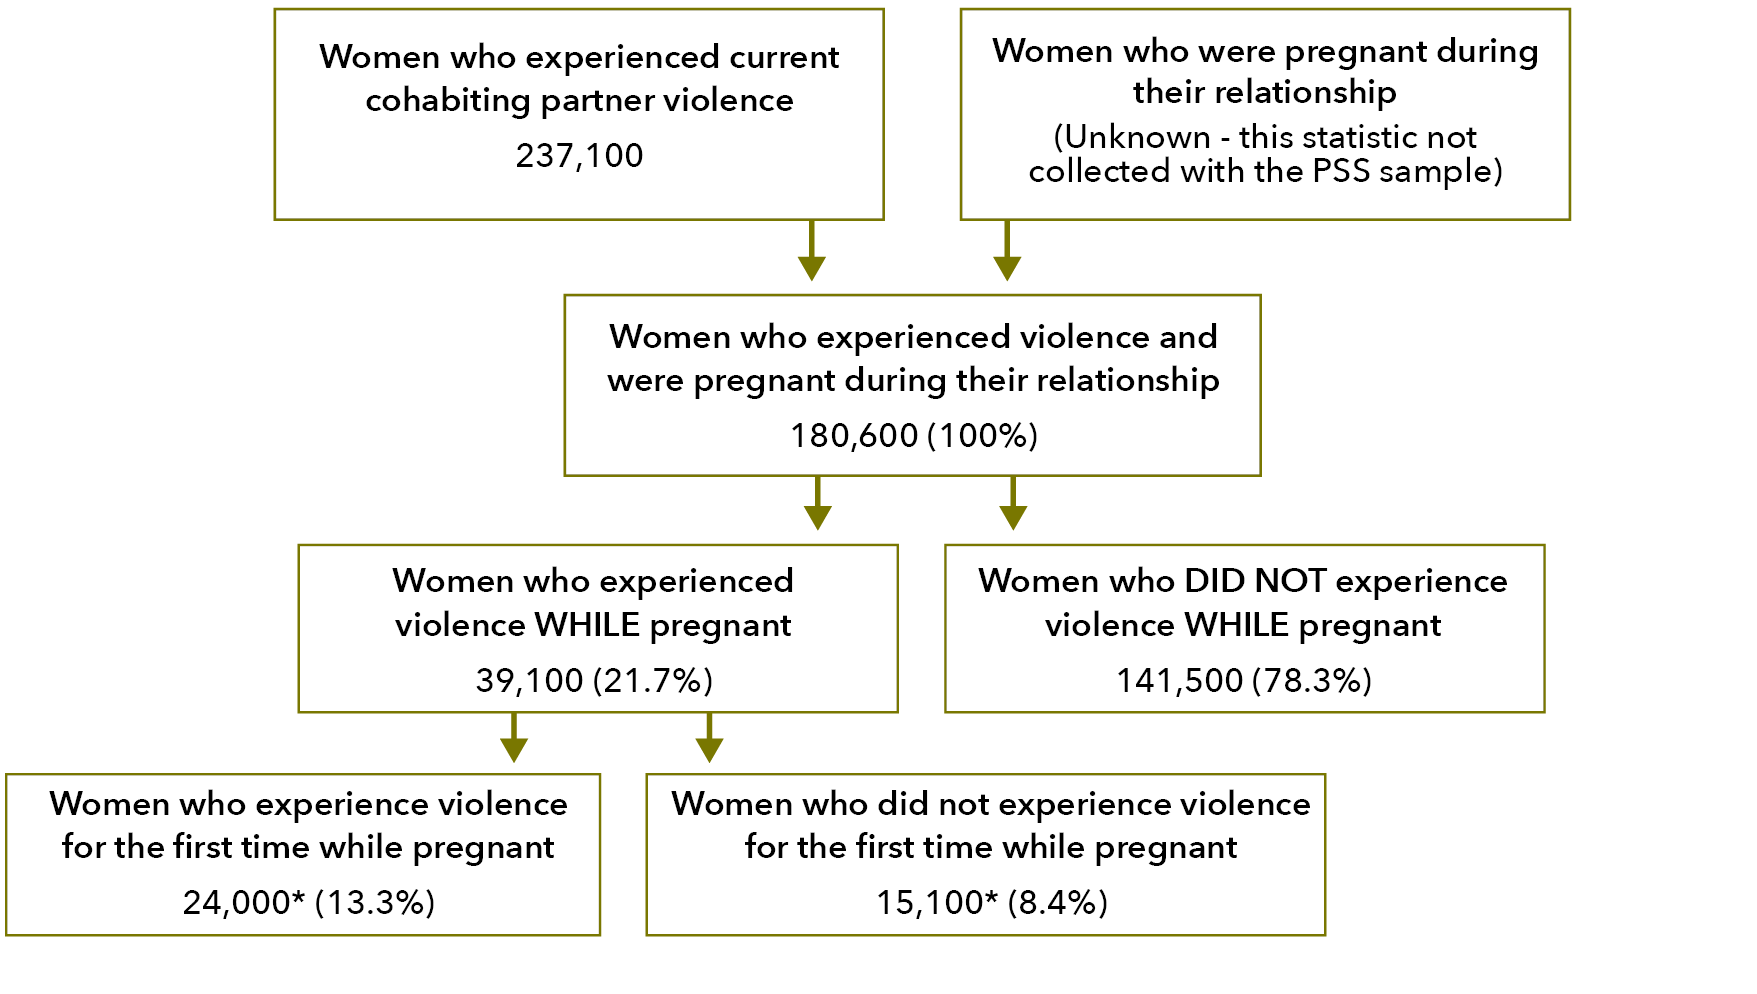
Text alternative for Figure E:
Women who experienced current cohabiting partner violence
237,100
Women who were pregnant during their relationship
(Unknown – this statistic not collected with the PSS sample)
Women who experienced violence and were pregnant during their relationship
180,600 (100%)
Women who experienced violence WHILE pregnant
39,100 (21.7%)
Women who DID NOT experience violence WHILE pregnant
141,500 (78.3%)
Women who experience violence for the first time while pregnant
24,000* (13.3%)
Women who did not experience violence for the first time while pregnant
15,100* (8.4%)
Why do you record how many women were pregnant at some point in their relationship and experienced violence at some point in their relationship?
The data that is outlined about women who were pregnant and had experienced violence demonstrates the need for careful identification of relevant population groups. It is essential to identify women who had experienced violence and were pregnant in the same relationship (but may not have experienced violence while pregnant) so that we can identify the population of women for whom experiencing violence while pregnant was a possibility and thus meaningfully identify the size of the problem.
Put differently, it means nothing to say that a certain percentage of women who had experienced cohabiting partner violence experienced violence while pregnant if we don’t know how many people could have experienced violence while pregnant.
3.6.2 Former cohabiting partner
More than three quarters of a million women were pregnant during their relationship and experienced violence perpetrated by a former cohabiting partner (i.e. a partner they have since broken up with).
Tbl 27: D16
More than half of these women experienced violence during their pregnancy (414,600, 53.9%).
E14
Of the women who experienced violence during their pregnancy, slightly less than half experienced violence for the first time during pregnancy (195,500, 47.1%). This represents a quarter of the women who were pregnant during their violent relationship.
E12
This data is also represented in the flowchart below.
Figure F: Violence and pregnancy: Former cohabiting partner flowchart
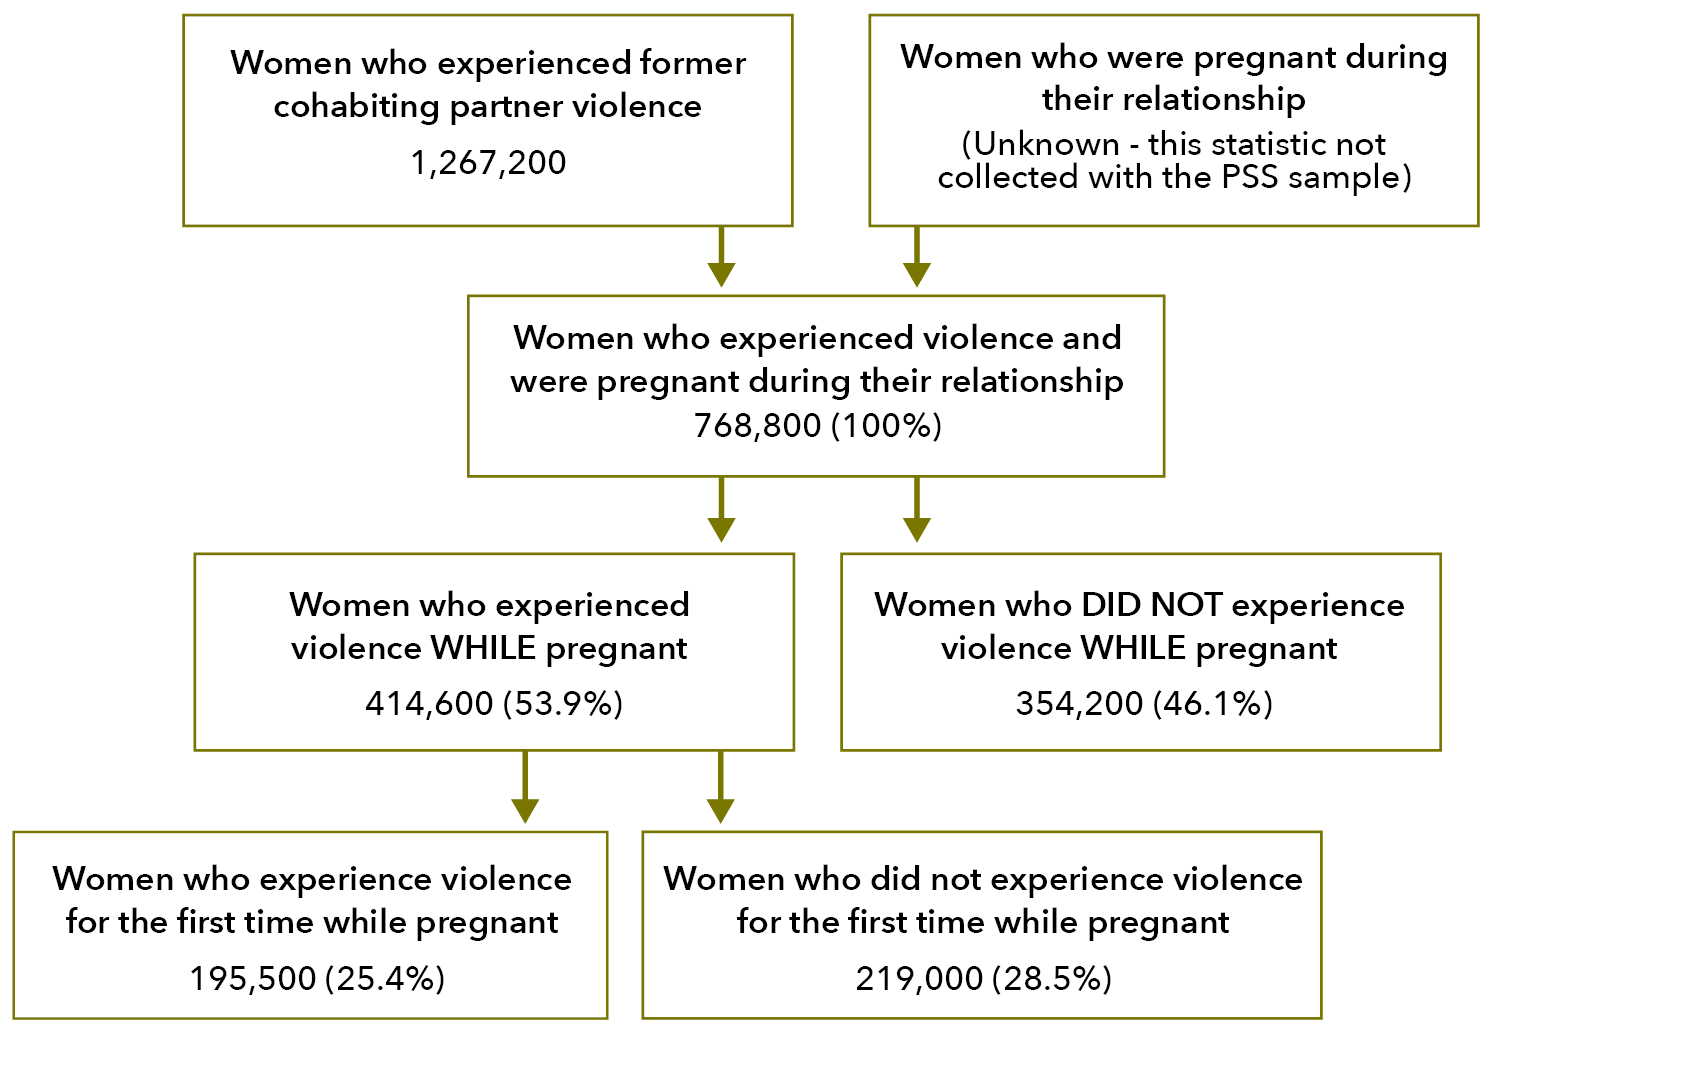
Text alternative for Figure F:
Women who experienced former cohabiting partner violence
1,267,200
Women who were pregnant during their relationship
(Unknown – this statistic not collected with the PSS sample)
Women who experienced violence and were pregnant during their relationship
768,800 (100%)
Women who experienced violence WHILE pregnant
414,600 (53.9%)
Women who DID NOT experience violence WHILE pregnant
354,200 (46.1%)
Women who experience violence for the first time while pregnant
195,500 (25.4%)
Women who did not experience violence for the first time while pregnant
219,000 (28.5%)
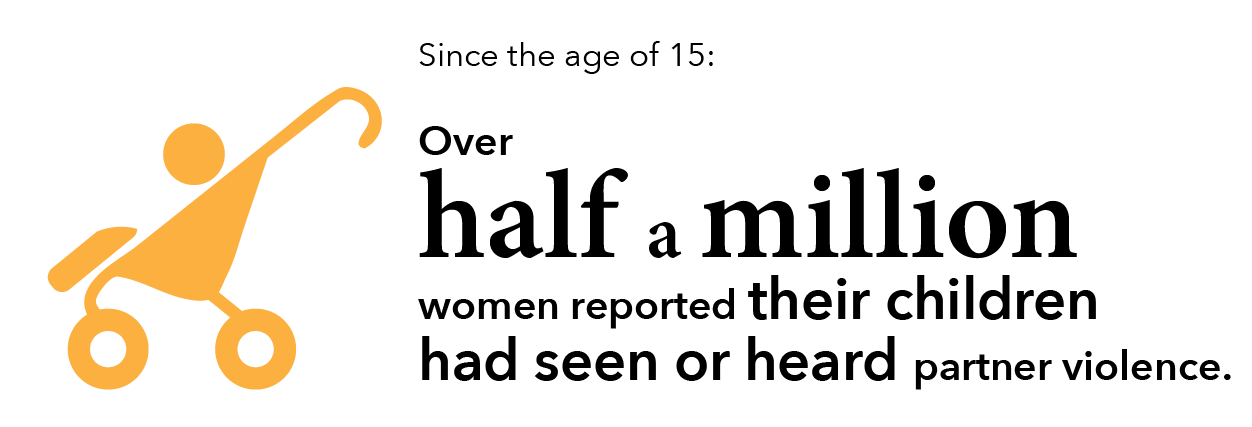
3.7 Violence witnessed by children
Most women who had children in their care during a violent relationship said that the children heard or saw the violence.
3.7.1 Current cohabiting partner
Just over half of women who experienced violence by a current cohabiting partner had children in their care at the time of the violence (128,500, 54.2%). For 57.8% of women in this group, the children heard or saw the violence (74,300).
Tbl 28:D13 D15
 A higher percentage of women reported that the violence was witnessed by children when they reported about violence perpetrated by a former partner.
This data is also represented in the following flowchart.
Figure G: Violence witnessed by children: Current cohabiting partner flowchart
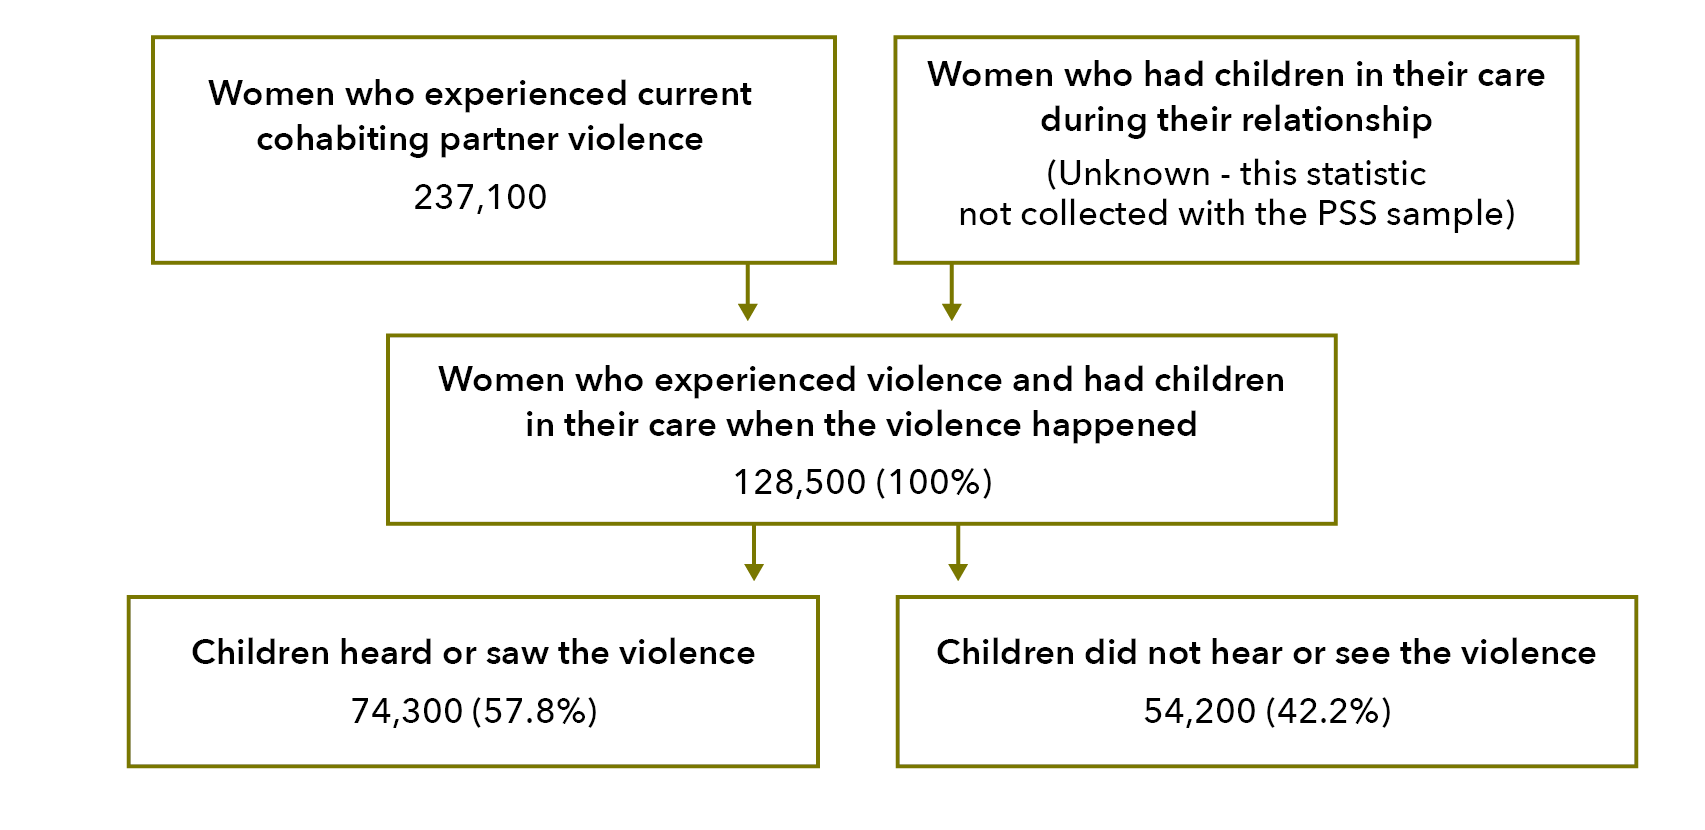
Text alternative for Figure G:
Women who experienced current cohabiting partner violence
237,100
Women who had children in their care during their relationship
(Unknown – this statistic not collected with the PSS sample)
Women who experienced violence and had children in their care when the violence happened
128,500 (100%)
Children heard or saw the violence
74,300 (57.8%)
Children did not hear or see the violence
54,200 (42.2%)
3.7.2 Former cohabiting partner
Close to three quarter of a million women who have since left their violent cohabiting partner had children in their care when the violence occurred (733,900). Over half a million of these women reported that their children had seen or heard the violence (568,700): this is 77.5% of women who had children in their care at the time of the violence.
Tbl 28:D22 D24
This data is also represented in the flowchart below.
Figure H: Violence witnessed by children: Former cohabiting partner flowchart
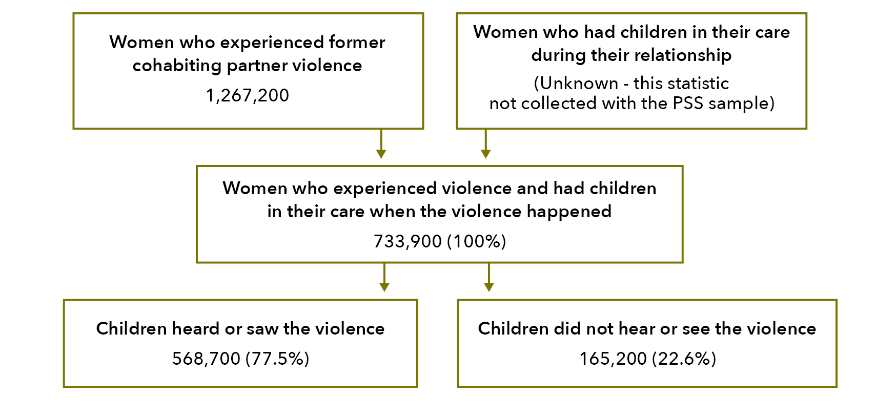
Text alternative for Figure H:
Women who experienced former cohabiting partner violence
1,267,200
Women who had children in their care during their relationship
(Unknown – this statistic not collected with the PSS sample)
Women who experienced violence and had children in their care when the violence happened
733,900 (100%)
Children heard or saw the violence
568,700 (77.5%)
Children did not hear or see the violence
165,200 (22.6%)
For more information on the impact of violence on children, please see Section 3: Partner violence: 4.5 Separations.
Cohabiting partner violence is often witnessed by children, tends to involve alcohol/drug use that is assessed by the victim to have contributed to the incident, and almost always occurs in the home. Such violence is most often a physical assault. When women experience emotional abuse (either as part of the violence or in contexts where there is no violence), they are often frightened.
4 Post-incident actions and impacts: What happens after a partner violence incident?
When their most recent assault by a male (MRIMP) was perpetrated by a cohabiting partner, most women did not contact police. Of those who did contact the police, most indicated that the perpetrator was not charged. The majority of women had told someone about their MRIMP physical assault. A greater proportion of women took time off work because of their MRIMP physical assault by a male cohabiting partner than after a physical assault by a stranger or other known person. Unsurprisingly, women who experienced more violence also experienced more fear and anxiety about the violence. Most women did not permanently leave their violent partner the first time that they separated.
Keeping sexual assault and physical assault separate
The data used here to examine police and court contact comes from the MRI data module. This means that the data on sexual and physical assault is separated and cannot be added together. The finer detail of assault type allows for consideration of differences in engagements with legal responses by the type of assault that a woman has experienced.
This section only considers women’s most recent incidents of violence where the perpetrator was a (male) cohabiting partner. This data does not represent all incidents of violence by a cohabiting partner.
4.1 Police and court contact
There are many steps from experiencing an assault to having someone convicted for that crime. The PSS collects data for different stages of that journey. In comparison to women whose MRIMP assault was a sexual assault by a cohabiting partner, more women who were physically assaulted engaged with the criminal justice system.
The following flow charts relate to a woman’s most recent incident of either physical or sexual assault by a male.
Graph Z: Women’s most recent assault by a cohabiting partner, whether incident perceived as crime at the time and police involvement: By assault type
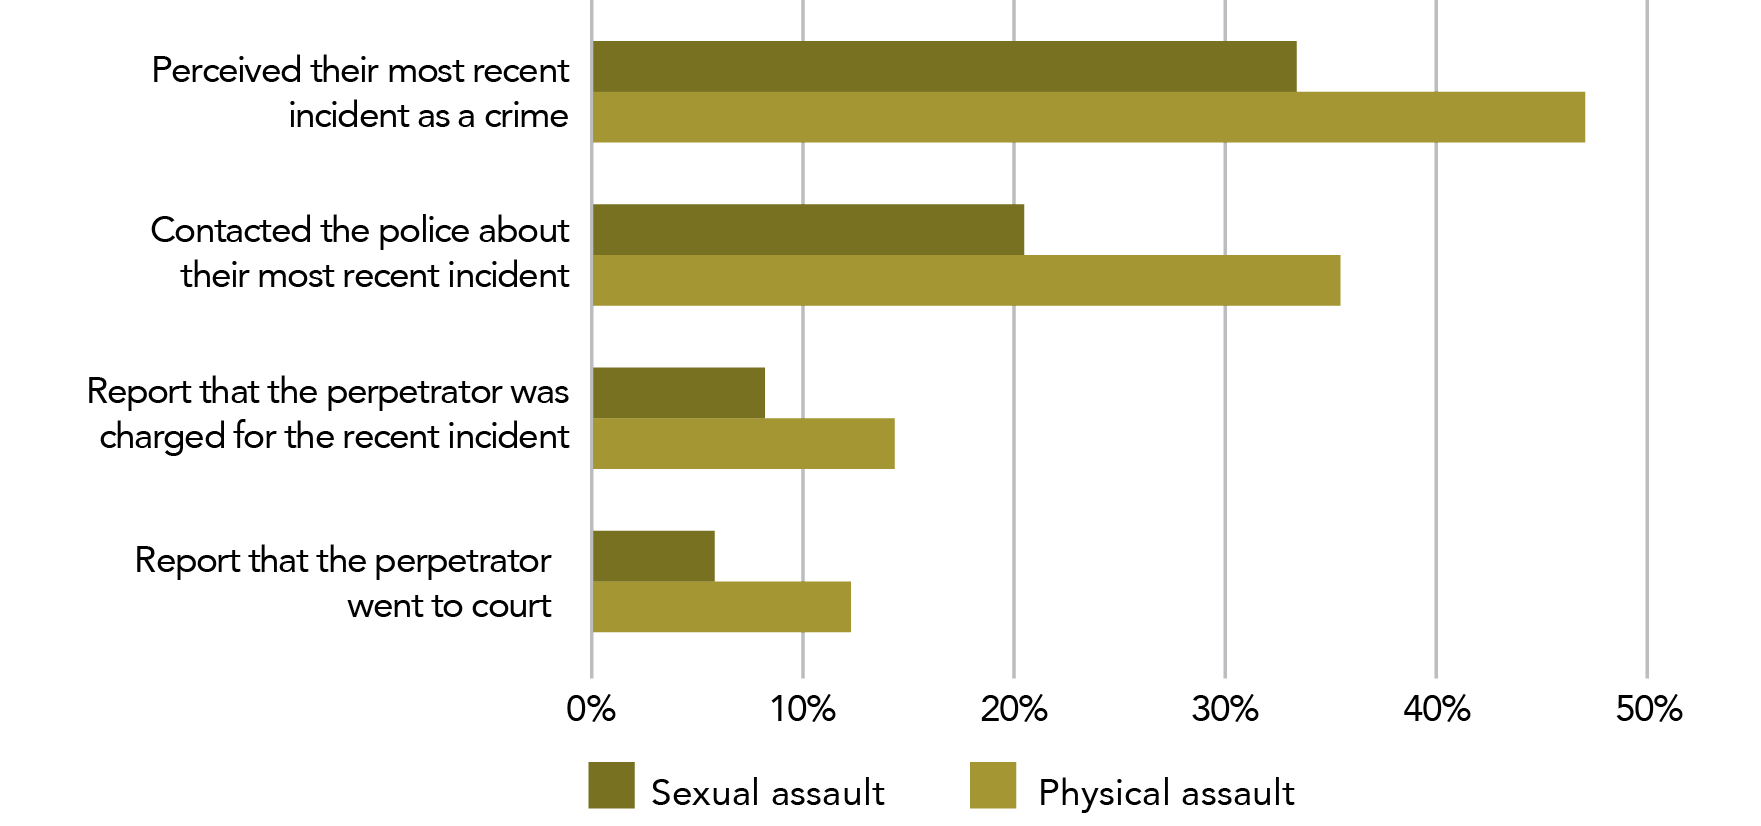
Data table for Graph Z:
Perception Sexual assault Physical assault Perceived their most recent incident as a crime 33.3% 47.1% Contacted the police about their most recent incident 20.1% 35.5% Report that the perpetrator was charged for the recent incident 8.3% 14.5% Report that the perpetrator went to court 6% 12.2%
Note: Data relates to incidents since the age of 15. Data limited to women whose most recent incident of assault was by a cohabiting partner – this data will exclude women who experienced assault by a cohabiting partner if this violence was not their most recent physical/sexual assault by a male.
Below we provide three flowcharts outlining the stages of a woman’s engagement with the police and court system(s). The first flowchart is a summary of the available data, while the second provides detailed information on physical assault and the third provides the same detail for sexual assault.
Please note that this information is limited to instances of assault (i.e., it does not include threat and therefore is not an account of “violence”).
Figure I: Violence by a male cohabiting partner (summary): Police to court flowchart
Based on Tbl A8.
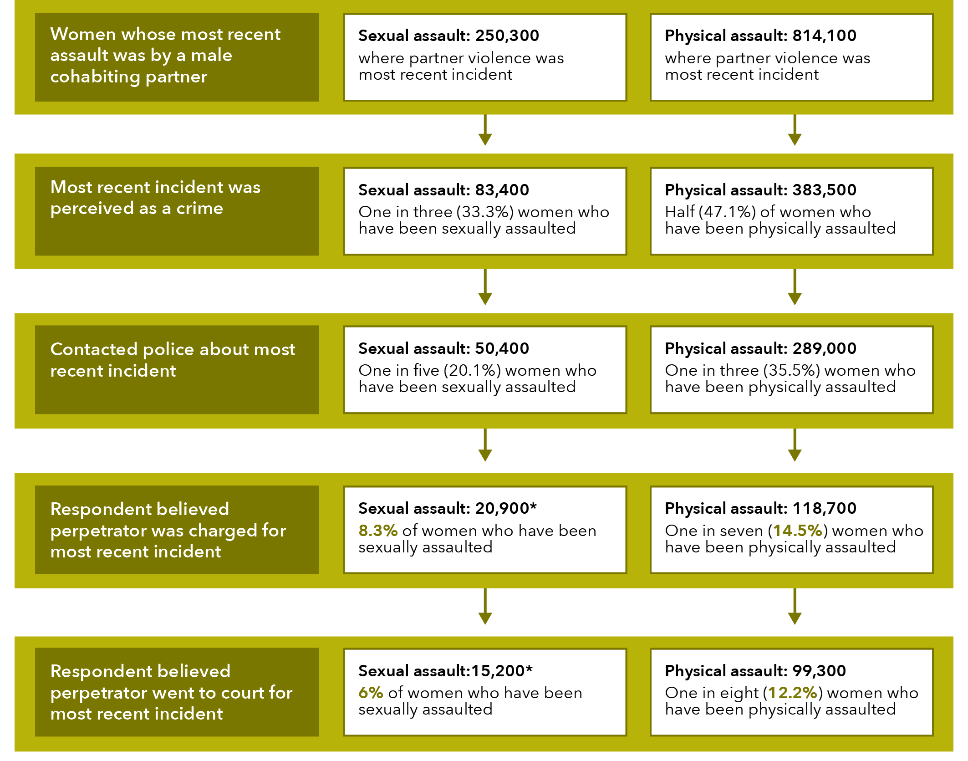
Data table for figure I:
Action Sexual assault: 250,300
where partner violence was most recent incident Physical assault: 814,100
where partner violence was most recent incident Most recent incident was perceived as a crime Sexual assault: 83,400
One in three (33.3%) women who have been sexually assaulted Physical assault: 383,500
Half (47.1%) of women who have been physically assaulted Contacted police about most recent incident Sexual assault: 50,400
One in five (20.1%) women who have been sexually assaulted Physical assault: 289,000
One in three (35.5%) women who have been physically assaulted Respondent believed perpetrator was charged for most recent incident Sexual assault: 20,900*
8.3% of women who have been sexually assaulted Physical assault: 118,700
One in seven (14.5%) women who have been physically assaulted Respondent believed perpetrator went to court for most recent incident Sexual assault:15,200*
6% of women who have been sexually assaulted Physical assault: 99,300
One in eight (12.2%) women who have been physically assaulted
Note: A small number of women who did not perceive the assault as a crime contacted the police.
Reminder!
The category of cohabiting partner includes both former and current partners who have lived with the survey respondent in a marriage or de facto relationship.
Figure J: Most recent incident of physical assault by a male cohabiting partner (detailed): Police to court flowchart
Based on Tbl A8.
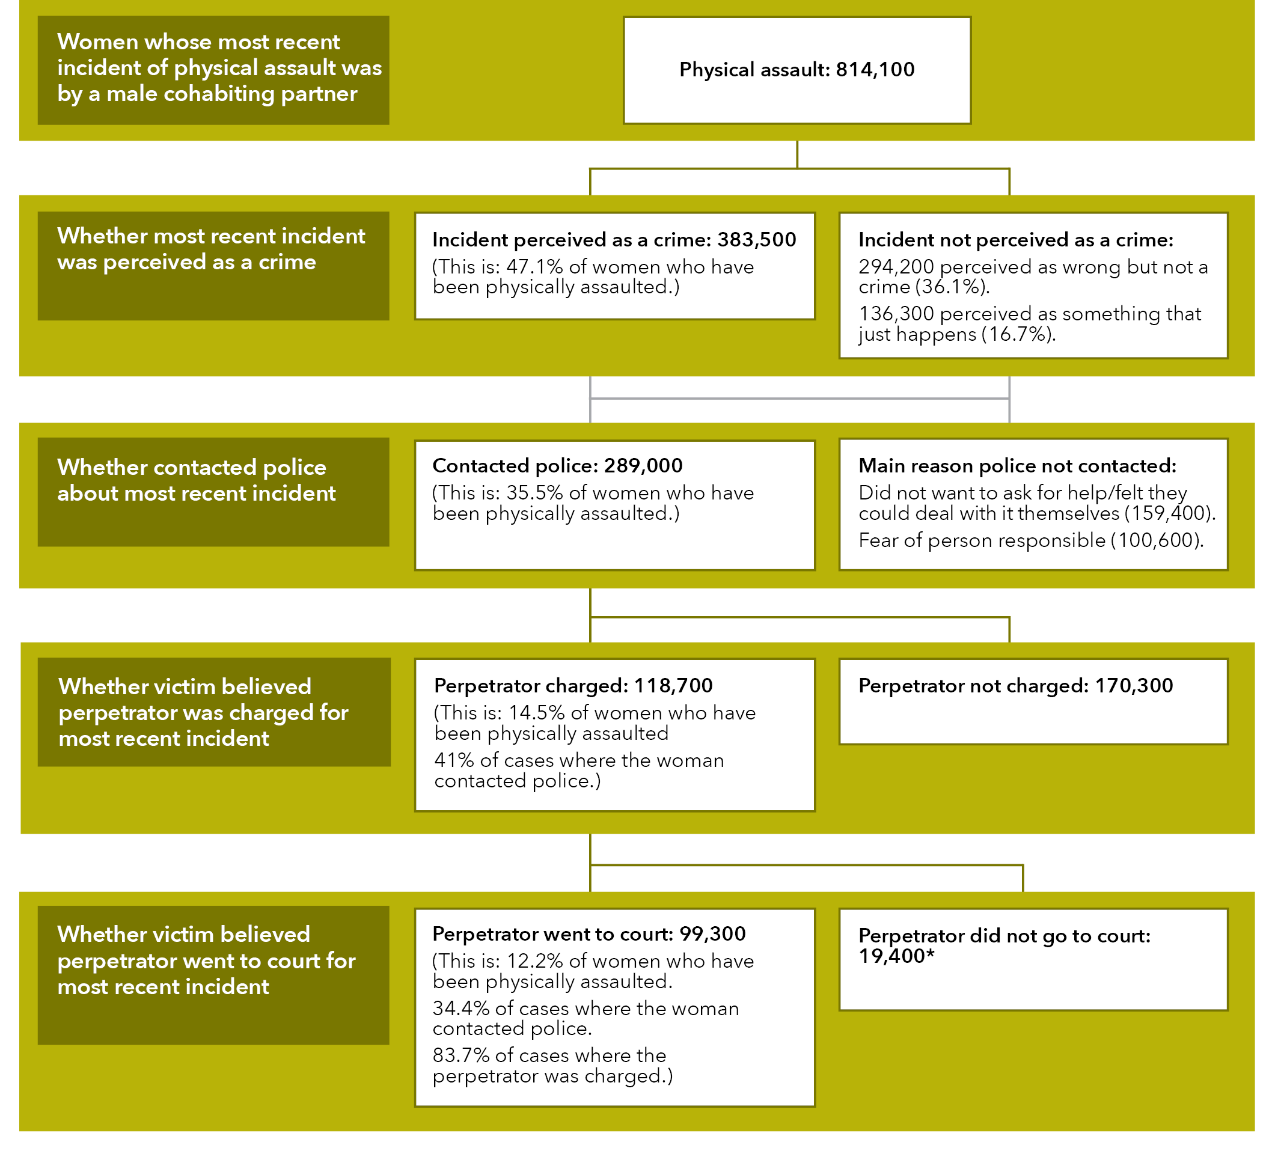
Data table for figure J:
Women whose most recent incident of physical assault was by a male cohabiting partner.
Physical assault: 814,100
Action Yes No Whether most recent incident was perceived as a crime Incident perceived as a crime: 383,500
(This is: 47.1% of women who have been physically assaulted.) Incident not perceived as a crime:
294,200 perceived as wrong but not a crime (36.1%). 136,300 perceived as something that just happens (16.7%). Whether contacted police about most recent incident Contacted police: 289,000
(This is: 35.5% of women who have been physically assaulted.) Main reason police not contacted:
Did not want to ask for help/felt they could deal with it themselves (159,400). Fear of person responsible (100,600). Whether victim believed perpetrator was charged for most recent incident Perpetrator charged: 118,700
(This is: 14.5% of women who have been physically assaulted 41% of cases where the woman contacted police.) Perpetrator not charged: 170,300 Whether victim believed perpetrator went to court for most recent incident Perpetrator went to court: 99,300
(This is: 12.2% of women who have been physically assaulted. 34.4% of cases where the woman contacted police. 83.7% of cases where the perpetrator was charged.) Perpetrator did not go to court: 19,400*
Note: A small number of women who did not perceive the assault as a crime contacted the police
Figure K: Most recent sexual assault by a male cohabiting partner (detailed): Police to court flowchart
Based on Tbl A8.
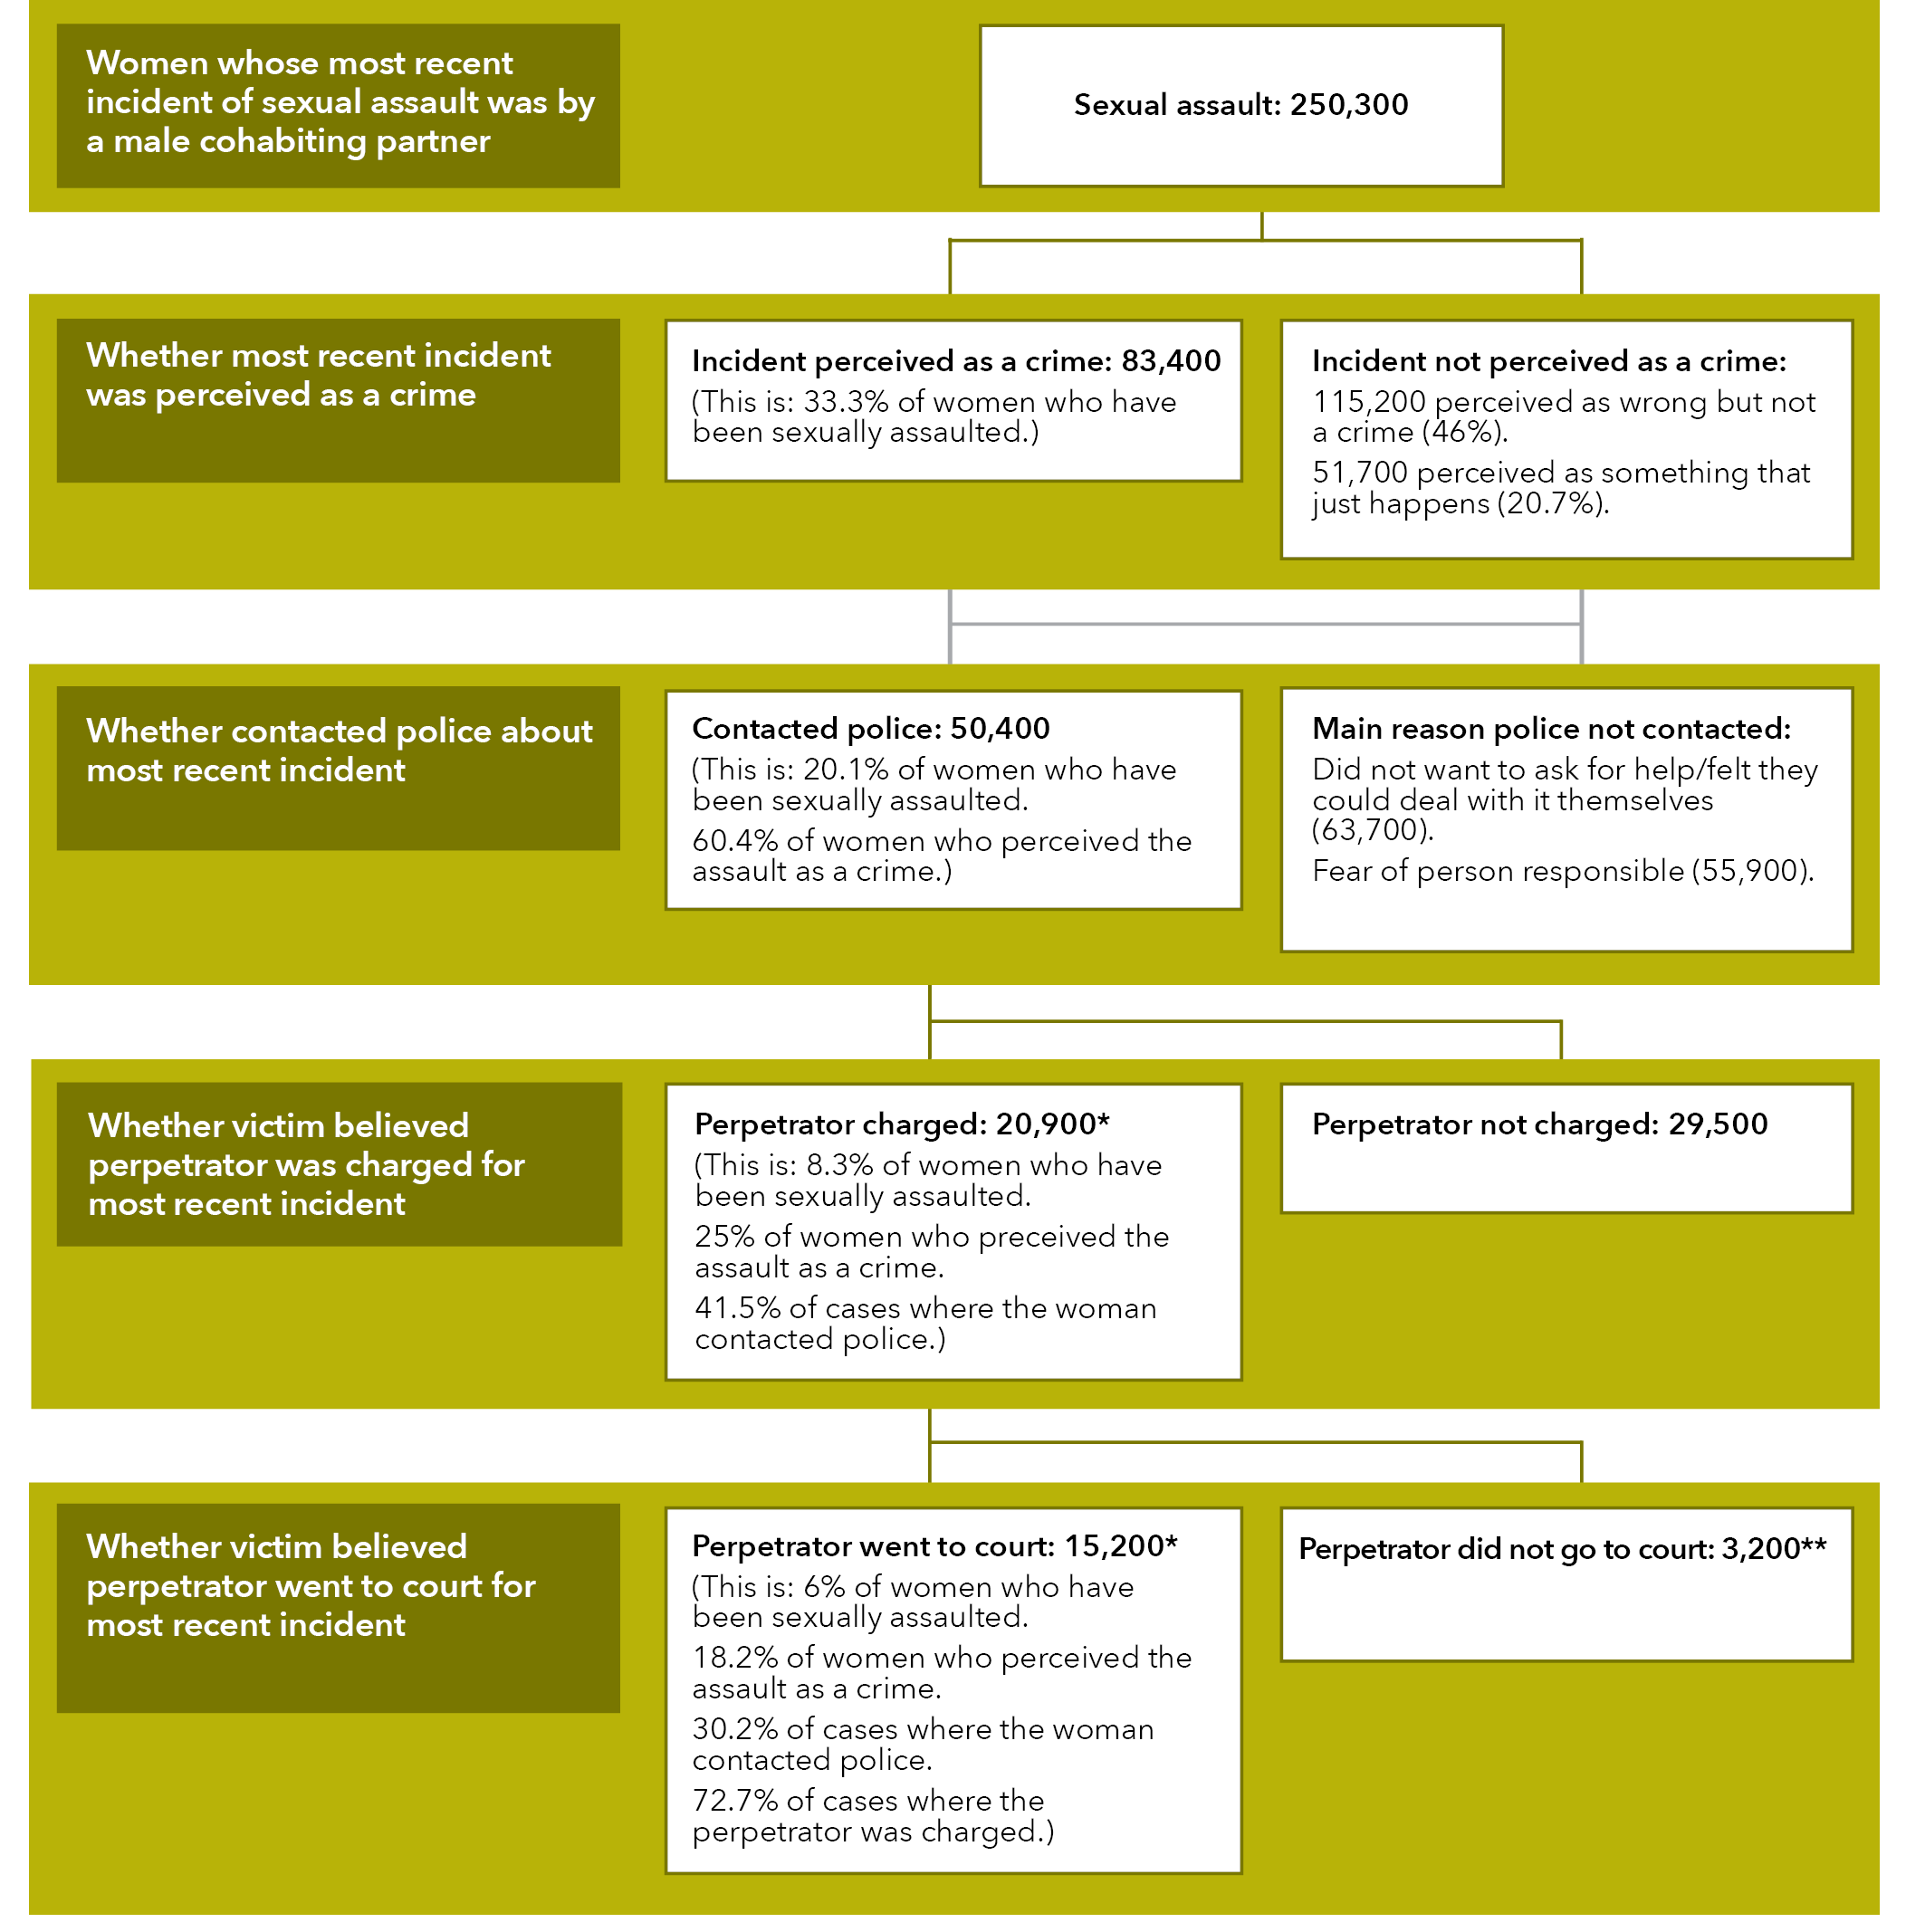
Data table for Figure K:
Women whose most recent incident of sexual assault was by a male cohabiting partner
Sexual assault: 250,300
Action Yes No Whether most recent incident was perceived as a crime Incident perceived as a crime: 83,400
(This is: 33.3% of women who have been sexually assaulted.) Incident not perceived as a crime:
115,200 perceived as wrong but not a crime (46%). 51,700 perceived as something that just happens (20.7%). Whether contacted police about most recent incident
Contacted police: 50,400
(This is: 20.1% of women who have been sexually assaulted. 60.4% of women who perceived the assault as a crime.) Main reason police not contacted:
Did not want to ask for help/felt they could deal with it themselves (63,700). Fear of person responsible (55,900). Whether victim believed perpetrator was charged for
most recent incident
Perpetrator charged: 20,900*
(This is: 8.3% of women who have been sexually assaulted. 25% of women who preceived the assault as a crime. 41.5% of cases where the woman contacted police.) Perpetrator not charged: 29,500 Whether victim believed perpetrator went to court for
most recent incident
Perpetrator went to court: 15,200*
(This is: 6% of women who have been sexually assaulted. 18.2% of women who perceived the assault as a crime. 30.2% of cases where the woman contacted police. 72.7% of cases where the perpetrator was charged.) Perpetrator did not go to court: 3,200**
Note: A small number of women who did not perceive the assault as a crime contacted the police
4.1.1 Contact with police by victim demographics
In general, women who reported demographic characteristics typically associated with social disadvantage contacted the police more than women who reported characteristics that are typically associated with social advantage. Specifically, a higher proportion of women contacted police who were:
- unemployed or not in the workforce;
- did not have post-school qualifications;
- were born overseas; and/or
- had a disability.
Compared to women reporting current partner violence, a higher percentage of women reported that they had contacted police about violence perpetrated by a former partner.
The following information is regarding women’s contact with the police in the 12 months prior to the survey regarding male cohabiting partner violence:
Graph AA: During the last 12 months, proportion of women who experienced former cohabiting partner violence who contacted police about the violence: By sociodemographic characteristics
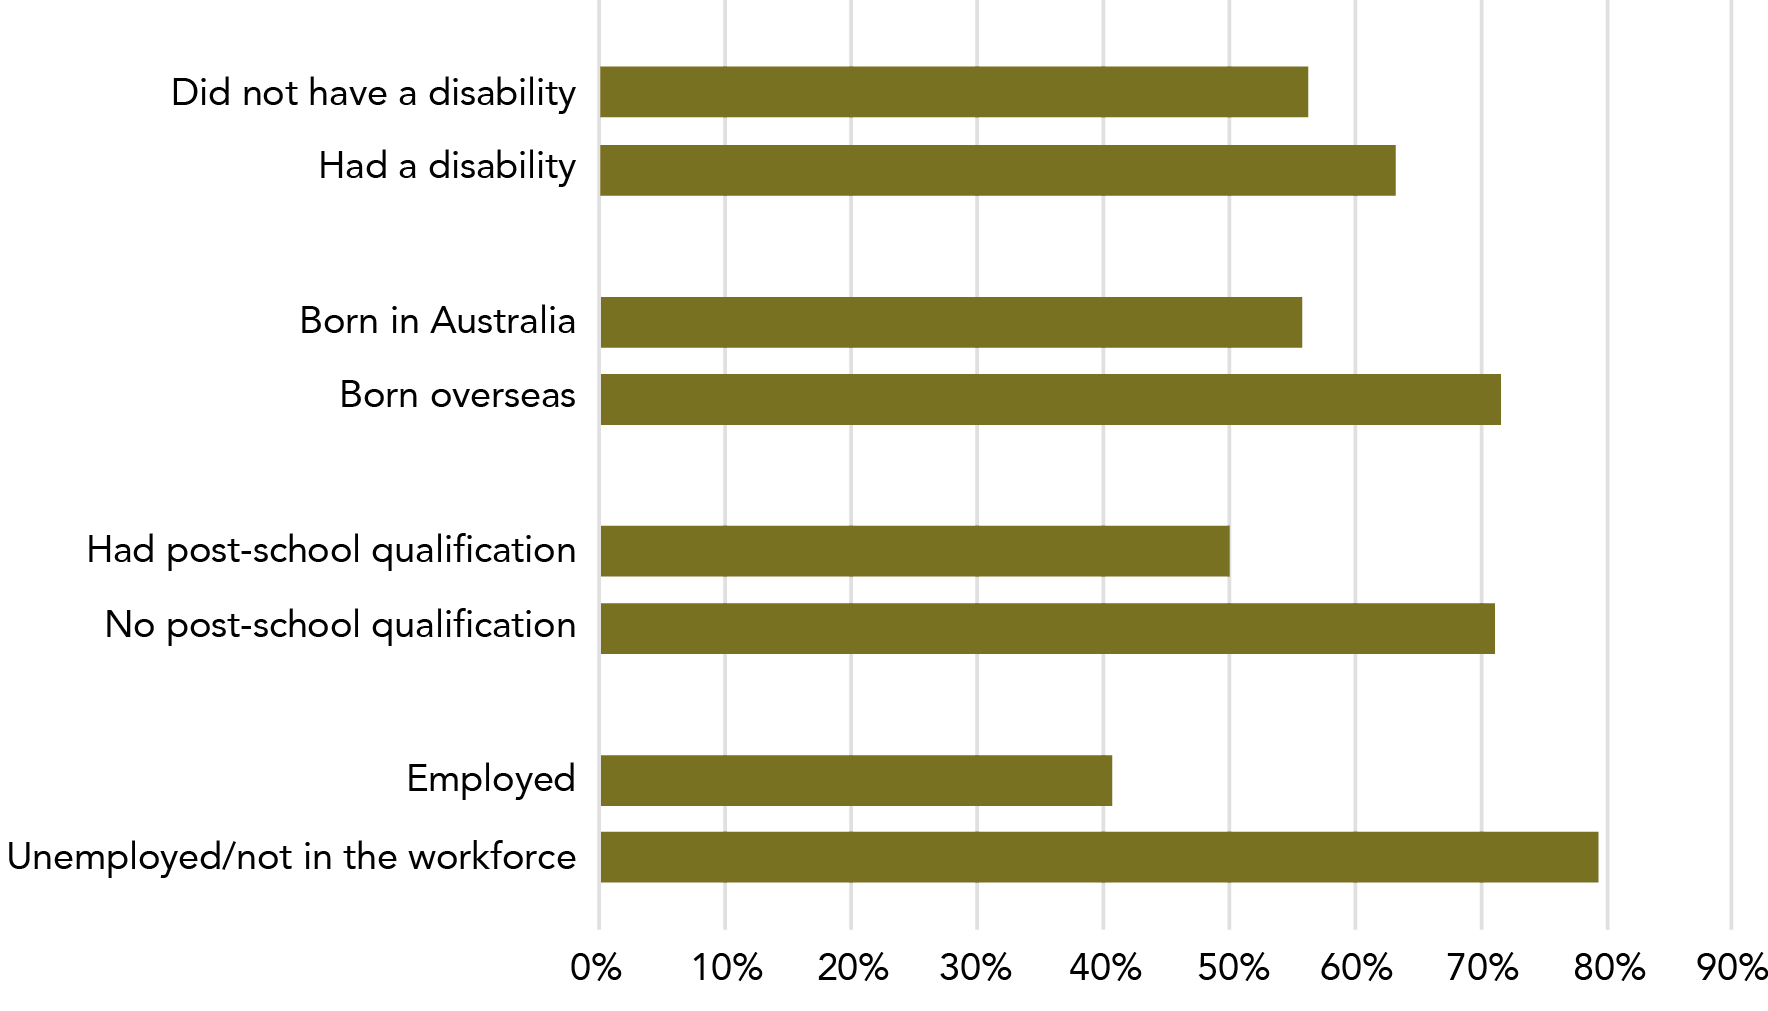
Data tables for Graph AA:
Disability status Percentage Did not have a disability 56.1% Had a disability 63.2%
Country of birth Percentage Born in Australia 55.9% Born overseas 71.6%
Post-school qualifications Percentage Had post-school qualification 49.8% No post-school qualification 71.1%
Employment Percentage Employed 40.4% Unemployed/not in the workforce 79.5%
Note: Data relates to incidents in the 12 months prior to the survey.
Need the police more or more willing to call the police?
Data on the demographics of women contacting the police does not give us information on the severity of the violence. See 4.2.3 of this section for more detail.
Data in this table relates only to experiences of cohabiting partner violence in the last 12 months. This means that the “former partner” category is a lot smaller when compared to lifetime prevalence statistics.
Table L: Women who experienced male cohabiting partner violence in the last 12 months who contacted police about the violence: By sociodemographic characteristics
Of women who have experienced cohabiting partner violence:
Employment Three in ten women who were unemployed or not in the workforce (9,100*, 34.4%*) contacted the police about violence perpetrated by their current partner: this percentage goes up to eight out of ten when considering women who experienced violence by a former partner (23,500*, 79.5%).
Two in ten women who are employed (9,200*, 23.1%*) contacted the police about violence perpetrated by their current partner: this percentage goes up to four out of ten of who experienced violence by a former partner (13,600*, 40.4%*).
Post-school qualifications Three in ten women who did not have post-school qualifications contacted the police about violence perpetrated by their current partner (7,000*, 29.6%*): this percentage goes up to seven out of ten when considering women who experienced violence by a former partner (18,800*, 71.1%).
One in four women who had post-school qualifications contacted the police about violence perpetrated by their current partner (11,300*, 26.5%*): this percentage goes up to five out of ten when considering women who experienced violence by a former partner (18,300*, 49.8%).
Country of birth Three in ten women who were born overseas contacted the police about violence perpetrated by their current partner (8,000*, 34.4%*): this percentage goes up to seven out of ten when considering women who experienced violence by a former partner (8,000*, 71.6%).
Two in ten women who were born in Australia contacted the police about violence perpetrated by their current partner (10,200*, 23.9%*): this percentage goes up to six in ten when considering women who experienced violence by a former partner (29,100, 55.9%).
Disability Four in ten women who had a disability or long-term health condition (10,000*, 36.2%*) contacted the police about violence perpetrated by their current partner: this percentage goes up to six in ten when considering women who experienced violence by a former partner (14,800*, 63.2%).
Four in ten women who did not have a disability or long-term health condition (8,300*, 21.4%*) contacted the police about violence perpetrated by their current partner: this percentage goes up to six in ten when considering women who experienced violence by a former partner (22,300*, 56.1%).
Table A23
For further data by demographic characteristics of perpetrators, see:
Section 3: 2: Victim demographics: Who does violence happen to?
Section 3: 4.2.3 Advice seeking by victim demographics.
Contacting the police vs severity of the violence
Data on the demographics of women contacting the police does not give us information on the severity of the violence.
See 4.2.3 of this section for more detail.
Graph AB: Proportion of women who contacted police about male cohabiting partner violence: By number of incidents
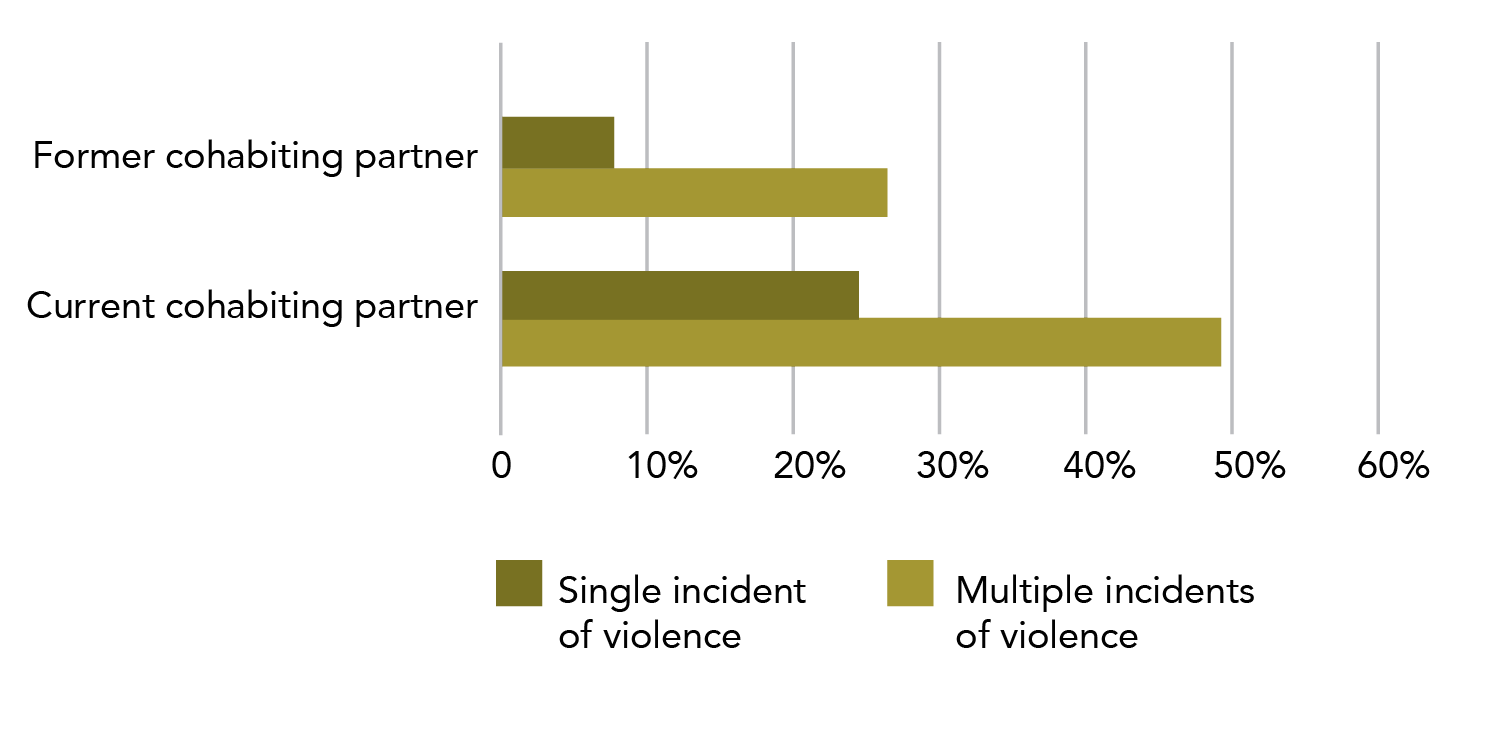
Data tables for Graph AB:
Disability status Single incident of violence Multiple incidents of violence Former cohabiting partner 7.8% 26.3% Current cohabiting partner 24.2% 49.2%
Note: Data relates to incidents since the age of 15.
4.1.2 Contact with police by extent of violence
Women were more likely to contact police about male cohabiting partner violence when there has been more than one incident of violence.
Current male cohabiting partner
One in 13 women who had experienced a single incident of current male cohabiting partner violence reported the incident to police (6,400*, 7.8%*). In contrast, one in four women who had experienced more than one incident had contacted the police at least once (40,600, 26.3%).
Tbl A28:C13 E13
Former male cohabiting partner
A similar pattern was seen for previous male cohabiting partner violence, with one in four (82,300, 24.2%) women contacting police where there had been a single incident only, and one in two (451,000, 49.2%) women having contacted policed when they had experienced more than one incident.
C22 E22
For more statistics related to extent of violence, please see:
Section 3: Partner violence: Frequency: 1.1.4.3 Extent of violence.
Section 3: Partner violence: 3.2: How recently did violence occur?
Section 3: Partner violence: 4.2.4 Advice and support: Advice seeking by extent of violence.
Section 3: Partner violence: 4.4.2 Psychological impacts: Fear by severity of violence.
For more information about contact with police, please see Section 2: Sexual assault: Police and court contact.

4.2 Advice and support
Most women who had experienced cohabiting partner violence talked to someone about their most recent physical assault by a partner, however more women did not disclose this type of assault than assaults by other types of perpetrators. The most common source of advice and support was a friend, family member, work colleague or a person providing pastoral care.
The information below on advice and support relates to women’s most recent incident of specific types of violence. It is separated by violence type. Due to the method of data collection, it is not possible to add together data about different violence types as women may have experienced more than one form of violence.
Telling someone is different to getting advice or support
According to the PSS, to tell someone about an incident only requires that you inform them about the incident: it does not require that the person give you any advice or support.
See Section 2: 4.2 Alcohol and other drugs for more detail on the distinction between seeking advice and disclosure.
4.2.1 Disclosure
The following data refers to the most recent physical assault a women experienced by a male perpetrator (MRIMP). See “A very partial picture” for information about how this information is collected.
Told no one
Where a woman’s MRIMP physical assault was perpetrated by a male cohabiting partner, one in nine women have not told anyone about the assault (91,300, 11.2%).
This is higher than the number of women who didn’t tell anyone when their MRIMP physical assault was perpetrated by:
- a stranger (10,400*, 4.4%*); or
- an “other known male”[15] (58,800, 8.8%).
Tbl A9:E31 C31 G31
Who first told
Of the 722,800 women who have told someone about their MRIMP physical assault (where it was perpetrated by a male cohabiting partner):
- Just under two thirds first disclosed the incident to a friend, family member, work colleague or minister of religion (457,600).
- One in six women told the police first (121,600).
- One in ten women told a general practitioner or other health professional first (68,200).
Tbl A9:D29 D27 D24
Please see Section 2: 5.2 Advice and support for detail on help seeking for women who experience partner sexual assault.
Graph AC: Proportion of women who have experienced physical assault by a male cohabiting partner: First person told about most recent incident, by broad category
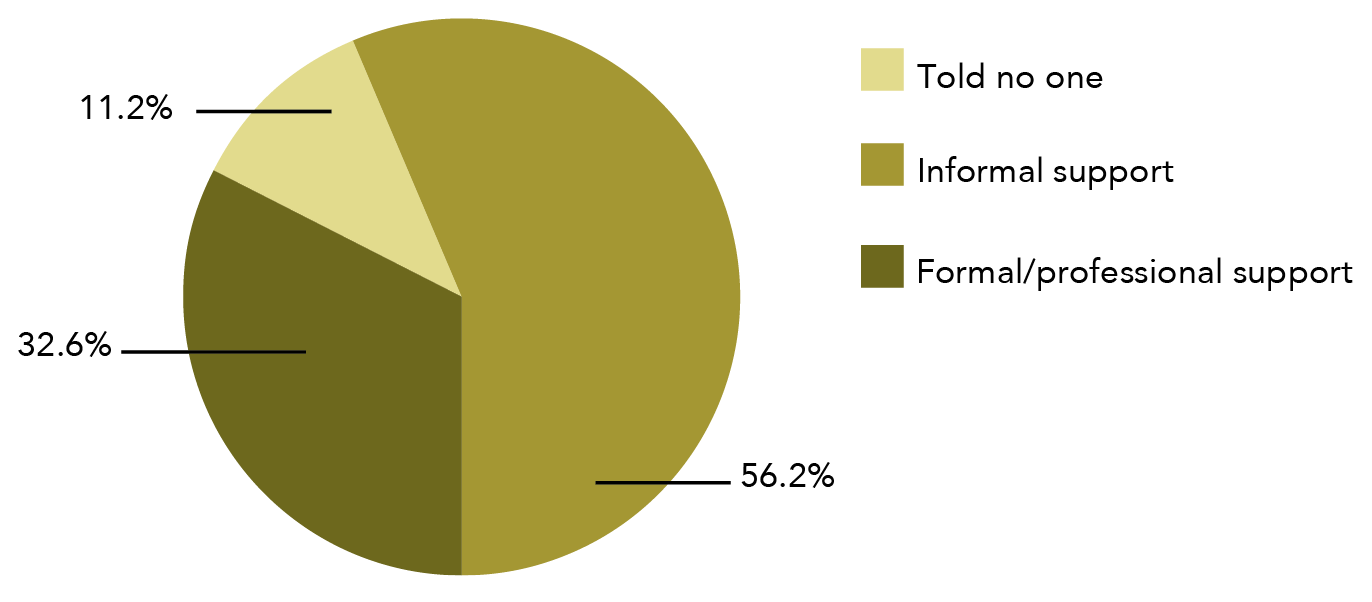
Data table for Graph AC:
First person told Percentage Told no one 11.2% Informal support 56.2% Formal/professional support 32.6%
Note: Data relates to incidents since the age of 15.
Formal support includes counsellors, police, health professional etc.
Informal support includes family members, friends etc.
4.2.2 Advice and support
 In relation to their most recent physical assault by a male cohabiting partner, 70.5% of women sought advice or support after the incident (574,100).
The percentage is not statistically different to when the MRIMP physical assault was perpetrated by:
- a stranger (151,800, 64.7%); or
- an other known male (442,700, 66.3%).
Tbl A9:E11 C11 F11
Source of advice or support
Half of women whose most recent physical assault was by a male cohabiting partner sought advice and support from a friend, family member, work colleague or minister of religion (410,800). This represents seven out of ten women who sought advice or support about this type of violence.
About one in four women sought advice from:
- a general practitioner or other health professional (196,500, 24.1%); or
- a counsellor, support worker or telephone hotline (192,400, 23.6%).
Tbl A9:E20 E15 E16
There was a similar pattern of support seeking when a physical assault was perpetrated by a cohabiting partner, stranger or other known person (see table opposite).
The table below outlines the most common sources of support by perpetrator type for a woman’s most recent incident of physical assault by a male. Women may have sought support and advice from multiple sources.
Table M: Women’s most recent incident of physical assault by a male perpetrator, sources of support: By relationship to perpetrator
Source of support Of women physically assaulted by their cohabiting partner: Of women physically assaulted by a known male other than their cohabiting partner: Of women physically assaulted by a stranger: Most common source of support
Friend/family member/work colleague/ minister of religion (410,800, 50.5%)
Friend/family member/work colleague/minister of religion (360,100, 53.9%)
Friend/family member/work colleague/minister of religion (109,200, 46.6%)
Second most common source of support
GP or health professional (196,500, 24.1%)
Counsellor, support worker or telephone hotline (101,300, 15.2%)
Police (57,300, 24.4%)
Third most common source of support
Counsellor, support worker or telephone hotline (192,400, 23.6%)
GP or health professional (91,600, 13.7%)
GP or health professional (43,600, 18.6%)
Fourth most common source of support
Police (179,600, 22.1%)
Police (12.7%, 84,700)
Counsellor, support worker or telephone hotline (24,100*, 10.3%*)
Please see Section 2: 5.2 Advice and support for detail on help seeking for women who experience partner sexual assault.
4.2.3 Advice seeking by victim demographics
In general, women who reported demographic characteristics that were typically associated with social disadvantage accessed more support and advice than women in situations generally associated with social advantage.
This trend held for both current and former cohabiting partner violence.
There were two exceptions to this:
- Employment status – for women who had experienced former cohabiting partner violence, women who were employed sought advice more often than women who were unemployed or not in the workforce; and
- Disability status – for women who had experienced former cohabiting partner violence, women who did not have a disability or long-term health condition sought advice more often than women who had a disability or long-term health condition.
It is plausible that these two exceptions may reflect the relatively greater social connectedness of women who are employed and/or do not have a disability or long-term health condition.
For all sociodemographic characteristics, the same or higher proportion of women reported accessing services for former partner violence than current partner violence.
The following information is regarding women’s seeking of advice and support in the last 12 months regarding male cohabiting partner violence.
Need more help or more willing to get help?
The analysis completed here does not help us understand why certain populations are more likely to seek help than others. We do not know, for instance, whether people access more services because the violence is more severe and they need more services, or because they are more willing to talk to people about what has happened and so access services in less severe contexts.
Looking at help seeking behaviours is not a proxy for the severity of violence – rather it only indicates the tendency of people to ask for help.
Of women who have experienced cohabiting violence:
Table N: Women who experienced male cohabiting partner violence in the last 12 months who sought advice and support about the violence: By sociodemographic characteristics
Employment Eight out of ten women who were unemployed or not in the workforce (21,000, 79.6%) sought advice or support about violence perpetrated by their current partner: this percentage goes up to nearly nine out of ten when considering women who experienced violence by a former partner (26,000*, 87.7%).
Six out of ten women who were employed (24,700, 61.9%) sought advice or support about the violence perpetrated by their current partner: this percentage goes up to more than nine out of ten (94%) of women who experienced violence by a former partner (31,600).
Post-school qualifications Six out of ten of women who did not have post-school qualifications sought advice or support about violence perpetrated by their current partner (15,200, 64%): Seven out of ten women who had post-school qualifications contacted the police about violence perpetrated by their current partner (30,500, 71.7%): this percentage goes up to nine out of ten when considering women who experienced violence by a former partner (24,200*, 91.4% for women with no post-school qualification and 33,400, 90.8%, for women with post-school qualifications).
Country of birth Seven out of ten women who were born either in Australia or overseas sought advice or support about violence perpetrated by their current partner (16,100*, or 68.8%* for women born overseas and 29,600, or 69.1%, for women born in Australia): this percentage goes up to nine out of ten when considering women who experienced violence by a former partner (10,400* or 92.2% for women born overseas and 47,200 or 90.8% for women born in Australia).
Disability Eight out of ten women who had a disability or long-term health condition (21,600, 78%) sought advice or support about violence perpetrated by their current partner: this percentage goes up to slightly more than eight out of ten when considering women who experienced violence by a former partner (19,500*, 83%).
Six out of ten women who did not have a disability or long-term health condition (24,100, 62.5%) sought advice or support about violence perpetrated by their current partner: this percentage goes up to more than nine out of ten when considering women who experienced violence by a former partner (38,100, 95.8%).
Table A28
Note: Proportions have been rounded to deciles (“out of ten”) to assist with comparisons across groups.
For further data by demographic characteristics of victims, see:
Section 3: 2: Victim characteristics.
Section 3: 4.1.4 Contact with police by victim demographics.
4.2.4 Advice seeking by extent of violence
Women were more likely to seek advice and support about violence when they had experienced more than one incident.
Current male cohabiting partner
One in two women who experienced a single incident of current male cohabiting partner violence sought advice or support about the incident (41,500, 50.2%).
Tbl A28:C10
Two out of three women who experienced more than one incident sought advice and support about the violence (103,100, 66.8%).
E10
Former male cohabiting partner
A similar pattern was seen for previous male cohabiting partner violence, with:
- two thirds of women (227,600, 67%) seeking advice or support where there had been a single incident only; and
- eight out of ten women (727,800, 79.4%) who had experienced more than one incident seeking advice or support.
C19 E19
Asking for help is not “per incident”
Survey respondents were asked whether they had ever accessed advice and support about the violence that they had experienced. This means that when we compare women who had experienced “one incident” and “more than one incident” of violence, we do not know the relative likelihood of women asking for help when that likelihood is calculated on a “per incident” basis.
Women who have experienced more violence may report more advice seeking over the course of their relationship, but this does not mean that, per incident, they access more support. For example, if a woman experienced three incidents of violence and spoke to 20 friends about it, she would have been recorded in the same way as a woman who spoke to one person about 30 incidents (or 300).
For more statistics related to extent of violence, please see:
Section 3: 1.1.4.3 Extent of violence.
Section 3: 3.2: How recently did violence occur?
Section 3: 4.2.4 Advice seeking by extent of violence.
Section 3: 4.4.2 Fear by severity of violence.
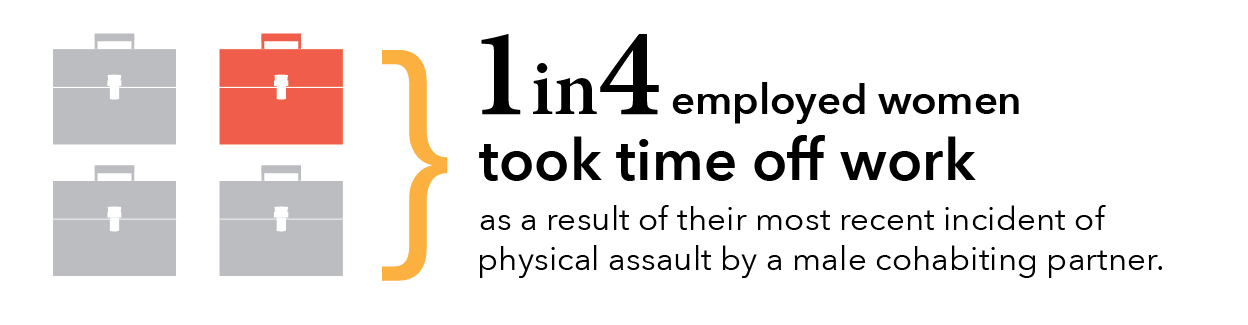
4.3 Time off work
Most employed women continued to attend work after their most recent assault by a cohabiting partner.
By violence type
Survey participants were asked if they took time off work in the 12 months after their most recent assault, where this most recent incident by a male was perpetrated by a cohabiting partner. This leave was “as a result of the incident” and not just general time off work.
145,700 women who had been physically assaulted by a male cohabiting partner, took time off work in the 12 months after the incident. This is over one in four women who were employed during this time and who had experienced this type of violence.
Tbl A6:D15
One in five (19.8%) employed women who had been sexually assaulted by a male cohabiting partner took time off as a result of their most recent assault (29,000).
D32
By perpetrator type
A greater proportion of women took time off work because of their most recent physical assault by a male cohabiting partner than after a physical assault by a stranger or other known person.
Rows 15, 32
Country of birth

A little over one in four employed women born in Australia took time off work after their most recent physical assault by a male cohabiting partner (26%). Three out of ten employed women born overseas took time off work after this type of assault (29.7%*). There is no statistically significant difference in these estimates.
Tbl A7: Additional analysis of data
See also: Section 3: 2.3 Country of birth for relevant victim demographic information.
See also: Section 3: 4.5: Separations for data related to whether women move away from their family home.
4.4 Psychological impacts
The psychological impacts of cohabiting partner violence are significant. Women who live with their perpetrator reported feeling fear and anxiety after their most recent incident of violence at a higher rate than women who experienced violence by a known male (excluding cohabiting partner) or stranger. Women reported more fear and anxiety when they experienced violence more frequently.
Being afraid of violence vs being afraid due to emotional abuse
The information in this section is about the psychological impacts of violence. This data relates to fear associated with partner violence (defined as physical and sexual violence and excluding emotional abuse). These questions are asked only of people who have experienced violence that was perpetrated by a cohabiting partner.
This section includes a different set of questions than those asked about “emotional abuse by a partner” (see 3.3. of this section). Emotional abuse is not classified as violence in the PSS and is addressed in a separate set of questions that are asked of all participants.
Graph AD: Proportion of women who experienced anxiety or fear due to previous partner violence: By how often violence occurred and how often anxiety and fear experienced
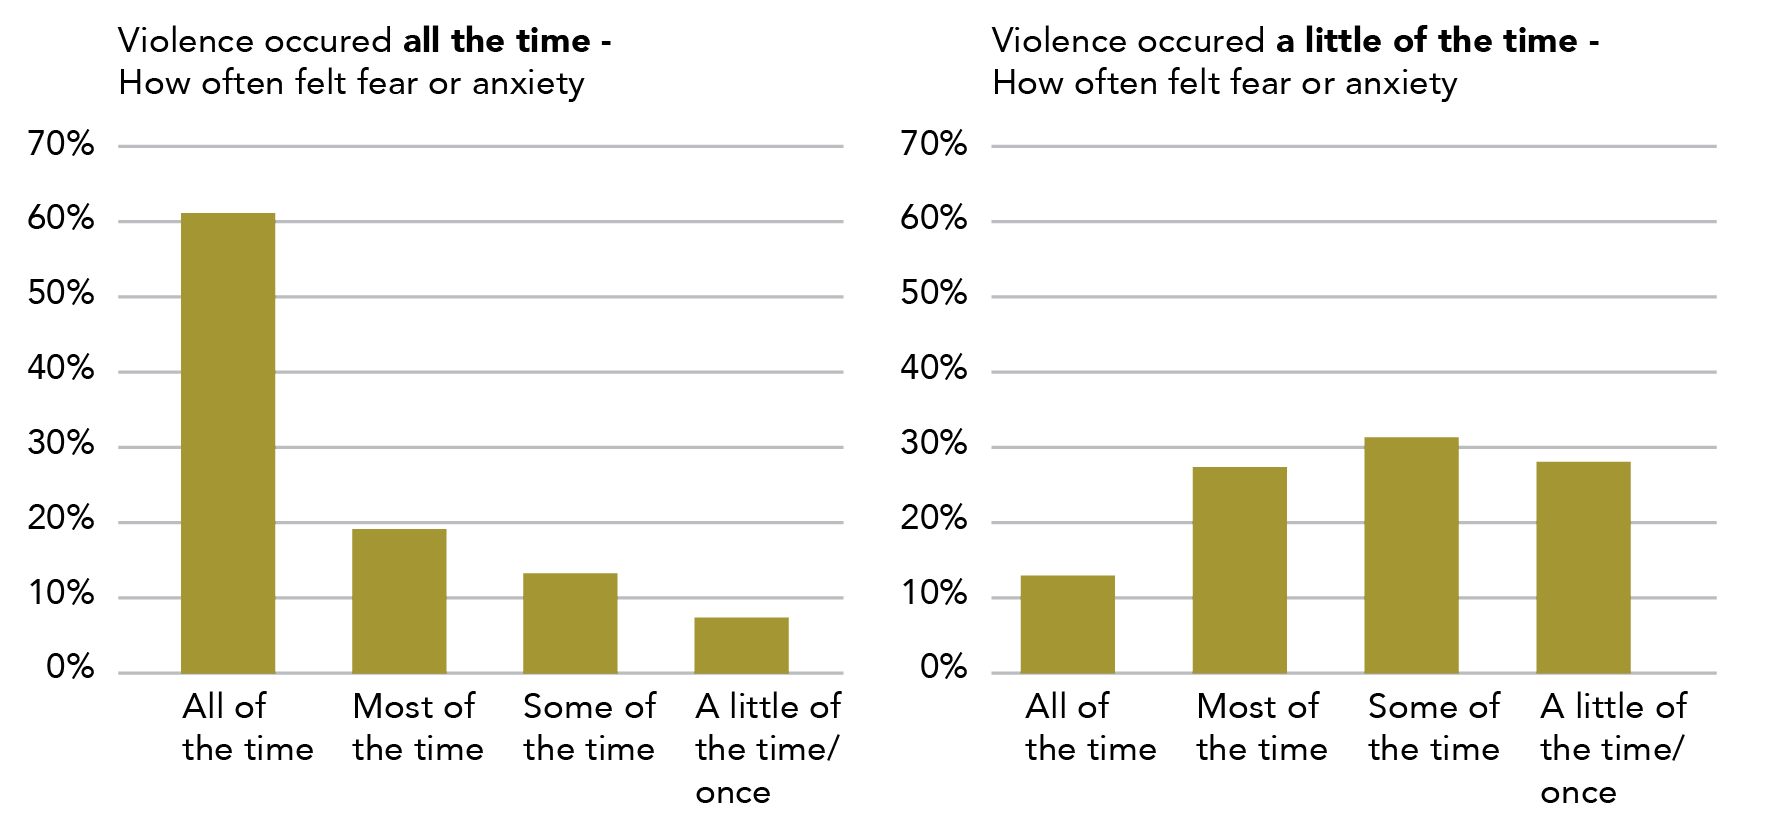
Data tables for Graph AD:
Violence occurred all the time – How often felt fear or anxiety
Frequency Percentage All of the time ~61% Most of the time ~19% Some of the time ~13% A little of the time/once ~7%
Violence occurred a little of the time – How often felt fear or anxiety
Frequency Percentage All of the time ~13% Most of the time ~27.5% Some of the time ~31.5% A little of the time/once ~28.5%
Note: Data relates to incidents since the age of 15.
4.4.1 Anxiety and fear in the 12 months after violence
Ever experienced anxiety
Seven out of ten women who had ever experienced violence by a male previous cohabiting partner reported that they had experienced anxiety or fear due to the violence: this is just over 900,000 women (71.9%).
Tbl A26:C7
Of these women who had experienced fear or anxiety, a little over half (54%) experienced fear all or most of the time: this is close to half a million women (488,500).
C12-13
Anxiety in the 12 months prior to the survey
In the 12 months prior to the survey, one out of five women who had ever experienced violence by a male previous partner reported that they felt anxiety or fear due to the violence: this is a bit over a quarter of a million women (273,500, 21.8%). Many of these women would have experienced their most recent incident of violence more than a year ago.
C19
Of these women who had experienced fear or anxiety, about four out of ten (38.2%) experienced fear all or most of the time: this was 104,500 women.
C24 – 25
4.4.2 Fear by extent of violence
The PSS asks women about how frequently they have experienced violence by a previous cohabiting partner. The survey also asks how often they have felt anxiety or fear due to violence. When these two answers are cross-tabulated, we can see the relationship between the frequency of violence and the amount of fear that women experience.
Women who had experienced more frequent violence also experienced more frequent fear or anxiety.
Sometimes it only takes the threat of harm
Some women experience extreme anxiety in contexts where physical harm is rare or has never occurred. For these women, sustained patterns of coercive control and threat may create contexts of intense fear.
Of women who had experienced violence by their previous cohabiting male partner all of the time:
- Eight out of ten experienced fear or anxiety all or most of the time (67,300, 80.2%), of which six out of ten had experienced fear all of the time (51,300, 61.1%).
- One in 14 experienced fear only a little of the time or once only (6,000*, 7.1%*).
Tbl A27:B9, D9, H9
One in eight women who experienced infrequent violence (a little of the time or once only) experienced anxiety all of the time (38,000, 12.9%).
C12
Violence is not always scary
It may initially seem strange that one in 14 women experienced violence all of the time and yet they did not feel much fear about it. There are a range of reasons that this might be the case, including that the violence has become normalised or familiar. Some women may be engaged in bi-directional violence, where both partners are aggressive and where these physical arguments are part of the dynamic of the relationship. These fights, which do not have the elements of coercive control associated with domestic violence, may not be reported as frightening or experienced as abusive.
For more statistics related to extent of violence, please see:
Section 3: 1.1.4.3 Extent of violence.
Section 3: 3.2 How recently did violence occur?
Section 3: 4.1.5 Contact with police by extent of violence.
Section 3: 4.2.4 Advice seeking by extent of violence.
4.4.3 Fear and anxiety by type of violence
 Where a woman’s most recent incident of violence was perpetrated by a male cohabiting partner, women reported that they experienced anxiety or fear for their personal safety in:
- Two thirds of incidents of physical assault (538,000, 66.1%); and
- Three quarters of cases of sexual assault (185,100, 74%), physical threat (158,300, 73%) and sexual threat (32,700, 74.9%).
Tbl A6:E11, E28, E22, E39
 The difference between the rate of fear and anxiety for women who experienced physical assault and those who experienced sexual assault or physical threat was statistically significant.
4.4.4 Fear and anxiety by type of perpetrator
Women were most likely to experience fear and anxiety after their most recent incident of violence if that violence was perpetrated by a male cohabiting partner (when compared to incidents perpetrated by male strangers or known males). This trend is seen for all types of violence identified in the PSS (physical assault, physical threat, sexual assault and sexual threat).
Tbl A6: Rows 11, 22, 28, 39
Graph AE: Proportion of women experiencing anxiety or fear after the most recent incident of violence by a male perpetrator: By violence type and perpetrator type
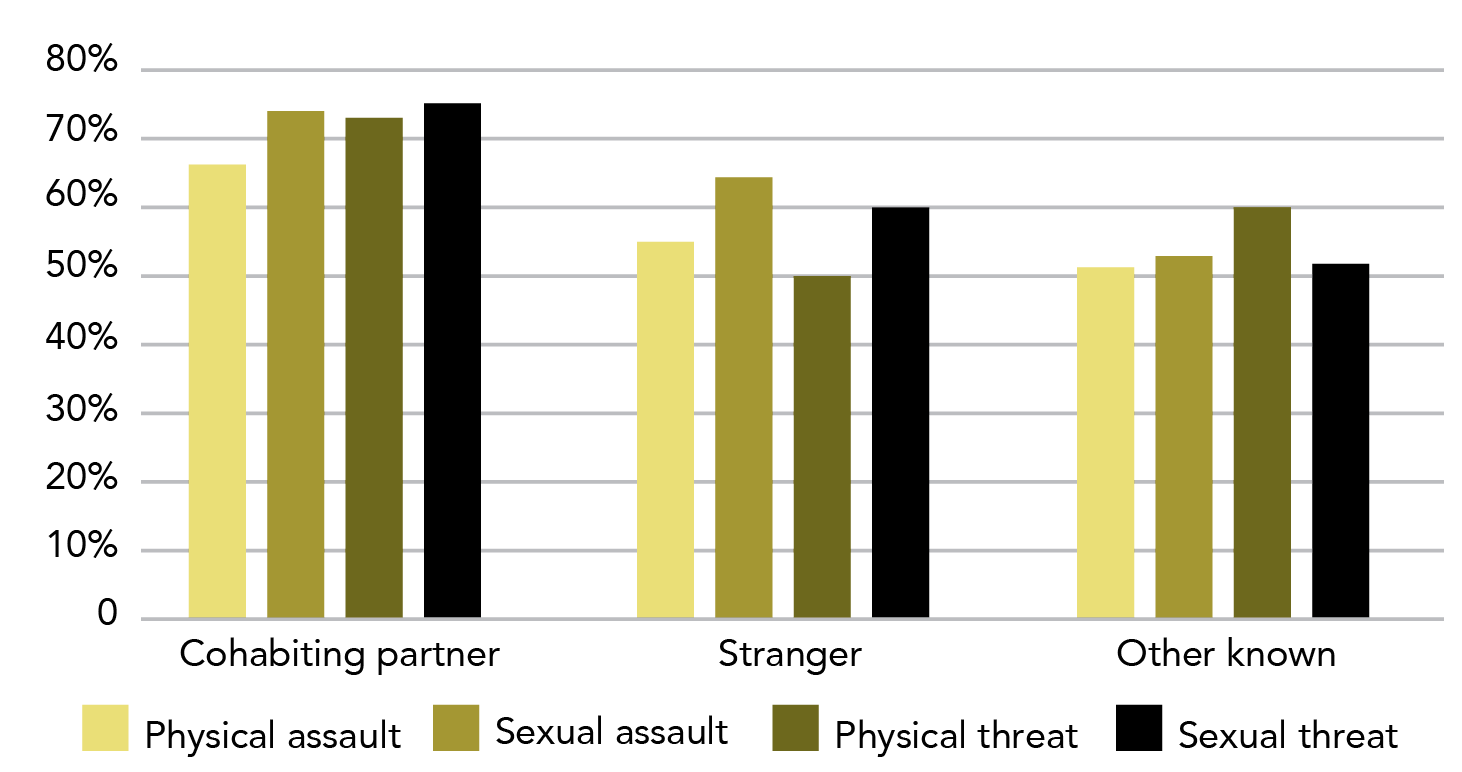
Data tables for Graph AE:
Perpetrator type Physical assault Sexual assault Physical threat Sexual threat Cohabiting partner 66.1% 74% 73% 74.9% Stranger 54.8% 64.2% 50% 59.5% Other known 51.1% 52.6% 59.9% 51.5%
Note: Data relates to incidents since the age of 15.
Table O: Proportion (estimate) of women experiencing anxiety or fear after the most recent incident: By violence type and perpetrator type
Most recent incident of physical assault by a: Proportion (estimate) of women reporting anxiety or fear after incident Cohabiting partner
66.1% (538,000) Stranger
54.8% (128,400) Other known person
51.1% (341,500)
Most recent incident of sexual assault by a: Proportion (estimate) of women reporting anxiety or fear after incident Cohabiting partner
74% (185,100) Stranger
64.2% (86,200) Other known person
52.6% (246,300)
Most recent incident of physical threat by a: Proportion (estimate) of women reporting anxiety or fear after incident Cohabiting partner
73% (158,300) Other known person
59.9% (160,800) Stranger
50% (109,000)
Most recent incident of sexual threat by a: Proportion (estimate) of women reporting anxiety or fear after incident Cohabiting partner
74.9% (32,700) Stranger
59.5% (49,400*) Other known person
51.5% (55,600)
Note: Limited to male perpetrators
4.4.5 Changes in routine due to fear and anxiety
Two thirds of women had changes in routine due to their fear or anxiety as a result of former male cohabiting partner violence. The following were the most common changes in routine:
- sleeping habits (103,000, 37.7%);
- social/leisure activities (97,900, 35.8%); and
- building or maintaining relationships (83,000, 30.3%).
Tbl A26:C39 C31 C37
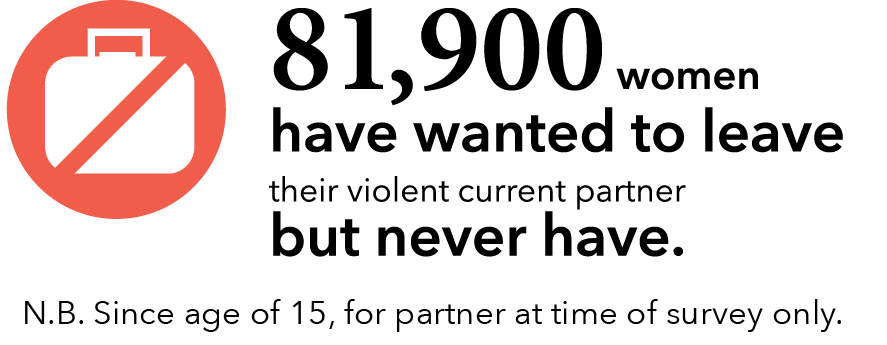
4.5 Separation
About half of women who are no longer in a relationship with their violent partner reported that they separated several times prior to the final separation.
Women returned to violent relationships for a range of reasons, with the three most common being that the partner promised to stop assaults, threats or abuse; commitment to relationship; and, for the sake of the children. About half of women who reported experiencing violence from their cohabiting partner indicated that the violence was the main reason for their separation (regardless of if it was a temporary or final separation). A quarter of women reported that the violence increased after their final separation.
4.5.1 Temporary separations from a current partner
149,200 women who experienced violence by their current partner had never separated from their current partner. Just over half of these women (81,900, 54.9%) wanted to leave their current partner but never had.
Tbl 29: B66 C63
In the remainder of this section, similar data is presented for temporary separation from current partner (4.5.1), temporary separation prior to final separation (4.5.2) and final separation from former partner (4.5.4). As different populations are used throughout this section, care should be taken when making comparisons across these groups.
Temporarily separated
87,900 women who had experienced violence in their current relationship had temporarily separated from their current cohabiting partner. This is 37.1% of women who were currently in a relationship that had involved at least one incident of violence. The vast majority (75,100, 85.4%) of these women did not experience violence while separated.
B34 C34 B42
Moved away
Approximately half the women who separated from their partner moved out of their home (45,600, 51.9%). Of these women, three quarters stayed at a friend or relative’s house (35,000, 76.8%).
B48 B55
Experienced violence
12,800* women experienced violence while temporarily separated from their current partner.
B41
Oh, that makes sense…
A current partner is someone the respondent is still in a relationship with. This means that any separation that they have experienced with their current partner must have been temporary.
Warning – definition change ahead
This section relates to male cohabiting partners only.
4.5.2 Temporary separations prior to final separation from former male partner
A most recently violent previous male partner? Are all those words really necessary?
In the detailed partner module, the PSS only asks about a person’s most recently violent previous partner. This means that if they had experienced violence by more than one previous partner, only data about the most recently violent partner is collected. Thus, the data below should not be considered a representation of separation patterns for all separations from violent previous partners.
Temporarily separated
Of women who are no longer in a relationship with their most recently violent previous male cohabiting partner, half had temporarily separated at least once prior to the final break up (594,200, 50.1%).
Tbl A24:C7
Of women who had temporarily separated from a violent former partner:
- a third had one temporary separation (199,800, 33.6%);
- a third separated two or three times (206,000, 34.7%); and
- a third separated more than three times (188,000, 31.6%).
C12 C13-14 C15
Violence while separated
Two out of five women experienced violence while temporarily separated from their violent former male cohabiting partner (242,100, 40.7%).
C19
Six out of ten women who experienced violence while temporarily separated reported an increase in violence during the separation (138,200):
- 76,500 women had experienced an increase in violence during a temporary separation: this is one in three women who experienced violence while temporarily separated from a male previous partner;
- An additional 61,300 women had experienced violence for the first time during the temporary separation: this is one in four women who had experienced violence while temporarily separated from a male previous partner.
Aditional analysis, B29, B24
Graph AF: Women who had temporary separations from their most recently violent previous male cohabiting partner: Number of temporary separations prior to final separation
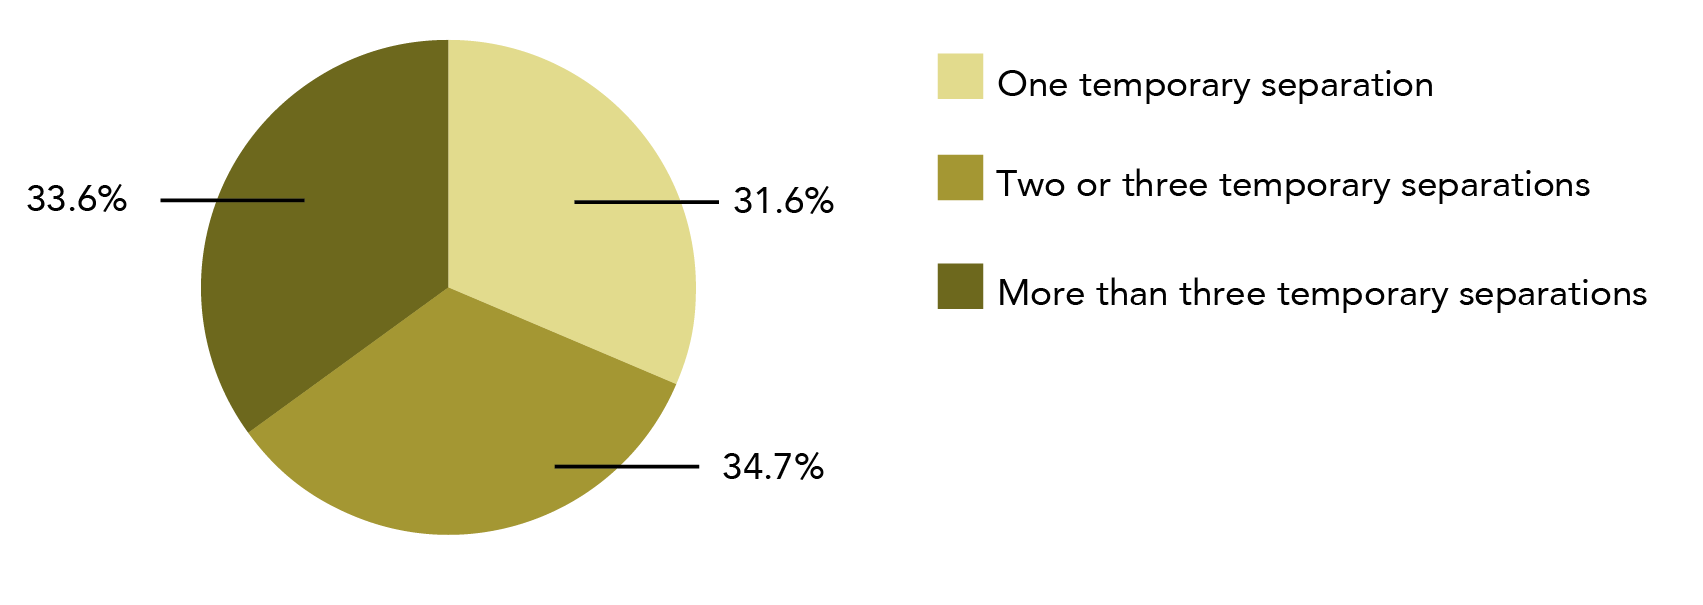
Data table for Graph AF:
Number of temporary separations prior to final separation Percentage One temporary separation 31.6% Two or three temporary separations 34.7% More than three temporary separations 33.6%
Note: Data relates to incidents since the age of 15. Does not add to 100% due to rounding.
Moved away
Two thirds of women who had temporarily separated from their most recently violent previous male cohabiting partner, had moved away from their home during the temporary separation (378,300, 63.7%).
Tbl A24:C34
When women could list all the places that they stayed during temporary separations:
- Four out of five women said they stayed with a friend or family member (301,700, 79.7%);
- Three out of ten (103,500, 27.4%) said they relocated to a new house or rental property;
- One in seven stayed at a shelter or refuge (54, 600, 14.4%); and
- One in 12 slept rough, such as on the street, in a car, in a tent or squatted in an abandoned building (30,600, 8.1%).
C39 C43 C40 C42
Looking similar but not the same
The ABS has published data on separations on its website. Table 30 looks similar to the data represented here, but the numbers are slightly different. The reason for the difference is that we are limited to male cohabiting partners, while the previous ABS tables include both male and female cohabiting partners.
4.5.3 Reasons for returning to partner
Common reasons for returning
Women reported the same top three reasons for returning to a violent male partner, regardless of whether or not they were permanently separated from their partner at the time of the survey. When women could give multiple answers, the most common reasons were:
- partner promised to stop assaults, threats or abuse;
- commitment to relationship; and
- sake of the children.
The order of these priorities varied depending on whether the woman was describing returning to:
- a partner they were still with at the time of the survey (current cohabiting partner); or
- a partner they were no longer in a relationship with (former cohabiting partner).
Women returning to a current cohabiting partner were most likely to say that commitment to the relationship was a reason for returning to the relationship (40,900, 46.5%).
Tbl A25: C22
In contrast, the most common reason for returning to a former partner was the partner’s promise to stop the assaults, threats or abuse (267,800, 45.1%).
Tbl A24: C48
Graph AG: Proportion of women who experienced male cohabiting partner violence, top three reasons for returning to partner after temporary separation: By partner type
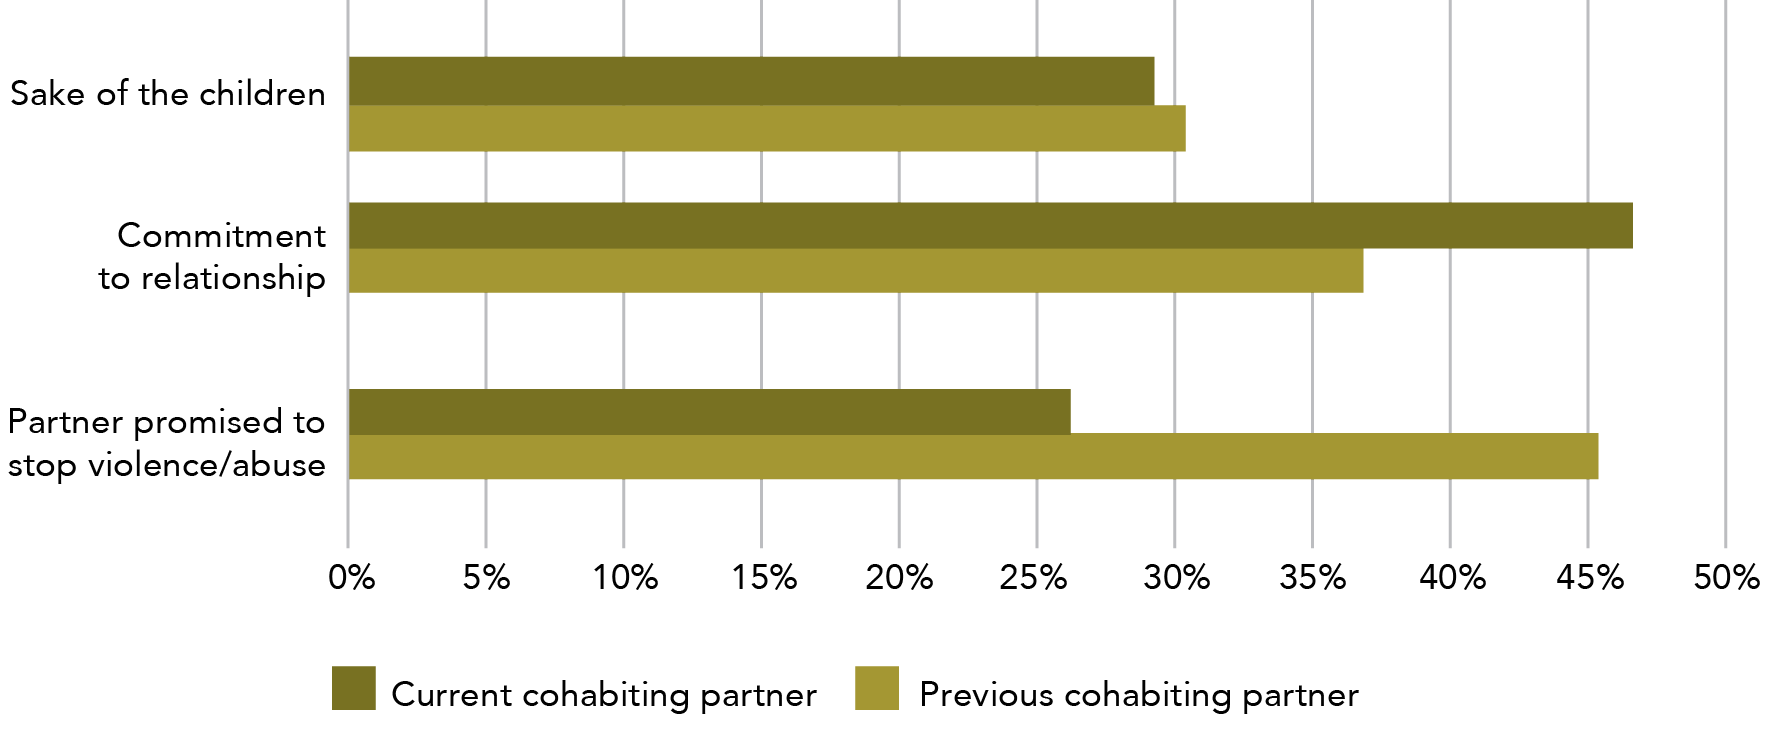
Data table for Graph AG:
Reason for returning to partner after temporary separation Current cohabiting partner Previous cohabiting partner Sake of the children ~29.1% ~30.3% Commitment to relationship ~46.5% ~36.7~ Partner promised to stop violence/abuse ~26% ~45.1%
Note: Respondents could nominate more than one reason for returning. Data relates to incidents since the age of 15.
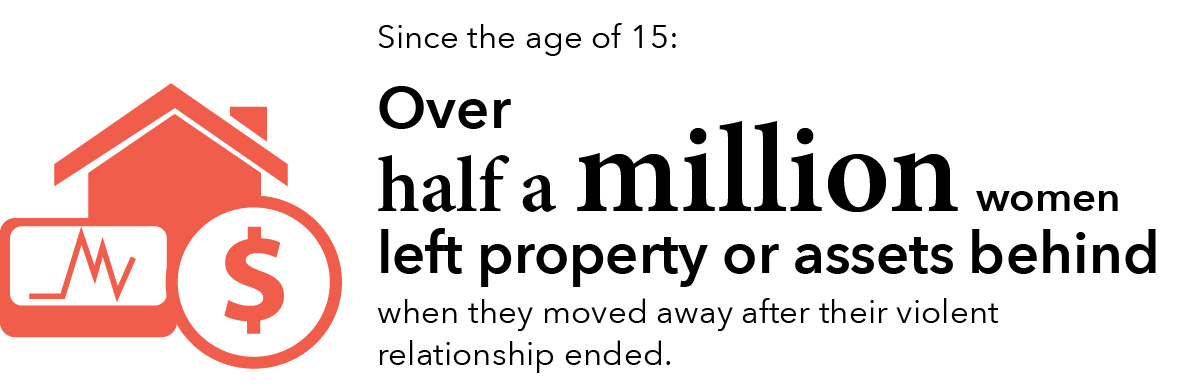
Uncommon reasons for returning
There are a number of less common reasons given for women returning to their violent cohabiting partner.
When women could give multiple answers, and of women who had temporarily separated from a violent previous male partner:
- one in eight said they returned because they had no money/financial support (70,800, 11.9%);
- one in 12 said they returned because they had nowhere to go (51,500, 8.7%);
- one in 14 said they returned because of shame or embarrassment (41,000, 6.9%); and
- one in eight said they returned because of fear of their partner (71,600, 12%).
Tbl A24:C49, C50, C52, C53
The characteristics were similar for temporary and final separations from a former violent cohabiting partner.
4.5.4 Final separation from former partner
Violence after final separation
For a quarter of the women who had experienced violence in their relationship with a male, the violence increased after the final separation (217,500, 24.4%).
Tbl A24:C69
Moved away
Consistent with temporary separations, two out of three women moved away from their homes at the end of their relationship with a violent male cohabiting partner (731,900, 61.8%). Two thirds of these women stayed with friends or family (464,600, 63.5%). However, unlike temporary separations, 42.6% (311,900) relocated to a new home (including a rental property).
C74, C79, C83
Less stable accommodation may have been experienced by some women, including those who stayed at:
- a refuge or shelter (57,000, 7.8%);
- motel, hotel, boarding house etc. (45,500, 6.2%); and
- slept rough (on street, in car, squatted etc.) (12,100*, 1.7%*).
C80, C81, C82
Loss of assets
Over half a million women left property or assets behind when they left the relationship with their most recent violent previous partner: this is seven out of ten women who experienced violence in a previous relationship.
C88
This isn’t adding up?
Women were asked about all the types of accommodation that they used after their separation, and could select all the types that applied to them. This is why the types of accommodation add up to more than 100%.
4.5.5 Reasons for last separation
The PSS asks women for the main reason for their most recent separation from a violent partner. In this question, the respondent is only able to give one answer, meaning that the total is 100%.
Regardless of whether the woman ultimately returned to her partner or not, about half of the women said that the main reason for leaving was their partner’s assaults, threat or abuse towards themselves or their children.
One in eight women who had permanently separated from a violent previous partner gave “better life for children” as their main reason for leaving (152,700, 12.9%). One in 20 women who had temporarily separated from their current partner gave this reason (4,600*, 5.2%*).
One in 14 women who had permanently separated from a violent previous partner said that their partner initiated the separation (and gave this as the main reason for separation) (85,900, 7.2%). One in nine women who had temporarily separated from their current partner gave this reason (9,900*, 11.2%*).
Tbl A24: C59, Tbl A25: C12, Tbl A24: C60, Tbl A25: C13, Tbl A24: C62, Tbl A25: C14,
The nature of cohabiting partner violence, including the practical realities of living with the perpetrator, make the impacts of this form of violence potentially more complex than the impacts of violence committed by people with a different type of relationship to the victim. The PSS highlights the high number of women who experience fear in their cohabiting violent relationships, while simultaneously noting the relatively low rate of contact with police. A large number of women do not want to leave their violent partners, but when they do, they often have several temporary separations prior to the final breakup.
In the following section we examine data related to women’s experiences of multiple victimisations. This analysis includes repeat victimisation in adulthood, as well as victimisation as both a child and an adult.
Section four: Women’s experience of multiple victimisation
Women may experience multiple violent incidents across their life span. This can happen in a number of ways, such as when a women experiences:
- violence both as a child and as an adult;
- different types of violence as an adult;
- the same type of violence perpetrated by different people; or
- multiple incidents of a single violence type (perpetrated by either one person or multiple people).
The PSS provides rich data on multiple victimisation, however it can be complex to distinguish between data sets. For this reason, we have included a description of the study population before each section of data.
Due to the increased complexity of the data, this section of the report is organised differently to the other three data sections. High level prevalence information has been repeated across this section to help the reader be clear where sub-populations are being drawn from.
Contents for this section
1 Multiple victimisation as an adult
1.1 Sexual and physical violence
1.2.1 Multiple incidents of sexual violence
1.2.2 Same or different perpetrator of multiple incidents
1.3.1 Multiple incidents of physical violence
1.3.2 Same or different perpetrator of multiple incidents
1.4.1 Multiple incidents of violence
1.4.2 Victim demographics for all women who had experienced multiple adult victimisations
1.4.2.2 State or territory of residence
2 Victimisation as both a child and adult
2.1.1 Sexual violence perpetrated against an adult
2.1.2 Sexual abuse perpetrated against a child
2.2.1 Physical violence perpetrated against an adult
2.2.2 Physical abuse perpetrated against a child
3 Multiple victimisation as a child

1 Multiple victimisation as an adult
1.1 Sexual and physical violence
The majority of women who had experienced sexual violence had also experienced physical violence.
1.1.1 Since the age of 15
Physical violence and sexual violence
Since the age of 15, 1,141,600 women had experienced both physical violence and sexual violence. This is:
- 38% of women who had experienced physical violence;
- 67.3% of women who had experienced sexual violence; and
- 13% of all women in Australia
Tbl A35: N18
When we narrow to instances of assault only, 944,200 women had experienced both sexual and physical assault. This is:
- 36.2% women who had experienced physical assault;
- 63.2% of women who had experienced sexual assault; and
- 10.8% of all women in Australia.
B10
1.1.2 In the last 12 months
Physical violence and sexual violence
In the 12 months prior to completing the survey, 38,300 women had experienced both physical violence and sexual violence. This is:
- 9.5% of women who had experienced physical violence in the last 12 months; and
- 37.4% of women who had experienced sexual violence in the last 12 months.
Tbl A35: N30 O30
When we narrow to instances of assault only, 29,100 women had experienced both sexual and physical assault. This is:
- 11% of women who had experienced physical assault in the last 12 months; and
- 33.1% of women who had experienced sexual assault in the last 12 months.
B22 C22
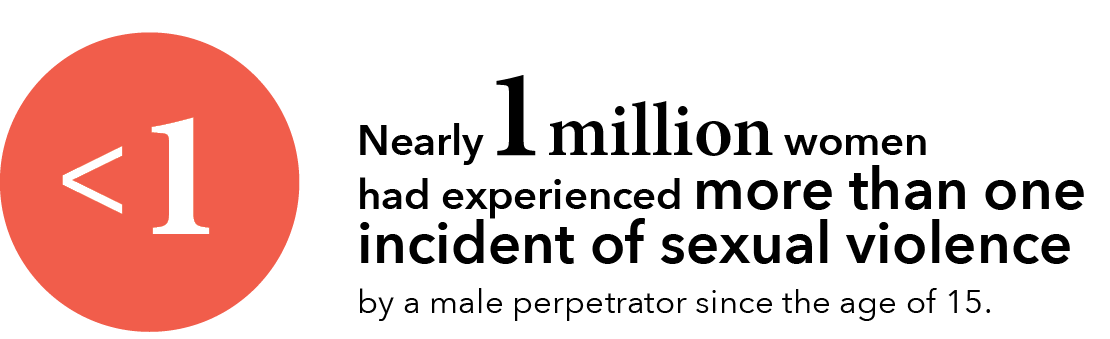
Graph AH : Women who experienced both sexual and physical violence as a number and proportion of all victims: By violence type
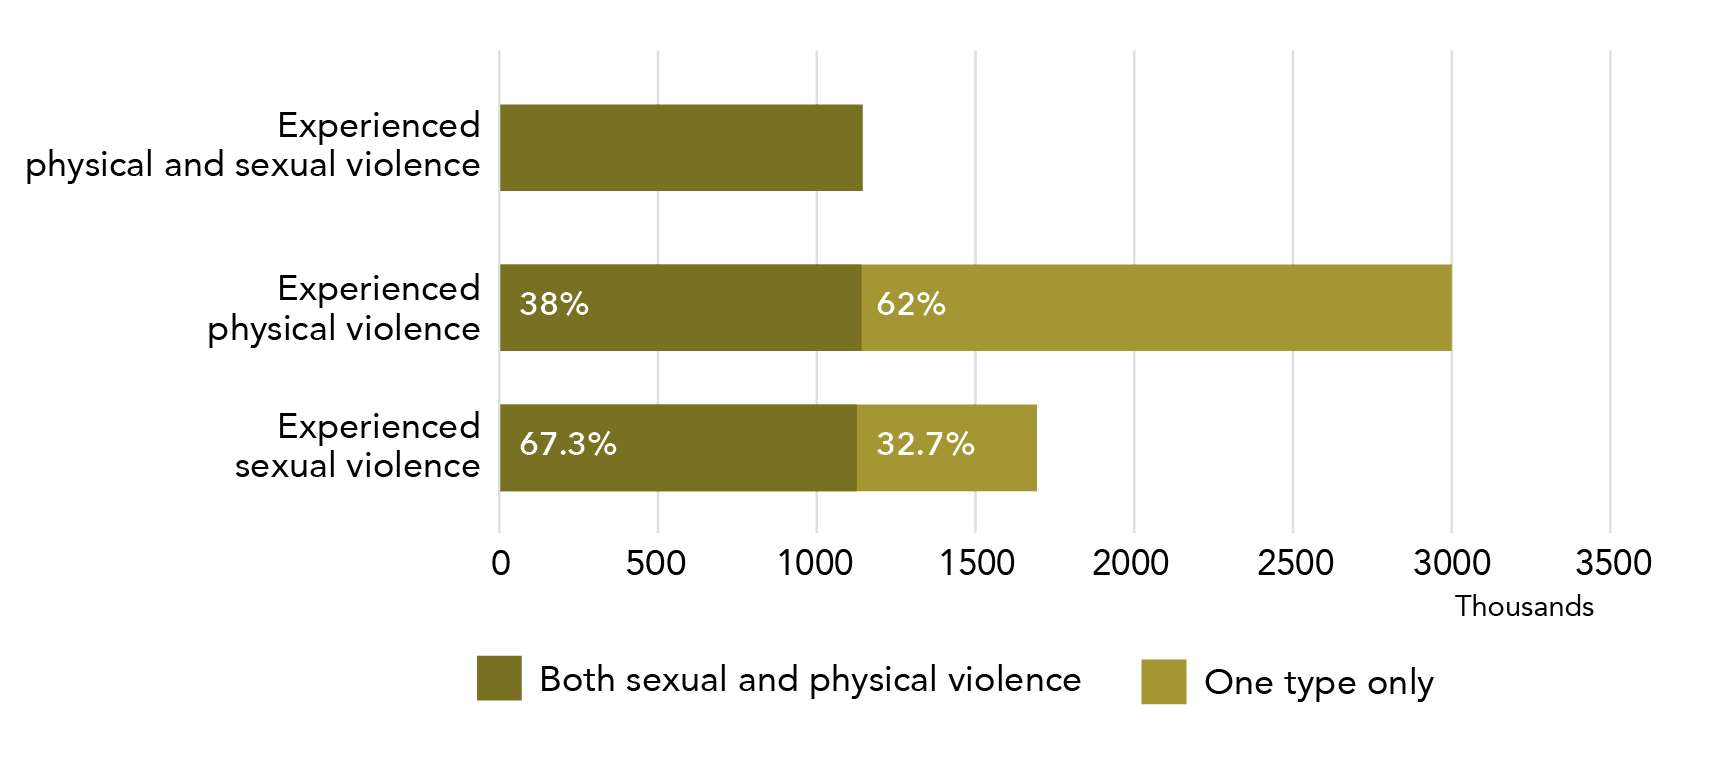
Data table for Graph AH:
Violence type Both sexual and physical violence One type only Experienced physical and sexual violence 1,141,600 – Experienced physical violence 38% 62% Experienced sexual violence 67.3% 32.7%
Note: Data relates to incidents since the age of 15.
1.2 Sexual violence
Since the age of 15, close to 1 million women have experienced multiple incidents of sexual violence. The majority of women reported that the incidents were perpetrated by different men.
In this section, we are looking at the following scenario:
Women who have experienced more than one incident of sexual violence as an adult.
Please note: in this section, a woman who had experienced one incident of sexual assault and one incident of physical assault would not be counted as having experienced more than one incident.
This section is limited to male perpetrators.
1.2.1 Multiple incidents of sexual violence
944,000 women had experienced more than one incident of sexual violence by a male perpetrator since the age of 15.
Tbl A33: L31
This is:
- 56.1% of women who had experienced sexual violence; and
- 10.8% of all women in Australia;
M31
Warning – definition change ahead!
The data on the next page relates to sexual assault only (the data in Section 1.2.1 above relates to sexual violence – sexual assault and/or threat).
1.2.2 Same or different perpetrator of multiple incidents
The majority of women who experienced multiple incidents of sexual assault reported that the violence was perpetrated by different men (515,800).
Tbl A34: F31
Of women who had experienced multiple incidents of sexual assault by a male perpetrator (839,400):
- More than one third reported that these incidents were all perpetrated by the same man (323,600).
- Two thirds reported that the incidents were perpetrated by different men. This is:
- 515,800 women; and
- one in 17 women in Australia.
F32, F30, F31
Country of birth
A small amount of analysis was possible by demographic characteristics of the female victim.

There was no statistically significant difference in the rate of multiple incident sexual assault victimisation for women born in Australian (648,600, 56.2%) as compared to women born overseas (190,900, 57.8%).
Tbl A33:H11 H26
A percentage of whom?
The percentages in the paragraph above relate to the total number of women who had experienced sexual assault and were born in the relevant countries. Thus, they should read: 56.2% of women who were born in Australia and had experienced sexual assault reported that they had experienced more than one assault.
A small number of women have experienced a single scenario of violence that involved multiple perpetrators (e.g. a gang rape). This would be classified in the survey as multiple incidents by multiple persons.
1.3 Physical violence
1.7 million women have experienced multiple incidents of physical violence by a male perpetrator, with the majority of these women reporting that all incidents were perpetrated by the same man.
In this section, we are looking at the following scenario:
The data reported in this section relates to women who have experienced more than one incident of physical violence as an adult.
Please note: in this section, a woman who had experienced one incident of sexual assault and one incident of physical assault would not be counted as having experienced more than one incident.
This section is limited to male perpetrators.
1.3.1 Multiple incidents of physical violence
1,747,400 women had experienced more than one incident of physical violence by a male perpetrator since the age of 15.
Tbl A33: F31
This is:
- 63.5% of women who had experienced physical violence; and
- one in five women in Australia (20%).
G31

1.3.2 Same or different perpetrator of multiple incidents
The majority of women who had experienced multiple incidents of physical assault reported that the violence was perpetrated by the same man.
Of women who had experienced multiple incidents of physical assault by a male perpetrator (1,453,100):
- Two thirds reported that these incidents were all perpetrated by the same man. This is:
- 961,500 women; and
- One in nine women in Australia.
- One third reported that the incidents were perpetrated by different men (491,600).
Tbl A34:B32, B30, B31
By country of birth

There was no statistically significant difference in the rate of multiple incident physical assault victimisation for women born in Australia (1,107,200, 61.9%) as compared to women born overseas (345,900, 57.1%).
Tbl A33:B11, B26
Graph AI: Number of women who experienced multiple incidents of violence by a male perpetrator: By same or different perpetrator
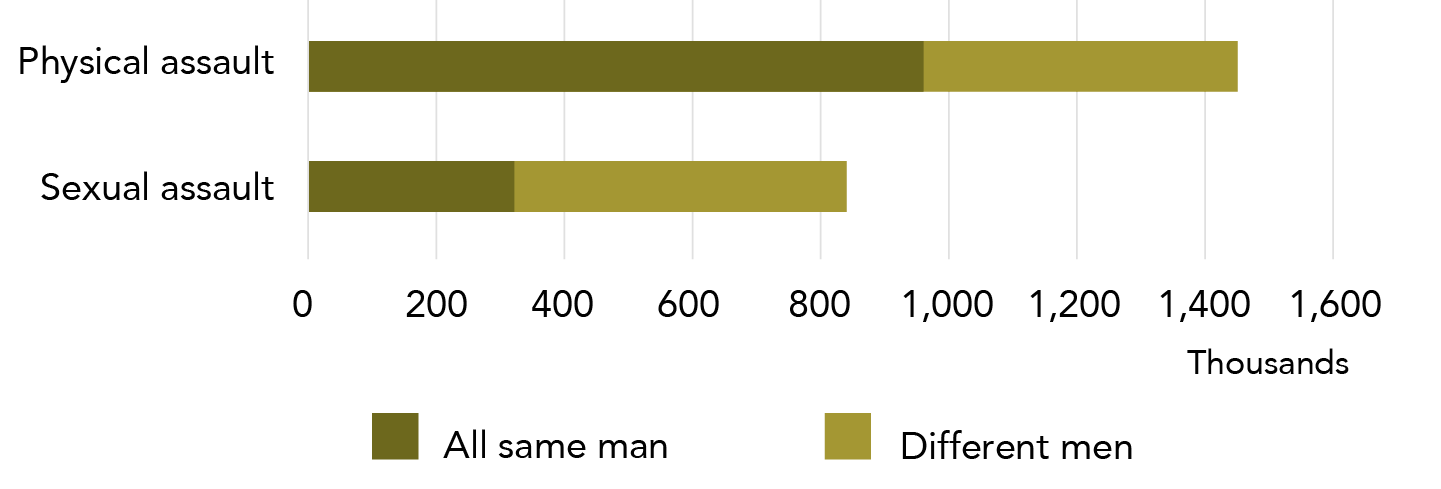
Data table for Graph AI:
Assault type All same man Different men Physical assault 961,500 491,600 Sexual assault 323,600 515,800
Note: Data relates to incidents since the age of 15.
1.4 All violence
Since the age of 15, one quarter of all women in Australia have experienced more than one incident of violence.
1.4.1 Multiple incidents of violence
In this section, we are looking at the following scenario:
Women who have experienced more than one incident of any type of violence as an adult.
Please note:
- This section is limited to male perpetrators.
- Women in this section may have experienced multiple incidents of sexual violence or physical violence or both.
Since the age of 15, almost 2.3 million women have experienced more than one incident of violence by a male perpetrator. This represents:
- two thirds of women who had experienced violence by a male perpetrator as an adult (67.8%); and
- one in four women in Australia (26%).
Tbl A33: N31 O31
1.4.2 Victim demographics for all women who had experienced multiple adult victimisations
Four out of five women who had experienced violence by a male perpetrator in the year prior to the survey reported having experienced more than one incident of violence. Women older than 35 years, with a disability and of lower socio-economic status reported an increased rate of repeat victimisation in the year prior to the survey.
In this section, we are looking at:
The demographic characteristics of women who have experienced more than one incident of violence as an adult.
Please note:
- This section is limited to male perpetrators.
- Women may have experienced their incidents of violence across violence types.
- In this section, a woman who had experienced one incident of sexual assault and one incident of physical threat would be counted as having experienced more than one incident of violence.
- Percentages in this section are a subset of the population of women who have experienced violence – they are not a subset of all women in Australia.
What is the national rate?
Of women in Australia who have experienced violence by a male perpetrator in the last 12 months, 81.1% had experienced more than one incident. This is 307,900 women.
Graph AJ : Women who had experienced violence by a male perpetrator in the last 12 months, proportion who experienced multiple incidents: By sociodemographic characteristics
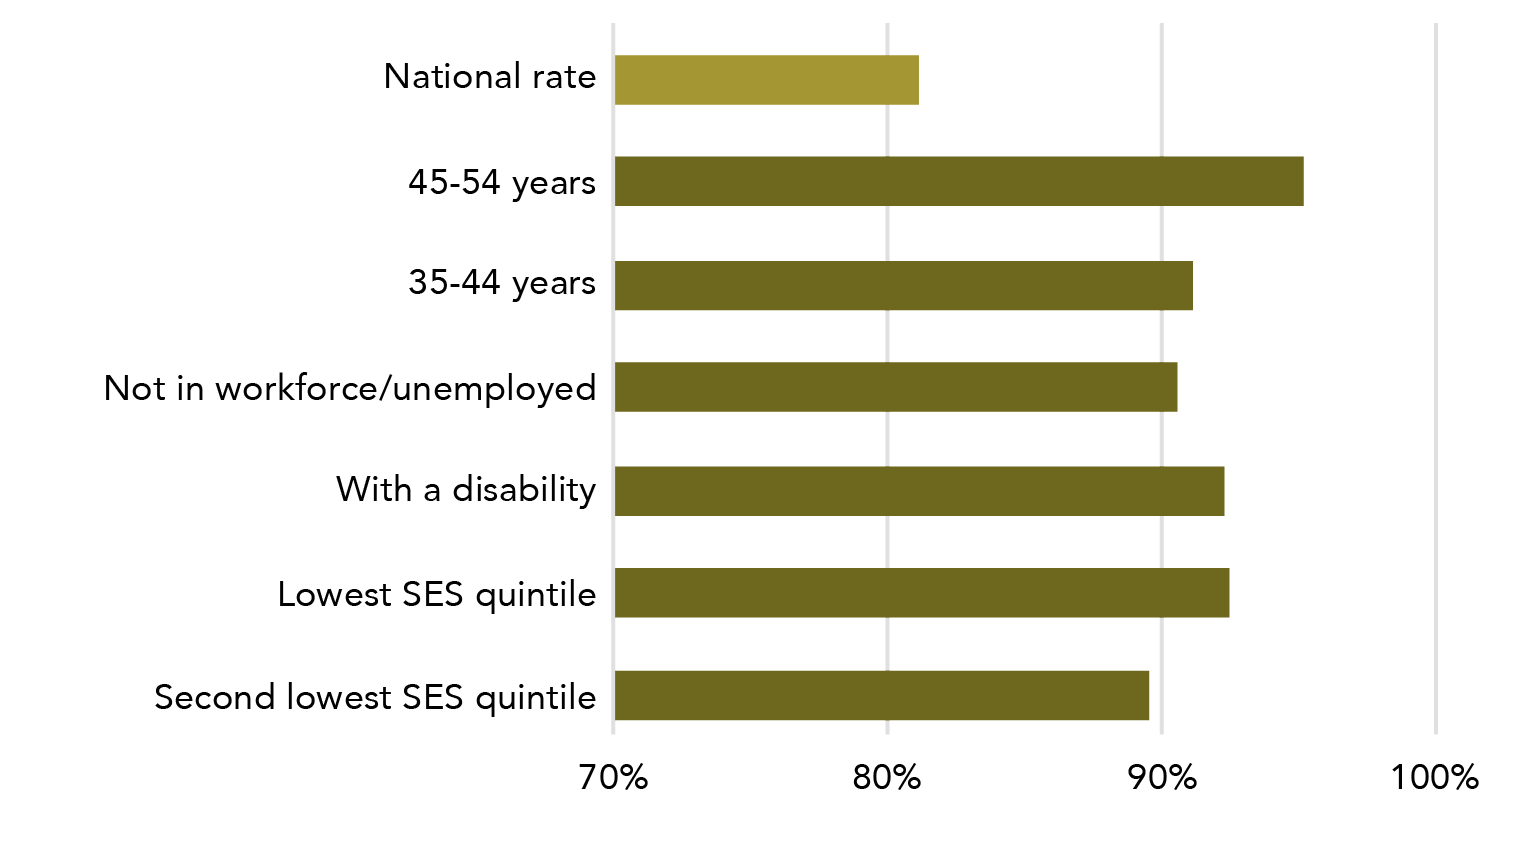
Data table for Graph AJ:
Sociodemographic characteristic Percentage National rate ~81% 45-54 years ~95% 35-44 years ~91% Not in workforce/unemployed ~90.5% With a disability ~92.5% Lowest SES quintile ~92.5% Second lowest SES quintile ~89.5%
1.4.2.1 Broad age groups
The rate of repeated victimisation in adulthood varied significantly with age. When compared to the national average, women aged 35-54 years were at increased risk of having experienced multiple incidents of violence by a male perpetrator in the year before the survey. (This difference does not reflect the relative age of the women, as the data is for a constant time period – namely the 12 months prior to the survey).
Tbl A32:E21, E22
Of women who had experienced violence, 95.1% of women aged 45-54 years, and 91.1% of women aged 35-44 years had experienced more than one incident in the 12 months prior to the survey.
E22 E21
 The difference between the rates for women aged 35-44 years and 45-54 years and the national rate was statistically significant.
1.4.2.2 State or territory of residence
 Rates of women reporting multiple incidents of violence by a male perpetrator during the 12 months prior to the survey varied significantly between jurisdictions.
In comparison to the national average, and as a proportion of all women who had experienced at least one incident of violence by a male perpetrator:
- NSW had a smaller proportion of women who had experienced multiple incidents of violence (70,500, 65.5%).
- Victoria had a higher proportion of women who had experienced multiple incidents of violence (90,300, 94.7%).
Tbl A32:E9, E10
1.4.2.3 Country of birth

When we compared women born in Australia and overseas, there was no statistically significant variation in the proportion of women who had experienced more than one incident of violence by a male perpetrator in the 12 months prior to the survey.
Tbl A32:E34-37
1.4.2.4 Labour force
 In comparison to the national average, women who were unemployed or not in the workforce were more likely to experience multiple incidents of violence by a male perpetrator.
Of women who had experienced violence by a male perpetrator in the year prior to the survey:
- 76.7% of employed women had experienced more than one incident of violence.
- 90.5% of women who were unemployed or not in the workforce had experienced more than one incident of violence.
Tbl A32:E26 E27
Information on the definition of labour force is in Section 2: 2.4 Labour force participation.
1.4.2.5 Level of education

There was no statistically significant difference between women who have (78.4%) and have not (86.7%) completed a post-school qualification, when looking at women who experienced more than one incident of violence by a male perpetrator in the 12 month prior to the survey.
Tbl A32:E31, E30
1.4.2.6 Disability status

Of women with a disability who had experienced violence by a male perpetrator in the year prior to the survey, 92.2% had experienced more than one incident. This is statistically significantly higher than the national average.
Tbl A32:E54
Information on the definition of disability is in Section 2: 2.6: Disability status.
1.4.2.7 Socio-economic status

Compared to the national rate, women whose household incomes were in the bottom 40% were more likely to experience more than one incident of violence by a male perpetrator (92.4% for lowest quintile, 89.5% for second quintile).
Tbl A32:E40, E41

There was no statistically significant difference between the national rate and the socio economic quintiles when these were calculated using the IRSAD.15
E47 – E51
Information on the measures of SES status is in Section 2: 2.7 Socio-economic status.
2 Victimisation as both a child and adult
What is child abuse?
As part of the PSS, respondents are asked about their experiences of abuse when they were under the age of 15.
The ABS defines child abuse as the deliberate harm of a person under the age of 15. There are two types of child abuse defined for the survey:
- Physical abuse – “any deliberate physical injury (including bruises) inflicted upon a child (before the age of 15 years) by an adult. Discipline that accidentally resulted in an injury is excluded.”
- Sexual abuse -“an act by an adult involving a child (before the age of 15 years) in sexual activity beyond their understanding or contrary to currently accepted community standards.”
Glossary
2.1 Sexual violence
If a woman experienced childhood sexual abuse, she typically reported that she had experienced more than one incident of abuse. Approximately 650,000 women who experienced sexual violence by a male perpetrator as an adult also experienced some kind of violence by a male perpetrator when they were a child.
2.1.1 Sexual violence perpetrated against an adult
1,683,700 women reported that they had experienced sexual violence by a male perpetrator since the age of 15.
Tbl A30: F16
In the paragraph below, we are looking at the following scenario:
- Women who have experienced both:
- any type of abuse as a child; and
- sexual violence as an adult.
Please note: for both child abuse and adult violence, the data is limited to male perpetrators only.
This section includes all perpetrator types (strangers, family, cohabiting partners, co-workers etc).
Women who experienced sexual violence as an adult and child abuse
651,600 of women who had experienced sexual violence by a male perpetrator since the age of 15 also experienced child abuse by a male perpetrator. This is:
- 38.7% of women who had experienced adult sexual violence by a male perpetrator; and
- one in fourteen women in Australia (7.5%).
Tbl A30: B16 C16
Most of these women had experienced sexual assault (584,400, 89.7%), with a much smaller number having experienced sexual threat (161,500, 24.8%).
B14 B15
Some women will have experienced more than one form of sexual victimisation as an adult, meaning that the sub-types do not add up to the total for sexual violence (651,600).

2.1.2 Sexual abuse perpetrated against a child
1.1 million women reported they had experienced sexual abuse when they were a child.
Tbl A29: F16
In the following section, we are looking at this scenario:
- Women who had experienced both:
- sexual abuse as a child more than once; and
- any type of violence as an adult;
Please note:
- Information is disaggregated by adult violence type.
- Both male and female perpetrators are included.
- This section includes all perpetrator types (strangers, family, cohabiting partners, co-workers etc).
More than one incident of childhood sexual abuse
Seven out of ten women who experienced sexual abuse as a child reported that it happened more than once (70.4%).
Tbl A29: F18
Also experienced victimisation as an adult
Of women who experienced more than one incident of sexual abuse as a child (775,800):
- 317,700 also experienced sexual assault as an adult.
- 101,500 also experienced sexual threat as an adult.
- 438,900 also experienced physical assault as an adult.
- 213,000 also experienced physical threat as an adult.
F18, T18, Z18, B18, H18
Some women will have experienced more than one form of victimisation as an adult, meaning that the types of adult violence will not add up to 775,800.
2.2 Physical violence
Almost all victims of physical abuse as a child reported that they had experienced more than one incident of abuse. One in nine women in Australia have experienced both physical abuse as a child and physical violence as an adult, with both acts at the hands of a male perpetrator.
2.2.1 Physical violence perpetrated against an adult
2,753,500 women reported that they had experienced physical violence by a male perpetrator since the age of 15.
Tbl A30:F11
In the paragraph below, we are looking at the following scenario:
- Women who have experienced both:
- any type of abuse as a child; and
- physical violence as an adult.
Please note:
- For both child abuse and adult violence, data is limited to male perpetrators only.
- This section includes all perpetrator types (strangers, family, cohabiting partners, co-workers etc).
Women who experienced physical violence as an adult and as a child
970,300 women who had experienced physical violence by a male perpetrator since the age of 15 had also experienced child abuse by a male perpetrator. This is:
- 35.2% of women who had experienced adult physical violence by a male perpetrator.
One in nine women in Australia (11.1%).
Tbl A30: B11, C11
Most of these women experienced physical assault (876,800, 90.4%), with a significantly smaller number having experienced physical threat (362,100, 37.3%).
B9, B10
Some women will have experienced more than one form of physical victimisation as an adult, meaning that the sub-types of adult violence do not add up to the total for physical violence (970,300).
2.2.2 Physical abuse perpetrated against a child
938,100 women reported that they had experienced physical abuse as a child.
Tbl A29: F10
In the following section, we are looking at this scenario:
- Women who have experienced both:
- physical abuse as a child more than once; and
- any type of violence as an adult.
Please note:
- Information is disaggregated by adult violence type.
- Both male and female perpetrators included.
- This section includes all perpetrator types (strangers, family, cohabiting partners, co-workers etc).
More than one incident
Nine out of ten women who had experienced physical abuse when they were a child said that it had happened more than once (90.4%).
Tbl A29
Also experienced victimisation as an adult
Of the women who experienced more than one incident of physical abuse as a child (848,500):
- 328,400 also experienced sexual assault as an adult.
- 104,300 also experienced sexual threat as an adult.
- 541,900 also experienced physical assault as an adult.
- 241,300 also experienced physical threat as an adult.
Tbl A29: F12, T12, Z12, B12, H12
Some women will have experienced more than one form of victimisation as an adult, meaning that the types of adult violence will not add up to 848,500.
Figure L: Number of women who experienced child abuse, cohabiting partner violence or both over their lifetime
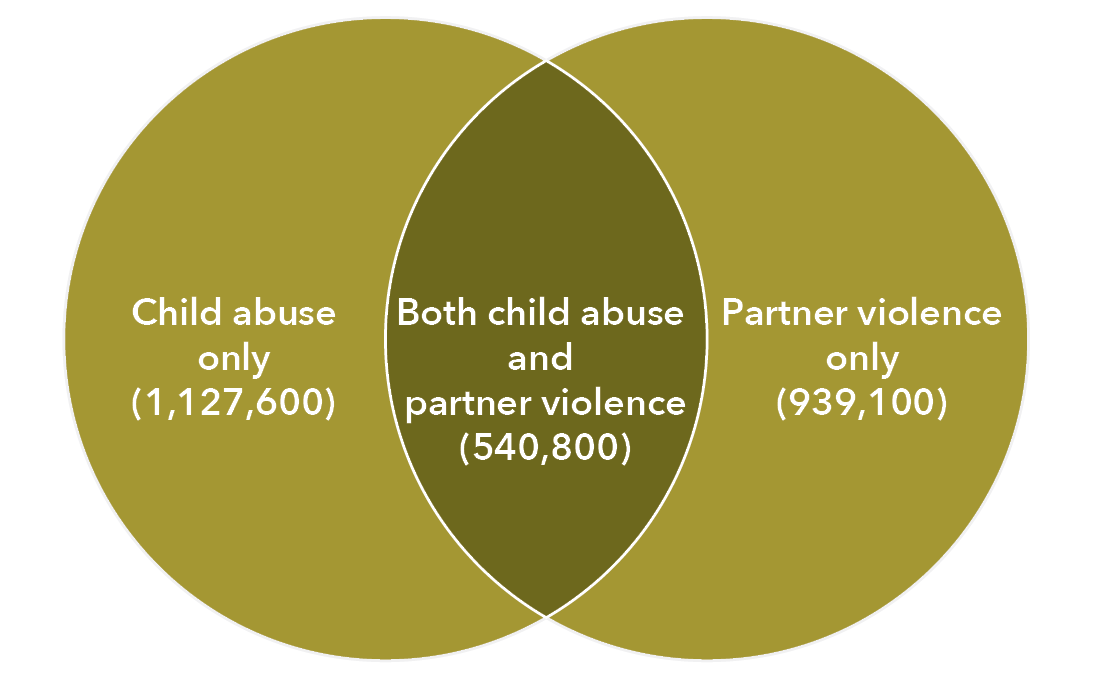
2.3 All violence
A third of women who had experienced child abuse reported that, as an adult, they had experienced violence by a cohabiting partner. Similarly, a third of victims of cohabiting partner violence reported that they had experienced abuse when they were a child.
In this section, we are looking at the following scenario:
- Women who reported that they had experienced any type of child abuse and, as an adult, had also experienced cohabiting partner violence.
Please note:
- All types of child abuse and all types of cohabiting partner violence were included in the analysis.
- Types of violence were not disaggregated.
- Male and female perpetrators of both child abuse and cohabiting partner violence are included.
Child abuse
1,668,400 women reported that they had experienced abuse as a child.
Tbl 31: F18
Cohabiting partner violence

1,479,900 women reported that, as an adult, they had experienced violence by either a current and/or former cohabiting partner.
Tbl 31: B21
Childhood abuse and partner violence
Across their lifetime, 540,800 women had experienced both cohabiting partner violence and abuse when they were a child. This is:
- 32.4% of all women who had experienced childhood abuse.
- 36.5% of all women who had experienced cohabiting partner violence.
- 6.2% of women in Australia.
B18, C18
The category of cohabiting partner includes both former and current partners who have lived with the survey respondent in a marriage or de facto relationship.
Childhood abuse but not partner violence
Across their lifetime, 1,127,600 women have experienced abuse when they were a child but not violence from a cohabiting partner. This is:
- 67.6% of all women who have experienced childhood abuse.
- 12.9% of women in Australia.
Tbl 31: D18, E18
Cohabiting partner violence but not childhood abuse

Across their lifetime, 939,100 women have experienced cohabiting partner violence but not abuse when they were a child. This is:
- 63.4% of all women who have experienced cohabiting partner violence.
- 10.8% of women in Australia.
B19

3 Multiple victimisation as a child
In this section, we are looking at the following scenario:
Women who reported that they had experienced multiple incidents of the same type of abuse as a child.
More women reported that they had experienced childhood sexual abuse (1,102,100) than childhood physical abuse (938,100).
Tbl A29: F16, F10
More than one incident
The majority of women who reported that they had experienced child abuse said that they had experienced more than one instance of abuse:
- 90.5% (848,500) of women reported having experienced more than one instance of physical abuse before the age of 15; and
- 70.4% (775,800) of women reported having experienced more than one instance of sexual abuse before the age of 15.
Tbl A29: F12, F18
Perpetrator of first incident
The most commonly reported perpetrator of the first incident of child abuse varied between incidents of physical and sexual abuse. 80.6% (756,300) of women reported that the perpetrator of their first incident of physical abuse was a parent. In comparison, 44.4% (489,400) of women reported that the perpetrator of their first incident of sexual abuse was a non-familial known person, and 13.8% (152,100) reported the perpetrator of their first incident of sexual abuse was by a parent.
Tbl A31:C9, E12, E9
Graph AK: Number of women who reported experiencing child abuse: By selected relationship to perpetrator of first incident and type of abuse
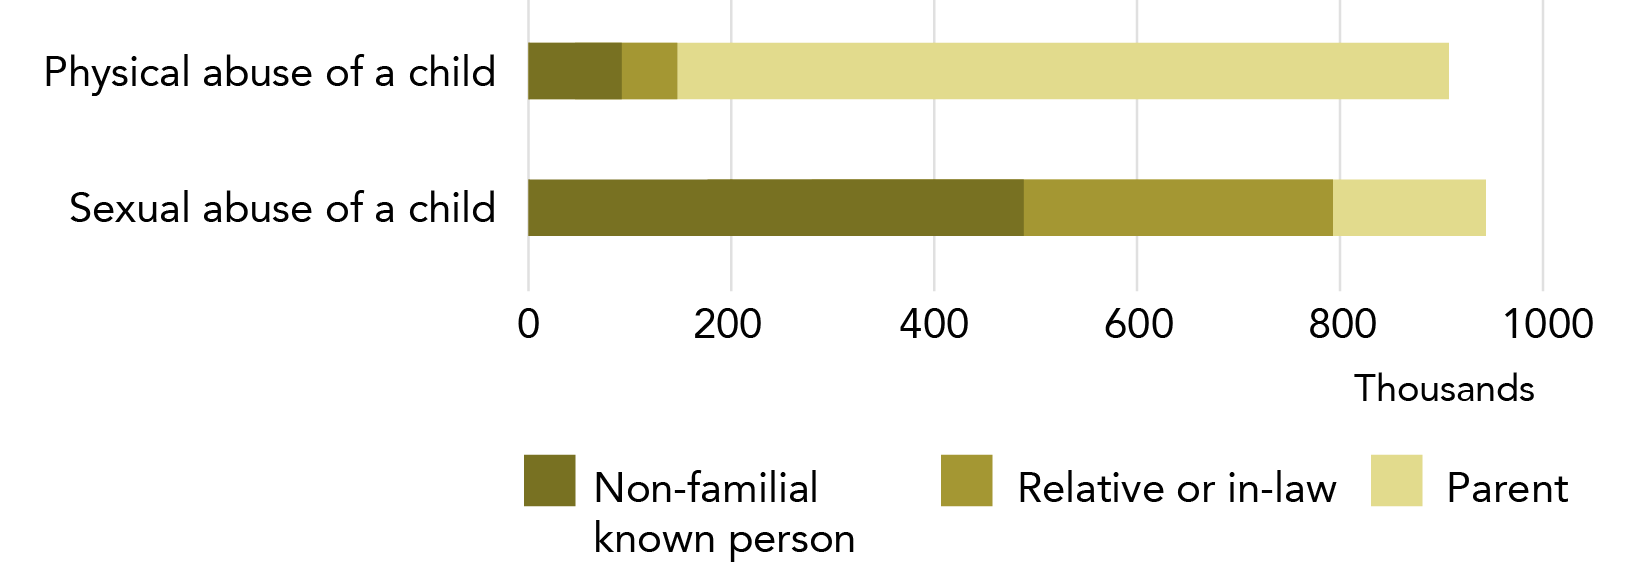
Data table for Graph AK:
Relationship to perpetrator Physical abuse of a child Sexual abuse of a child Non-familial known person ~92,000 ~489,400 Relative or in-law ~55,000 ~304,100 Parent ~756,300 ~152,100
In this section we described PSS data that demonstrated how violence disproportionately affects some women. Four out of ten women in Australia had experienced at least one violent incident in their lifetime: of these women, about a third had experienced separate incidents of both sexual and physical violence. In addition, most victims have experienced repeated incidents of violence, with 81.1% of women who had experienced violence by a male perpetrator in the last 12 months reporting that they had experienced more than one incident during that time period.
We now turn to our concluding section, where key themes from this report are identified.
Concluding remarks
For a summary of the data analysed in this project, please see the Executive Summary.
So much new knowledge
The ANROWS PSS analysis provides several hundred new statistical items related to violence against women. Almost all the data in this report is new – not only has this information not been publicly available before, but the data tables themselves have not been generated previously.
The ANROWS PSS report provides significantly more detail on the demographic characteristics of victims and perpetrators, incident characteristics and the impact of violence than has previously been available. This detail helps us to move beyond pre-conceived understandings of violence and identify unexpected patterns of victimisation.
ANROWS has reported data related to a definition of intimate partner that includes both cohabiting and non-cohabiting partners. This new definition more fully captures the nature of relationships within which women may experience intimate partner violence and helps demonstrate the full extent of violence against women.
This report provides a rich and nuanced understanding of violence by focusing on the relationships between data points. For instance:
- data on women’s engagement with the justice system was reported as a set of inter-related data points, so that the overall pattern of engagement was highlighted; and
- data based on seven definitions of multiple victimisation were explored in order to demonstrate the range of ways that women were repeatedly impacted by violence.
Such work helps to bring forward the complexities of lived experience and to highlight cross-group differences that may initially appear insignificant but which, over the course of a range of decision points, result in large differences in outcomes.
This report also provides substantial explanation of the conceptual structure of the PSS. By embedding discussions of definitions and data structure throughout the report, the reader is more easily able to understand what the statistics do (and do not) mean.
There’s no single way of knowing everything
The PSS is a complex tool for looking at a complex social problem. The ABS aims to provide a systematic approach to a lived experience that often does not have clear lines and boundaries.
The PSS is the most comprehensive quantitative dataset on interpersonal violence in Australia. It provides an incredible amount of detail about incidents of violence and their ongoing impact on women’s and men’s lives. It cannot, however, capture the full scope of the lived experience of violence. There are a number of reasons for this:
- It is very difficult to use quantitative research methods to get information about the quality of an experience. While the PSS is very good for counting things, it is less helpful in understanding the reasons why the pattern of numbers exists in the first place. This latter task is the terrain of qualitative research and is an area that the PSS cannot, and should not, be attending to.
- The PSS data is layered in a way that can make sub-population analysis difficult. Data becomes more fragile as more limitations are placed on it. Therefore, examination of sub-populations can be difficult because the estimates quickly become too unreliable for general use. Cross referencing multiple contextual factors can also be difficult for the same reason, so that while extensive detail is available about incidents of violence, the ability to build an understanding of how these factors interact can be more limited.
This is just the beginning
The ANROWS PSS report is a snapshot of the data available in the PSS. The report provides a summary of the data that was requested by ANROWS, with much of the detail needing to be put to one side in order to produce a report that was both understandable and of a reasonable length.
The data requested by ANROWS is now publicly available and is on the ANROWS website. If you are interested in further research using the PSS data, we encourage you to use these tables as a basis of your own analysis. We consider that the following are particularly worthy of further investigation:
- similarities and differences in the nature of violence experienced by cohabiting and non-cohabiting intimate partners;
- similarities and differences in the impact of violence for women with different demographic characteristics (including, possibly, the impact of multiple characteristics); and
- the nature and impact of the intersection of violence types, including the various forms of multiple victimisation that are captured by the PSS, as well as intimate partner sexual violence.
The PSS is currently a largely untapped resource – even the publicly available PSS data has yet to be fully explored and applied to the most obviously relevant research and policy contexts.
But what does it all mean?
The key statistical findings of this report are contained in the Executive Summary. However, there are also key theoretical findings that are worthy of note. These are:
- While there is often a type of experience that is (statistically) common, there is no universal experience that is common to all victims. Even “obvious” experiences, such as being afraid after an assault, are not experienced by everyone.
- Patterns of victimisation and the impacts of violence vary across demographics, with gender of the victim being the most pronounced variable.
- In order to understand quantitative data, we must work within the definitional and mathematical confines of the survey instrument.
Onward!
As of mid-2015, the ABS is in the midst of developing the 2016 PSS. It is an exciting time to be considering and engaging with this rich social data.
References
Council of Australian Governments. (2011). The National Plan to Reduce Violence against Women and their Children: Including the first three-year action plan. Canberra: FAHCSIA.
Grulich, A. E., de Visser, R. O., Badcock, P. B., Smith, A. M., Heywood, W., Richters, J., . . . Simpson, J. M. (2014). Homosexual experience and recent homosexual encounters: the Second Australian Study of Health and Relationships. Sexual Health, 11(5), 439-450.
Footnotes
- Although all participants are over 18 years, much of the survey asks them to report their experiences of violence since the age of 15. ↑
- Our Watch was founded under the First Action Plan of the National Plan to Reduce Violence against Women and their Children as Australia’s national organisation for preventing violence against women and their children. ↑
- Due to the hierarchy of incidents used in the PSS data collection (see the introduction of this report), this number represents women who have experienced an incident of physical threat that did not involve physical assault, sexual threat or sexual assault. ↑
- A known person includes cohabiting partner, boyfriend/girlfriend/date, father or mother, son or daughter, brother or sister, other relative or in-law, teacher, friend, acquaintance or neighbour, employer/boss/supervisor, co-worker/co-volunteer, counsellor/psychologist/psychiatrist, doctor, priest/minister/rabbi etc., prison officer and any other known persons. ↑
- A woman may have been sexually assaulted by both a boyfriend/date and a cohabiting partner. ↑
- Perpetrator’s drug and alcohol use is reported by the victim. ↑
- RSE for this estimate is not available as it uses data from multiple tables. ↑
- A known person includes cohabiting partner, boyfriend/girlfriend/date, father or mother, son or daughter, brother or sister, other relative or in-law, teacher, friend, acquaintance or neighbour, employer/boss/supervisor, co-worker/co-volunteer, counsellor/psychologist/psychiatrist, doctor, priest/minister/rabbi etc., prison officer and any other known persons. ↑
- Due to the hierarchy of incidents used in the PSS data collection (see the introduction of this report), this number represents women who have experienced an incident of physical threat that did not involve physical assault, sexual threat or sexual assault. ↑
- A woman may be victimised by both a cohabiting partner and a boyfriend/girlfriend/date. ↑
- Women could have experienced violence by both male and female partners. ↑
- Women could have experienced violence by multiple perpetrators. ↑
- All intimate partner violence in this age group is reported to have been from cohabiting partners. ↑
- These women may, or may not, also experience sexual violence. ↑
- Includes boyfriend or date, father, son, brother, other relative or in-law, teacher, friend, acquaintance or neighbour, employer/boss/supervisor, co-worker/co-volunteer, counsellor/psychologist/psychiatrist, doctor, priest/minister/rabbi etc., prison officer, ex-boyfriend and any other known persons. ↑
Horizons
Research report | August 2016
Issue 01 | 2015 Rev. ed.
Read the PDF version of this report
ANROWS acknowledgement
This material was produced with funding from the Australian Government and the Australian state and territory governments. Australia’s National Research Organisation for Women’s Safety (ANROWS) gratefully acknowledges the financial and other support it has received from these governments, without which this work would not have been possible. The findings and views reported in this paper are those of the authors and cannot be attributed to the Australian Government, or any Australian state or territory government.
Acknowledgement of Country
ANROWS acknowledges the traditional owners of the land across Australia on which we work and live. We pay our respects to Aboriginal and Torres Strait Islander elders past, present and future; and we value Aboriginal and Torres Strait Islander history, culture and knowledge.
© ANROWS 2016
Published by
Australia’s National Research Organisation for Women’s Safety Limited (ANROWS)
PO Box Q389, Queen Victoria Building NSW 1230 | www.anrows.org.au | Phone +61 2 8374 4000
ABN 67 162 349 171
Violence against women: Additional analysis of the Australian Bureau of Statistics’ Personal Safety Survey, 2012 / Peta Cox.
Sydney : ANROWS, c2016.
Pages ; 30 cm. (ANROWS Horizons: 01/2015 Rev. ed.)
I. Violence against women – Australia – Statistics. II. Sexual abuse victims – Australia -Statistics. III. Violence – Australia – Statistics.
I. Cox, Peta.
First published October 2015 (ANROWS).
This revised edition published August 2016.
978-1-925372-42-7 (print) 978-1-925372-43-4 (online)
2205-8907 (print) 2205-8923 (online)
Creative Commons Licence
Attribution Non-Commercial
CC BY-NC
This licence lets others distribute, remix and build upon the work, but only if it is for non-commercial purposes and they credit the original creator/s (and any other nominated parties). They do not have to license their Derivative Works on the same terms.
Version 3.0 (CC Australia ported licence): View CC BY-NC Australia Licence Deed | View CC BY-NC 3.0 Australia Legal Code
Version 4.0 (international licence): View CC BY-NC 4.0 Licence Deed | View CC BY-NC 4.0 Legal Code
Design
Erin Snelgrove, GOOD MATTERS.
Author acknowledgement
I wish to thank the staff at the ABS for their exemplary professionalism and ongoing support for this project. I also wish to thank the two anonymous reviewers; Ms Heather Nancarrow (ANROWS CEO); Emeritus Professor Anne R. Edwards AO (ANROWS Chair); and Dr Kristin Diemer for their valuable feedback in and input into the draft of this paper.
My sincere thanks also to the ANROWS team for their support and assistance throughout this project, in particular to Dr Mayet Costello, Dr Ann Deslandes, Ms Lisa Gordon, Ms Jess Gregory, Ms Rebecca Gyles, Ms Huette Lam, Dr Erin Mackay, Dr Trishima Mitra-Kahn, and Ms Jen Novak. Finally, thanks to Ms Erin Snelgrove for her generosity and creativity in the design of the report.
This work is part of the ANROWS Horizons series. ANROWS Horizons (Research reports) are in-depth reports on empirical research produced under ANROWS’s Research Program.
This report addresses work covered in ANROWS research project 1.1 ” Prevalence and incidence of violence against women. Australian Bureau of Statistics Personal Safety Survey 2012 additional data analysis on violence against women”. Please consult the ANROWS website for more information on this project. In addition to this paper, an ANROWS Compass is also available as part of this project.
Suggested citation
Cox, P. (2016). Violence against women: Additional analysis of the Australian Bureau of Statistics’ Personal Safety Survey, 2012 (ANROWS Horizons: 01/2015 Rev. ed.). Sydney: ANROWS.
Contents
Violence experienced by women and men
What is the Personal Safety Survey?
Respondent, survey participant or interviewee?
Strengths and challenges of the PSS
Nature of this research report
Things to keep in mind when reading these statistics
Section one: Violence experienced by women and men
1 Prevalence: How many people does violence, in general, happen to?
2 Perpetrator demographics: Who perpetrated the violence?
3 Incident characteristics: What happens in an incident of violence?
4 Post-incident actions and impacts: What happens after an incident of violence?
Section two: Women’s experiences of sexual assault
1 Prevalence: How many women are sexually assaulted?
2 Victim demographics: Who does sexual assault happen to?
3 Perpetrator demographics: Who perpetrated the sexual assault?
4 Incident characteristics: What happened in a sexual assault incident?
5 Post-incident actions and impacts: What happens after a sexual assault?
Section three: Women’s experiences of partner violence
1 Prevalence: How many women does partner violence happen to?
2 Victim demographics: Who does partner violence happen to?
3 Incident characteristics: What happens in partner violence incidents?
4 Post-incident actions and impacts: What happens after a partner violence incident?
Section four: Women’s experience of multiple victimisation
1 Multiple victimisation as an adult
2 Victimisation as both a child and adult
3 Multiple victimisation as a child
There’s no single way of knowing everything
Executive summary
This report provides substantial additional analysis of the data produced through the Australian Personal Safety Survey (PSS). The PSS is currently a largely untapped resource – even the publicly available PSS data has yet to be fully explored and applied to the most obviously relevant research and policy contexts.
The ANROWS PSS analysis provides several hundred new statistical items related to violence against women. Almost all the data in this report is new – not only has this information not been publicly available before, but the data tables themselves have not been generated previously.
The PSS is the most comprehensive quantitative study of interpersonal violence in Australia. The survey is administered by the Australian Bureau of Statistics (ABS) and funded by the Australian Government Department of Social Services. Over 17,000 women and men completed the 2012 survey.
Violence experienced by women and men
Violence is extremely common in Australia, with four out of ten women & five out of ten men having experienced at least one incident of violence since the age of 15. Men were more likely to be victims of physical violence (one in two men & one in three women) while women were more likely to be victims of sexual violence (one in five women & one in 22 men).
Both women and men were more than three times as likely to be physically assaulted by a man than by a woman. A man was most likely to experience violence in a place of entertainment and a woman was most likely to experience violence in her home. Seven out of ten men and five out of ten women said alcohol or other drugs contributed to their most recent physical assault by a male.
4.3 times as many women than men reported that they felt fear or anxiety after their most recent physical assault committed by an opposite sex perpetrator.
Gender remains the most substantial variable when considering differences in patterns of victimisation and perpetration.
Sexual assault
Since the age of 15, 1.5 million women had experienced sexual assault, of which more than 99% were perpetrated by men. In the year prior to the survey, 87,800 women were sexually assaulted in Australia.
More women were sexually assaulted by a boyfriend or date than by a male cohabiting partner. Women were equally likely to have been sexually assaulted by a partner they lived with as by a stranger.
Regarding their most recent incident of sexual assault by a male:
- three quarters of women reported that the assault occurred in a private residence;
- over half of women indicated that drugs or alcohol contributed to the incident;
- one in three women sexually assaulted by a known male thought that the sexual assault was a crime; and
- one in six women had not told anyone about the sexual assault.
Partner violence
One in four women in Australia have experienced at least one incident of violence by an intimate partner who they may, or may not, have been living with: one in three of these women had experienced violence by a non-cohabiting partner. Of the 2.2 million women who, since the age of 15, had experienced male intimate partner violence:
- 1.8 million experienced physical violence; and
- 0.9 million experienced sexual violence.
Most of the data available on partner violence in the PSS describes violence by a cohabiting partner.
Regarding their most recent incident of cohabiting partner violence, most women:
- reported that the incident happened in their home;
- did not perceive the incident as a crime;
- experienced fear or anxiety after the incident; and
- did not take time off work as a result of the assault.
Cohabiting partner violence does not just affect the victim – since the age of 15, over 400,000 women had experienced partner violence during pregnancy and over half a million women reported that their children had seen or heard partner violence.
Women may struggle to leave a violent relationship: the ABS estimates that 81,900 women have wanted to leave their violent current partner but never have and one in 12 women indicated that one of the reasons they returned to their violent previous partner was because they had nowhere to go. Even when women do leave such relationships, they often do so at a cost, seven out of ten women leaving property or assets behind when they moved away after their final separation from their most recently violent former partner.
Multiple victimisation
Many women experience multiple incidents of violence across their life span. For instance:
- More than two thirds of women who had experienced sexual violence had also experienced a separate incident of physical violence.
- Nearly 1 million women had experienced multiple incidents of physical violence by the same man.
- 0.78 million women had experienced multiple incidents of childhood sexual abuse. Of these, 0.32 million women also experienced at least one sexual assault as an adult.
In the 12 months prior to the survey, women with a disability were more likely to experience multiple incidents of violence by a male perpetrator.
Limitations
The PSS is a complex tool for looking at a complex social problem. The PSS data is layered in a way that can make sub-population analysis difficult. Data becomes more fragile as more limitations are placed on it. Therefore, examination of sub-populations can be difficult because the estimates quickly become too unreliable for general use. Cross-referencing multiple contextual factors can also be difficult for the same reason, so that while extensive detail is available about incidents of violence, the ability to build an understanding of how these factors interact can be more limited.
A key limitation of the survey is that the ABS has difficulty in accessing and surveying a statistically valid sample of people from communities of interest, including women with a disability and women from culturally and linguistically diverse backgrounds. In addition, there are a range of populations for whom the PSS does not currently collect demographic information, including transgender and gender diverse people, and Aboriginal and Torres Strait Islander peoples.
Introduction
As part of its Research Program 2014-2016 (Part 1), ANROWS committed to providing detailed analysis of Australia’s most comprehensive quantitative data on violence against women. In order to do this, ANROWS has analysed data from the 2012 Personal Safety Survey (PSS), produced by the Australian Bureau of Statistics (ABS), and not previously subjected to analysis.
In this introductory section, we describe the nature of the PSS, its strengths and weaknesses and the purpose of this data report.
What is the Personal Safety Survey?
- Most comprehensive quantitative sample survey in Australia of all forms of interpersonal violence.
- The 2012 PSS reflects a commitment of the National Plan to Reduce Violence against Women and their Children to complete the PSS every four years.
- Completed face-to-face to encourage full participation and help ensure safety of participants.
- Over 17,000 women and men completed the 2012 survey.
- Extensive quality control measures.
- Not designed to address subjective questions (e.g. emotional context of violence).
- Amount of detail collected means that there is a complex survey design.
- Can take a long time to complete if you have an extensive history of violence.
What are the characteristics of the PSS?
The PSS is the most comprehensive quantitative study of interpersonal violence in Australia. The survey is administered by the ABS and funded by the Australian Government Department of Social Services.
The survey was undertaken in 2005 and 2012, with another survey planned for 2016. A similar survey, limited to women’s experiences of violence, was completed in 1996. This allows rates of violence to be compared over time.
The survey is designed to provide national data on how often interpersonal violence occurs, and how many people are affected by it. It has a particular focus on types of violence that are of interest to the violence against women sector, namely intimate partner violence and sexual assault.
The PSS is a statistical tool designed to count events that have already happened. There are a range of things that it does not, and cannot, do. For example, the PSS does not:
- provide modelling of how many people will be affected by violence in the future;
- address subjective research questions. For example, it does not investigate emotional aspects of violence nor beliefs or attitudes towards violence.
For the 2012 survey, ABS staff determined the number of female interviewees to ensure that robust estimates could be given at the state and territory level for women’s experiences of all violence types (as a total) in the previous 12 months. Estimates are also separately provided for women’s experiences of intimate partner violence and sexual assault in the previous 12 months. The provision of these estimates supports the implementation of the National Plan to Reduce Violence against Women and their Children (Council of Australian Governments (COAG), 2011). The sample size for men was calculated to ensure that there were robust estimates for men’s experiences of violence at the national level.
Extensive quality control measures were used to ensure the robustness of the data in the 2012 PSS. These practices included:
- consultation through a range of advisory mechanisms;
- pre-testing of the survey with individuals who had complex violence histories;
- sensitivity training for interviewers;
- data cleaning to ensure accurate entries;
- identification (and where possible addressing) of bias in the sample; and
- acknowledgement of potential bias in the selected sample in publications.
How is the PSS administered?
The PSS is a household survey, which means that the ABS randomly selects participants by contacting a residence and then speaking to an adult member of the household (for each household, the ABS decides whether a male or female person will be surveyed before making contact). Unlike most household surveys which are done via telephone, the PSS is completed face-to-face. ABS staff door-knock at households and then identify the selected respondent. After selecting the respondent, they make sure they can conduct the survey interview in a private setting (the ABS has some provisions if this is not possible such as coming back later, arranging an alternative meeting place or completing the interview by phone). The interview is conducted using a Computer Assisted Personal Interview system; interviewers follow a sequence of questions and prompts and enter responses into a secure laptop. This collection method aims to ensure confidentiality and assist in supporting participants to make the disclosures required for data collection.
The survey does not sample people who live in places other than private dwellings. It excludes individuals living in non-private accommodation such as aged care facilities and hospitals. If it was clear to ABS staff that a premises is a women’s refuge, they would not approach that premises. However, women’s refuges are rarely signposted on the street, and generally look like private accommodation, so they may be approached by ABS staff for inclusion of a resident in the survey. Participation would be declined because of the ABS requirement for identifying information for all inhabitants of the premises.
The sample includes women and men who are over the age of 18 years.[1] More women than men are in the sample, as sufficient numbers of women in each state and territory are required in order for robust estimates at this level to be able to be used in the context of the National Plan to Reduce Violence against Women and their Children (COAG, 2011). Only national estimates are required for men.
In 2012, 41,345 households were approached with 30,228 dwellings deemed eligible for inclusion in the survey. A total of 17,050 individuals (13,307 women and 3,743 men) completed the survey.
One of the strengths of the PSS is the amount of detail collected about occasions of violence. A consequence of this strength is that the survey can take a long time to complete – for people with experience of multiple types of violence, the survey can take up to two hours.
In acknowledgement of the distress that the survey may cause, the ABS offers support to both staff and interviewees.
How is the PSS structured?
The PSS is designed to provide quantitative data on Australian experiences of violence. In order to do this, the ABS collects information on the following topics:
- the demographic details of the interviewee and their partner (if they have one);
- the interviewee’s experiences of violence since the age of 15; and
- detailed characteristics of the most recent incident for eight types of violence (see below for detail of the eight types of violence).
The survey asks specific questions about:
- the context of violence perpetrated by a partner;
- emotional abuse by a partner;
- abuse before the age of 15;
- sexual harassment; and
- stalking.
Most of the survey concentrates on collecting near identical information for eight categories of violence: four types of violence (sexual assault, sexual threat, physical assault and physical threat), each collected separately for two types of perpetrator (male and female). Thus, an interviewee may be asked the same set of questions eight times, once for each type of violence.
Table A: The eight categories of violence used in the PSS
| Physical assault by a male | Physical assault by a female |
| Physical threat by a male | Physical threat by a female |
| Sexual assault by a male | Sexual assault by a female |
| Sexual threat by a male | Sexual threat by a female |
The survey asks for extensive detail about the interviewee’s “most recent” experience of each type of violence.
The survey is structured using conditional reasoning. This means that interviewees only answer questions that are relevant to their experience. This is achieved by question sequencing that is programmed into the survey collection equipment.
Figure A: Structure of the PSS data
Respondent, survey participant or interviewee?
In this report we use the terms “respondent”, “survey participant” and “interviewee” interchangeably. When we say “respondent” we are not referring to a person who is responding to a petition in court (as per domestic violence legislation) but rather to a person who responds to the survey.
The majority of this report, however, will not use these terms. This is because most of the data is presented as population estimates. These estimates are a weighted calculation based on individual survey responses (i.e. raw data) and census data. In this way, the estimates are an extrapolation of the raw data, rather than a simple reporting of interviewee responses. Thus, to talk directly about the number of respondents who indicated a particular experience would be inaccurate.
Strengths and challenges of the PSS
- Systematically structured definitions and survey.
- Good quality prevalence estimates.
- Extremely detailed information on most recent incident of violence.
- Collected sensitively.
- Structure of survey limits some analysis.
- Definitions can be initially confusing as they may not align with “common sense” understandings of violence.
- Difficulty in accessing and surveying a statistically valid sample of people from communities of interest, including women with a disability and women from culturally and linguistically diverse backgrounds.
The PSS is a systematic and statistically rigorous survey that provides population estimates on the extent of violence in the Australian community.
The ABS takes care to ensure that data is collected sensitively, balancing the need for detailed information with the time and emotional toll involved in its collection.
One of the key strengths of the PSS is that it provides extremely detailed information about specific incidents of violence. Due to time and respondent capacity constraints, it is not feasible for the survey to collect detailed information about all incidents of violence that a person has ever experienced.
The ABS produces a statistical report for each time the survey is conducted. Each report is technical and precise with little background or contextualising information and no discussion of the implications of its findings. By using this tone, the ABS maintains a high level of objectivity in its reports. Organisations such as ANROWS and Our Watch[2] aim to provide background information that may help to contextualise the reports.
What are the challenges of using the PSS?
There are several key challenges that can make the use of PSS statistics difficult.
The ABS does not write up all the data that it collects as the level of detail collected in the survey makes publication of all survey findings unfeasible. This means that some findings that may be of particular interest to those working on policy, programs and practice related to violence against women are not publicly available in the published report. Data not included in the survey publication is available through custom data requests, or by accessing the “Confidentialised Unit Record File”.
For some purposes, the PSS is not sufficiently timely. Production of the PSS report requires significant data entry and sophisticated analysis. Results of the survey take time to become available. In 2015, the most current available data was published in late 2013 and relates to the survey that was completed in 2012. The next survey will be completed in 2016.
Although data is systematically collected, experiential, conceptual and statistical limitations mean that it can be difficult to compare different types of violence. For example, it is not possible to compare data about women who have experienced sexual assault and those who have experienced partner violence as they have an overlapping population (i.e. some women will have experienced sexual assault by a partner). It is also not possible to consider some violence types individually – for example, in the partner violence module of the survey, “physical assault by a partner” and “sexual assault by a partner” are subsumed into the broader violence type category “partner violence”.
Violence = assault and/or threat
Responses to the PSS are weighted to reflect the demographics of the Australian community. This is important as it means that the survey is representative; however, it can make estimates for small sub-populations unreliable. For example, estimates for women born overseas who have experienced sexual assault in the last 12 months will be less reliable than those for (all) women who have experienced sexual assault in the last 12 months, because individual responses will have a greater impact on the weighted estimates for small populations.
Similarly, the capacity for cross referencing (e.g. demographic information against violence types) can be limited by constraints on the production of reliable estimates.
Definitions used in the PSS
The PSS counts instances of physical and sexual violence, with “violence” understood as including both assault (harming a person) and threat (threatening to harm a person).
The PSS uses a hierarchy to ensure any single incident is only counted once. In this context, counting of sexual violence is prioritised over counting of physical violence, and counting of assault is prioritised over counting of threats. Thus:
- If a person experienced a threat and an assault in the same incident, the experience would be counted once as an assault.
- If a person experienced both physical and sexual assaults (or threats) in a single incident, the incident would be counted once as a sexual assault (or threat).
- An incident that includes both physical assault and sexual threats is counted as a sexual threat.
The PSS defines the types of violence as follows:
- Physical violence involves any incidents of physical assault and/or physical threat:
- Physical assault involves “the use of physical force with the intent to harm or frighten a person. Assaults may have occurred in conjunction with a robbery and includes incidents where a person was assaulted in their line of work (e.g. assaulted while working as a security guard). This includes being: pushed, grabbed or shoved; slapped; kicked, bitten or hit with a fist; hit with an object or something else that could hurt you; beaten; choked; stabbed; shot; or any other type of physical assault which involved the use of physical force with the intent to harm or frighten a person. Physical assault excludes incidents that occurred during the course of play on a sporting field.”
- Physical threat is “an attempt to inflict physical harm or a threat or suggestion of intent to inflict physical harm that was made face-to-face where the person believes it was able to and likely to be carried out.” Physical threat has the same inclusion and exclusion criteria as physical assault.
- Sexual violence involves any incidents of sexual assault and/or sexual threat:
- Sexual assault is “an act of a sexual nature carried out against a person’s will through the use of physical force, intimidation or coercion, and includes any attempts to do this. This includes rape, attempted rape, aggravated sexual assault (assault with a weapon), indecent assault, penetration by objects, forced sexual activity that did not end in penetration and attempts to force a person into sexual activity.” Sexual assault excludes unwanted sexual touching – for the purposes of this survey, this is defined as “sexual harassment”.
- Sexual threat involves the “threat of acts of a sexual nature that were made face-to-face where the person believes it is able to and likely to be carried out”.
The survey uses the following definition of partner:
- A current partner is defined as someone you live with in a marriage or de-facto relationship.
- A previous partner is someone you have lived with in a marriage or de-facto relationship. The term indicates that the perpetrator was a previous partner at the time of the survey, and includes partners who were violent during the relationship.
The ABS definition of partner explicitly excludes people in a relationship that do not live together.
Incidents of violence that occurred before the age of 15 are defined as childhood abuse, not assault. A small number of questions are asked about experiences of child abuse, however, these are excluded from the main calculations of prevalence.
Nature of this research report
Purpose of this report
With this report, ANROWS aims to:
- provide substantial additional analysis of the PSS data;
- provide accessible and accurate data to the domestic violence and sexual assault services sectors;
- represent data in a way that can be used by advocates, service providers, policy-makers, commentators and the media;
- promote accurate and informed use of PSS statistics; and
- explain the strengths and limitations of the PSS.
The focus of this project is on the violence experienced by women, which is consistent with ANROWS’s mandate to focus on violence against women. This is different to the broader attention in the PSS to all forms of violence experienced by Australian women and men.
Structure of report
This statistical report provides detailed analysis on:
- violence experienced by women and men;
- sexual assault;
- partner violence; and
- multiple victimisation.
For each topic, we answer the following questions:
- How many people does this happen to? (Prevalence of violence).
- Who does it happen to? (Victim demographics).
- Who made it happen? (Perpetrator characteristics).
- What happened? (Incident characteristics).
- What happened next? (Post-incident actions and impacts).
How to read this report
Things to keep in mind when reading these statistics
- The population estimates are a weighted extrapolation from the survey sample. These estimates have been calculated by the ABS and do not refer to the number of people who answered the question when they were completing the survey.
- The population estimates are rounded to the nearest hundred.
- Statements regarding “violence” combine data on assault and threat – this means that “physical violence” and “physical assault” relate to different populations (although “physical assault” is a sub-set within “physical violence”).
- Although there are some limitations on who is eligible to participate (e.g. overseas visitors who are in Australia for less than 12 months), interviewees are people who are located in Australia. Interviewees do not have to be Australian citizens.
- Tips for reading the report:
- The data gets dense quite quickly, so reading in short bursts may help you keep a clear head, and
- Use the headings and sub-headings as a way of keeping clear on the population being discussed
This report describes a large number of statistics for multiple respondent groups. It aims to describe them as clearly as possible. In order to do this, the report has been structured in the following way:
Figure B: How to read this report
| Post it note A reminder or helpful hint to assist with reading the report. |
| Text box Explanations of survey structure or data. |
| Grid references under paragraphs Grid reference for the data in this paragraph of the text. Tbl 16 Data already published by the ABS and available on the PSS website. Tbl A16 Data requested by ANROWS and available on the ANROWS website. |
| Green percentage sign Difference was calculated to be statistically significant |
| Red percentage sign Difference was calculated to be not statistically significant |
| Most recent incident Highlighted to help the reader be aware that most recent incident data should be used carefully (see Section 1: 3 incident characteristics for an explanation). |
| Gold text Numbers calculated by ANROWS. |
| Asterisk RSE 25%-50% – these statistics should be used with caution. |
| Double asterisks RSE 50%+ – these statistics should be used with extreme caution and are generally considered too unreliable for general use. |
Terminology
| Term | Definition |
|---|---|
| Advice, seeking of (as compared to telling someone) | See Telling someone, below. |
| Boyfriend/girlfriend/date | A person who the respondent is in an emotionally and/or sexually intimate relationship with but does not live with. Includes a wide range of relationships from one night stands to long term committed non-cohabiting relationships. Does not require sexual involvement. |
| Cohabiting partner | A partner that a person is, or has, lived with in a marriage or de-facto relationship. |
| Contributed to the incident: drugs and alcohol | Survey respondents are asked whether they think drugs or alcohol contributed to their most recent incident of violence. If they answer “yes” to this question, they are then asked about the nature of the contribution, including:
|
| Current cohabiting partner | A current cohabiting partner is a person who, at the time of the survey, the respondent to the survey was living with in a marriage or de-facto relationship. |
| Disability, a person with a | The PSS uses a standard measure of core activity limitation that is used in other ABS surveys. The measure assesses the extent to which a person “needs help, has difficulty, or uses aids or equipment with [self-care, mobility or communication]”. A person may be defined as having a profound, severe, moderate or mild disability, depending on the level of core activity limitation that they experience. A person must have experienced, or be likely to experience, the limitation for at least 6 months in order for them to be classified as a person who has a disability or long-term health condition. The PSS only selects respondents from private dwellings. Therefore, no women or men living in institutional care settings were interviewed as part of the survey. This is likely to affect the quality of the data related to this population. |
| Employed/in the labour-force | The PSS uses the standard ABS definition of employment. It includes as “employed”, amongst other scenarios, a person who in the week prior to the interview:
|
| Emotional abuse | Emotional abuse is defined in the PSS as “behaviours or actions that are aimed at preventing or controlling [a partner’s] behaviour with the intent to cause them emotional harm or fear”. Emotional abuse is not classified as violence in the PSS. |
| Former cohabiting partner | A former partner includes:
A former partner has at some point in time lived with the survey respondent, however the violence may have started after they stopped cohabiting. |
| Home | When a victim and perpetrator live in the same house, the house is categorised as the victim’s home. This means that a house that is categorised as a perpetrator’s house is not the residence of the victim, but a victim’s house may or may not be the perpetrator’s home. |
| Intimate partner | A broad definition of partner that includes partners that a person may or may not be living with. This category includes cohabiting partners, as well as boyfriends, girlfriends and dates. |
| Index of Relative Socio-economic Advantage and Disadvantage (IRSAD) | The ABS has developed several measures of socio-economic status. The data collected in the PSS allows for the calculation of the Index of Relative Socio-economic Advantage and Disadvantage (IRSAD). The IRSAD “summarises information about the economic and social conditions of people and households within an area, including both relative advantage and disadvantage measures.” IRSAD data is presented using quintiles: a quintile is a “grouping that result[s] from ranking households by [the IRSAD rate] and then dividing the population into… five equal groups.” |
| Known person | Includes someone known to the victim but not included in the other categories described (sometimes, this will include boyfriend/girlfriend/date, and sometimes it will not – in order to determine this, please note whether “intimate partner” or “cohabiting partner” is in the corresponding category). A known person may be a parent or step-parent, son/daughter (including step-children), sibling (including step-sibling), relative or in-law, friend, acquaintance, neighbour, employer/boss/supervisor, co-worker/co-volunteer, counsellor/psychologist/psychiatrist, doctor, teacher, pastor/priest/minister/rabbi, prison officer, ex-boyfriend/ex-girlfriend or any other known person/s. |
| Main English speaking country | The ABS defines the United Kingdom, the Republic of Ireland, New Zealand, Canada, South Africa and the United States of America as “main English speaking countries”. |
| Most recent incident (MRI) | A person’s most recent incident of a specific form of violence. |
| Perpetrator type | Perpetrator type refers to the relationship between the victim and the perpetrator. In general the analysis in this report distinguishes between cohabiting partners, other known people and strangers. |
| Physical abuse | The PSS defined physical abuse of a child as “[a]ny deliberate physical injury (including bruises) inflicted upon a child (before the age of 15 years) by an adult. Discipline that accidentally resulted in an injury is excluded.” |
| Physical assault | Physical assault involves “the use of physical force with the intent to harm or frighten a person. Assaults may have occurred in conjunction with a robbery and includes incidents where a person was assaulted in their line of work (e.g. assaulted while working as a security guard). This includes being: pushed, grabbed or shoved; slapped; kicked, bitten or hit with a fist; hit with an object or something else that could hurt you; beaten; choked; stabbed; shot; or any other type of physical assault which involved the use of physical force with the intent to harm or frighten a person. Physical assault excludes incidents that occurred during the course of play on a sporting field.” |
| Physical threat | Physical threat is “an attempt to inflict physical harm or a threat or suggestion of intent to inflict physical harm, which was made face-to-face where the person believes it was able to and likely to be carried out. Physical threat has the same inclusion and exclusion criteria as physical assault.” |
| Physical violence | Physical violence involves any incidents of physical assault and/or physical threat. |
| Place of entertainment | A place of entertainment or recreation includes places such as pubs, nightclubs and sporting venues. The ABS also includes in this category “hotels, bars, taverns and licensed restaurants and the areas surrounding these premises such as on the footpath, in a beer garden or carpark of a pub or hotel.” |
| RSE (Relative Standard Error) | The ABS defines RSE as follows: “The Standard Error measure indicates the extent to which a survey estimate is likely to deviate from the true population and is expressed as a number. The Relative Standard Error (RSE) is the standard error expressed as a fraction of the estimate and is usually displayed as a percentage. Estimates with a RSE of 25% or greater are subject to high sampling error and should be used with caution.” An estimate with an RSE between 25% and 50% is annotated in this report with a single asterisk and should be used with caution. An estimate with an RSE above 50% is annotated with a double asterisks and is deemed too unreliable for general use. |
| Sexual abuse | Sexual abuse of a child is “an act by an adult involving a child (before the age of 15 years) in sexual activity beyond their understanding or contrary to currently accepted community standards.” |
| Sexual assault | Sexual assault is defined “an act of a sexual nature carried out against a person’s will through the use of physical force, intimidation or coercion, and includes any attempts to do this. This includes rape, attempted rape, aggravated sexual assault (assault with a weapon), indecent assault, penetration by objects, forced sexual activity that did not end in penetration and attempts to force a person into sexual activity. Sexual assault excludes brief unwanted sexual touching.” |
| Sexual threat | Sexual threat involves “the threat of acts of a sexual nature that were made face-to-face where the person believes it is able to and likely to be carried out.” |
| Sexual violence | Sexual violence is defined as sexual assault or the threat of assault (where the victim reasonably believes that the assault could be completed). |
| Statistically significant | Statistical significance testing is a way of determining whether the difference seen between numbers is likely to be a result of a “real” difference or as a result of the research sample. When we say that a difference is “statistically significant”, we are indicating that, according to accepted statistical modelling, in at least 19 out of 20 cases, the difference is “real” and not a chance variation in sample characteristics. Another way of understanding this is to say that based on a statistical test, we can be 95% sure the result is not by chance but is an accurate representation of the phenomenon. |
| Telling someone (vs seeking advice) | To tell someone about an incident only requires that you inform them about the incident: it does not require that the person give you any advice or support. If you said to someone “John hit me the other day” – this would be telling them about the incident. You would be getting advice or support if you said to someone “John hit me: could you help me work out what to do about it?”. |
Section one: Violence experienced by women and men
In Australian media and research on violence against women, women’s experiences of violence are frequently compared to those of men. These comparisons are at times problematic as they tend to hide the important differences in the nature of violence experienced by women and men. Despite this, such comparisons are a common use of PSS data and are an important way of contextualising more detailed discussions of violence against women. This section of the report therefore aims to provide accurate information to inform such gendered analysis. In the context of the aims of this report, men’s experiences are discussed here precisely because they enable us to more fully understand the experiences of women.
This section aims to contextualise the more detailed analysis of women’s experiences in the rest of the report by:
- highlighting the similarities and differences in men’s and women’s experiences of violence;
- articulating the high level outcome measures that are then analysed in more detail in the rest of the report; and
- mirroring the structure of the rest of the report to assist the reader in navigating the content.
This section begins with an analysis of the prevalence of violence experienced by women and men (including specific forms of violence) and then proceeds to analyses of perpetrator demographics, basic incident characteristics and key post-incident actions and impacts.
Contents for this section
1 Prevalence: How many people does violence, in general, happen to?
2 Perpetrator demographics: Who perpetrated the violence?
2.4 Boyfriend, girlfriend or date
3 Incident characteristics: What happens in an incident of violence?
4 Post-incident actions and impacts: What happens after an incident of violence?
4.1 Police contact and court appearance
1 Prevalence: How many people does violence, in general, happen to?
1.1 Since the age of 15
Since the age of 15, more men than women have experienced at least one incident of violence. Both women and men experience more physical violence than sexual violence. Women are more likely to experience sexual violence than men.
1.1.1 All violence
Since the age of 15
During their adult life, men are more likely than women to have experienced some form of violence.
Since the age of 15, 3.6 million women have experienced violence. This is four out of ten women in Australia (40.8%).
Tbl 1: D29
Since the age of 15, 4.1 million men have experienced violence. This is one in two men in Australia (49%).
B29
The difference in rates of violence perpetrated against women and men is statistically significant.
1.1.2 Sexual violence
Sexual violence (assault and threat)
In comparison to men, women were significantly more likely to have experienced sexual violence. An incident of sexual violence may include sexual assault and/or sexual threat.
1.7 million women have experienced sexual violence since the age of 15. This is one in five women in Australia (19.4%).
Tbl 1: D39
0.4 million men have experienced sexual violence since the age of 15. This is one in 22 men in Australia (4.5%).
B39
The difference in rates of sexual violence for men and women is statistically significant.
What are we talking about again?
This section looks at a range of categories of violence.
- All violence – any instance of sexual or physical violence;
- Sexual violence – any instance of sexual assault or sexual threat; and
- Physical violence – any instance of physical assault or physical threat.
The prevalence data outlined here is a count of people, rather than a count of instances of violence. A person is only counted once in a particular category, regardless of how many incidents they have experienced.
For example, Jan has experienced:
- three incidents of sexual threat; and
- two instances of sexual assault.
As Jan is always one person, she would be counted:
- once in the sexual threat category;
- once in the sexual assault category;
- once in sexual violence; and
- once in the all violence category.
Remember!
Violence can be perpetrated by anyone – strangers, co-workers, partners, parents etc.
Graph A: Since the age of 15, number of women and men who experienced sexual assault: By sex of victim and sex of perpetrator
Data table for Graph A:
| Gender | Female perpetrator | Male perpetrator |
|---|---|---|
| Female victim | 25,400 | 852,800 |
| Male victim | 130,600 | 72,300 |
Note: Data relates to incidents since the age of 15.
Sexual assault
Women were more than four times as likely as men to have experienced sexual assault.
More than one in six women have experienced sexual assault (17.1%); this is 1.5 million women. Approximately 33.5 times as many women reported sexual assault by a man (852,800) than by a woman (25,400).
Tbl 16: D37, F23, F24
One in 25 men have experienced sexual assault since the age of 15 (4%). This is more than 0.3 million men. More men experienced sexual assault by a female (130,600) than experienced sexual assault by a male (72,300).
B37, F12, F11
The difference in rates of sexual assault for men and women is statistically significant.
Sexual threat
Women were eight times as likely to have experienced sexual assault.
Close to 400,000 women experienced sexual threat in their adult life. This is one in 22 women (4.4%).
Tbl 1: D38
A little over 50,000 men experienced sexual threat. This is one in 160 men (0.6%).
B38
The difference in rates of sexual threat for men and women is statistically significant.
Women experience significantly more sexual violence than men. The vast majority of these assaults are perpetrated by men.
What does statistically significant mean?
Statistical significance testing is a way of determining whether the difference seen between numbers is likely to be a result of a “real” difference or as a result of the research sample. When we say that a difference is “statistically significant”, we are indicating that, according to accepted statistical modelling, in at least 19 out of 20 cases, the difference is “real” and not a chance variation in sample characteristics.
Another way of understanding this is to say that; based on a statistical test, we can be 95% sure the result is not by chance but is an accurate representation of the phenomenon – in this case, the difference in rates of violence perpetrated against women and men.
Graph B: Since the age of 15, number of women and men who experienced physical assault: By sex of victim and sex of perpetrator
Data table for Graph B:
| Sex of victim | Female perpetrator | Male perpetrator |
|---|---|---|
| Female victim | ~630,000 | ~2,400,000 |
| Male victim | ~920,000 | ~3,140,000 |
Note: Data relates to incidents since the age of 15.
Remember!
Physical violence is a set of actions that can be perpetrated by anyone – strangers, co-workers, partners, parents etc.
1.1.3 Physical violence
Physical violence (assault and threat)
Since the age of 15, more men than women have experienced physical violence.
A little over one in three women in Australia have experienced physical violence since the age of 15 (34.4%): this is slightly more than 3 million women.
Tbl 1: D34
Close to one in two men in Australia have experienced at least one incident of physical violence since they turned 15 (48.1%): this is more than 4 million men.
B34
The difference in rates of physical violence for men and women is statistically significant.
Physical assault
Approximately 1.3 times as many men had experienced physical assault.
Approximately 2.6 million women have experienced at least one incident of physical assault: this is three out of ten women in Australia (29.8%).
Tbl 1: D32
A little over 3.3 million men have experienced physical assault: this is four out of ten men in Australia (39.3%)
B32
The difference in rates of physical assault for men and women is statistically significant.
Physical threat
Compared to women, 1.75 times as many men had experienced physical threat.[3]
Over 1.1 million women have experienced physical threat: this is one in eight women in Australia (12.8%).
Tbl 1: D33
Close to 2 million men have experienced physical threat: this is one in four men in Australia (23.2%).
B33
The difference in rates of physical threat for men and women is statistically significant.
Physical violence is more prevalent than sexual violence in Australia. Men are more likely than women to have experienced physical assault and physical threat.
1.1.4 No violence
Women were more likely than men to report no violence in their adult lives.
Six out of ten women had not experienced any violence since the age of 15 (59.2%). This is over 5.1 million women.
Tbl 1: D27
Five out of ten men had not experienced any violence since the age of 15 (51%). This is 4.3 million men.
B27
The difference in rates of “no violence” for men and women is statistically significant.
“In the last 12 months” is a subset of “since the age of 15”
Prevalence data is collected by the ABS for both a respondent’s experience of violence since the age of 15, and in the 12 months prior to the survey. These are overlapping groups, with “in the last 12 months” a sub-set of “since the age of 15”. All respondents in the former category are also counted in the latter.
1.2 In the last 12 months
1.2.1 All violence
In the 12 months prior to the survey, 1.6 times as many men as women experienced at least one violent incident.
Close to half a million women experienced violence in the 12 months prior to completing the survey: this is one in twenty women (5.3%).
Tbl 1: D13
Close to three quarters of a million men experienced violence in the 12 months prior to completing the survey: this is one in twelve men (8.7%).
B13
(A person may have experienced more than one type of incident during the 12 month period.)
The difference in rates of violence for men and women is statistically significant.
1.2.2 Sexual violence
Sexual violence (assault and threat)
Women were more likely than men to have experienced sexual violence in the 12 months prior to the survey.
A little over 100,000 women experienced sexual violence in the year prior to the survey. This is 1.2% of women in Australia.
Tbl 1: D23
A little over 40,000 men experienced sexual violence in the last year. This is 0.5%* of men in Australia. (The male sexual violence statistics presented in this section 1.2.2: Sexual violence have a high RSE and should be used with caution.)
B23
The difference in rates of sexual violence for men and women is statistically significant.
What is RSE?
The ABS defines Relative Standard Error (RSE) as follows:
“The Standard Error measure indicates the extent to which a survey estimate is likely to deviate from the true population and is expressed as a number. The Relative Standard Error (RSE) is the standard error expressed as a fraction of the estimate and is usually displayed as a percentage. Estimates with a RSE of 25% or greater are subject to high sampling error and should be used with caution.”
An estimate with a RSE between 25% and 50% is annotated with a single asterisk* and should be used with caution.
An estimate with a RSE above 50% is annotated with a double asterisks** and is deemed too unreliable for general use.
For more information, please see: https://www.abs.gov.au/websitedbs/d3310114.nsf/Home/What+is+a+Standard+Error+and+Relative+Standard+Error,+Reliability+of+estimates+for+Labour+Force+data
Graph C: During the last 12 months, number of women and men who experienced violence: By sex of victim and type of violence
Data table for Graph C:
| Type of violence | Female victim | Male victim |
|---|---|---|
| Physical violence | ~400,000 | ~720,000 |
| Sexual violence | ~100,000 | ~45,000 |
Note: Data relates to incidents since the age of 15.
Sexual assault
Close to two and a half times as many women as men reported that they had been sexually assaulted in the year prior to the survey.
87,800 women experienced sexual assault in the last year: this is one in 100 women (1%).
Tbl 1: D21
37,000* men experienced sexual assault in the last year: this is 0.4%* of men in Australia.
B21
The difference in rates of sexual assault for men and women is statistically significant.
Sexual threat
17,600* (0.2%*) women reported having experienced sexual threat.
Tbl 1: D22
The estimates for sexual threat of men were unreliable.**
B22
1.2.3 Physical violence
Physical violence (assault and threat)
Men were significantly more likely than women to experience physical violence in the year prior to the survey.
A little over 400,000 women experienced physical violence in the 12 months prior to completing the survey: this is one in 21 women (4.6%).
Tbl 1: D18
Close to three quarters of a million men experienced physical violence in the 12 months prior to completing the survey: this is one in 12 men (8.5%).
B18
The difference in rates of physical violence for men and women is statistically significant.
Rounding of the numbers in this section
This section uses more rounding than the following sections to help the reader in juggling (at least) two types of victim and/or perpetrator. By removing some of the exact numbers (but still keeping the grid references so that the exact number can be easily found) the comparisons are more immediately apparent to the reader.
Physical assault
Approximately 1.7 times as many men as women experienced physical assault in the year prior to the survey.
263,500 (3%) women experienced physical assault in the 12 months prior to completing the survey.
Tbl 1: D16
461,000 (5.4%) men experienced physical assault in the 12 months prior to completing the survey.
B16
The difference in rates of physical assault for men and women is statistically significant.
The prevalence of physical assault is between 1.3 (for men) and 1.4 (for women) times the prevalence of physical threat.
Physical threat
More men than women reported experiencing a physical threat in the year prior to the survey.
188,900 women experienced physical threat in the 12 months prior to completing the survey.
Tbl 1: D17
352,200 men experienced physical threat in the 12 months prior to completing the survey.
B17
The difference in rates of physical threat for men and women is statistically significant.
1.2.4 No violence
Nineteen out of 20 (94.7%) women did not experience any violence in the last 12 months (8,268,100).
Tbl 1: D11
Nine out of ten (91.3%) men did not experience any violence in the last 12 months (7,729,200).
B11
Why haven’t you described victim characteristics?
Section 1: Violence experienced by women and men aims to provide information on the different patterns of violence experienced by women and men. Although differences in demographics are relevant to this, our focus is on the single demographic variable of sex.
We therefore haven’t included an analysis by demographic characteristics in this section. We do provide this type of analysis in Section 2: Women’s experiences of sexual assault and Section 3: Women’s experiences of partner violence.
2 Perpetrator demographics: Who perpetrated the violence?
The data in this section examines perpetrator types for all types of violence perpetrated against a victim over 15 years of age.
Men are most likely to have experienced violence perpetrated by a stranger
Tbl 4: B16
Women are most likely to have experienced violence perpetrated by a known person, specifically a former partner. Boyfriends/girlfriends/dates were also a key perpetrator of violence against women, albeit a smaller group than cohabiting partner. A similar pattern was seen in male victims, however men reported more violence by friends and acquaintances than by cohabiting or non-cohabiting partners, with strangers being a dominant perpetrator group for male victims.
D20
2.1 Known person
Both women and men are more likely to have experienced violence by a known man than by a known woman.
Male victim
2.26 million men had experienced violence by a known person.[4] This is approximately one in four men in Australia (26.6%).
Tbl 4: B17
1.8 million male victims had experienced violence by a known man (21.5%), of which:
- 1.4 million men had experienced physical assault by a man; and
- Over 100,000 men had experienced sexual assault by a man.
Tbl A1: R28, B28, H28
933,900 men had experienced violence by a known woman, of which:
- 766,800 men had experienced physical assault by a woman; and
- 165,700 men had experienced sexual assault by a woman.
R33, B33, H33
Talking about assault
Please note that the dot points in 2.1-2.2 relate to physical and sexual assault. These numbers do not relate to the broader categories of physical and sexual violence (which include threats).
Graph D: Since the age of 15, number of women and men who experienced violence, reported perpetrator of violence: By sex of victim
Data table for Graph D:
| Perpetrator of violence | Male victim | Female victim |
|---|---|---|
| Stranger | ~3,030,000 | ~1,060,000 |
| Cohabiting partner | ~440,000 | ~1,470,000 |
| Boyfriend/girlfriend/date | ~310,000 | ~980,000 |
| Friend | ~400,000 | ~310,000 |
| Acquaintance or neighbour | ~600,000 | ~870,000 |
Note: Data relates to incidents since the age of 15.
Female victim
One in three, or 3.1 million women had experienced violence by a known person (35.6%).
Tbl 4: D17
More than 2.9 million women reported violence perpetrated by a known man (33.7%), of which:
- 2.1 million had experienced physical assault by a man; and
- 1.3 million experienced sexual assault by a man.
Tbl A1: R11, B11, H11
Less than 0.7 million women report violence perpetrated by known women, of which:
- 480,000 women experienced physical assault by a woman; and
- 49,600 women experienced sexual assault by a woman.
R21, B21, H21
The difference in rates of violence for women and men perpetrated by a known person of the same sex as the victim was statistically significant.
The difference in rates of violence for women and men perpetrated by a known person of the opposite sex to the victim was statistically significant.
Reminder: Current and former cohabiting partner
A current cohabiting partner is a person who, at the time of the survey, the survey respondent was living with in a marriage or de-facto relationship.
A former partner is a person who the survey respondent lived with at some point in a marriage or de facto relationship, but who they no longer live with. This includes:
- a partner who was violent towards the survey respondent during the relationship, but the relationship has now ended;
- a partner who was not violent during the relationship, but has been violent since the relationship ended; and
- a partner who was violent both during and after the relationship.
A former partner has, at some point in time, lived with the survey respondent, however the violence may have started after they stopped cohabiting.
Graph E: Since the age of 15, number of women and men who experienced violence: By intimate partner type and sex of victim
Data table for Graph E:
| Intimate partner type | Female victim | Male victim |
|---|---|---|
| Current cohabiting partner | ~230,000 | ~120,000 |
| Boyfriend/girlfriend/date | ~990,000 | ~310,000 |
| Former cohabiting partner | ~1,270,000 | ~340,000 |
Note: Data relates to incidents since the age of 15.
Intimate partner
Intimate partner is a broad definition of partner and includes partners that a person may or may not be living with. This category includes cohabiting partners, as well as boyfriends, girlfriends and dates.
2.2 Intimate partner
More women than men had experienced violence by an opposite sex partner they may or may not have been living with.
Male victim
694,100 men had experienced violence by a female intimate partner, of which:
- 595,800 men had experienced physical assault by a female intimate partner; and
- 67,500* men had experienced sexual assault by a female intimate partner.
Tbl A1: R34, B34, H34
(Data on male same sex intimate partners was not able to be released separately from the “known person” category.)
Female victim
Close to 2.2 million women reported violence perpetrated by a male intimate partner, of which:
- 1.7 million had experienced physical assault by a male intimate partner; and
over 800,000 had experienced sexual assault by a male intimate partner.
Tbl A1: R12, B12, H12
26,000 women reported violence perpetrated by a female intimate partner, of which:
- 22,000* women had experienced physical assault by a female intimate partner; and
- the number of women who reported that they had experienced sexual assault by a female intimate partner was not able to be reported due to data quality concerns.
R22, B22
The difference in rates of violence for women and men perpetrated by opposite sex perpetrators is statistically significant.
Relationship type vs sexual identity
Some people may date or be in a relationship with a person of the same sex but do not identify as gay, lesbian or bisexual. In the context of the PSS, survey respondents who report violence in a same sex relationship are describing their relationship type. At no point during the survey are respondents asked about their sexual identity.
For more information, see Not all women in same sex relationships are lesbians in Section 3: Women’s experiences of partner violence: 1.1.2.2 Female intimate partner violence.
2.3 Cohabiting partner
More than three times as many women as men reported experiencing cohabiting partner violence. For both women and men, violence was more often reported to have been perpetrated by a former cohabiting partner or a non-cohabiting partner (boyfriend/girlfriend/date) than by a current partner.
Male victim
Just under 0.45 million men have experienced violence perpetrated by a cohabiting partner:
- more than 0.3 million men reported violence perpetrated by a former partner;
- more than 0.1 million reported violence perpetrated by a current partner.
Tbl 4: B18, B20, B19
Most men were victimised by female partners:
- 427,900 had experienced violence perpetrated by a female partner. This is one in 20 men in Australia (5.1%); and
- 26,500* (0.3%*) reported violence by a male partner.
Tbl 6: B40, B20
Female victim
Approximately 1.5 million women have experienced violence by a cohabiting partner:
- 1.3 million women reported violence perpetrated by a former partner; and
- 0.2 million women reported violence perpetrated by a current partner.
Tbl 4: D18, D20, D19
Almost all women who had experienced violence by a cohabiting partner reported that this violence was perpetrated by a male:
- 1,470,200 reported violence by a male partner. This is one in six women in Australia (16.8%); and
- 11,100* (0.1%*) reported violence by a female partner.
Tbl 6: D20, D40
What exactly are we talking about? Cohabiting partners
The category of cohabiting partner includes both former and current partners who have lived with the survey respondent.
A current cohabiting partner is a person who, at the time of the survey, the respondent to the survey was living with in a marriage or de-facto relationship.
A former cohabiting partner is a person who the respondent lived with at some point in a marriage or de facto relationship, but who they no longer live with, and includes:
- a partner who was violent towards the survey respondent during the relationship, but the relationship has now ended;
- a partner who was not violent during the relationship, but has been violent since the relationship ended;
- a partner who was violent both during and after the relationship.
A former partner has, at some point in time lived with the survey respondent, however the violence may have started after they stopped cohabiting.
2.4 Boyfriend, girlfriend or date
Violence by a non-cohabiting partner was a significant proportion of violence experienced by women. This type of violence was reported by considerably fewer men than women.
Male victim
An estimated:
- 18,700* (0.2%*) men experienced violence by a boyfriend or male date; and
- 295,100 (3.5%) experienced violence by a girlfriend or female date.
Tbl 6: B23, B43
Female victim
Close to a million women reported violence by a boyfriend or male date (981,300, 11.2%).
Tbl 6: D23
15,100* (0.2%*) women reported violence by a girlfriend or female date.
D43
2.5 Stranger
Most people who are victimised by a stranger, are victimised by a man. Significantly more men than women reported this type of victimisation.
Male victim
Over three million men had experienced violence perpetrated by a stranger – this is more than one in three men in Australia (35.7%).
Tbl 4: B16
Of men victimised by a stranger, almost all were victimised by a male (2,978,800): 307,900 men were victimised by a female stranger – this is one in ten men victimised by a stranger.
Tbl 6: B18, B38
Female victim
Approximately 1.1 million women had experienced violence perpetrated by a stranger: this is one in eight women (1,068,200, 12.2%). Most of these women were victimised by a male stranger (903,700).
Tbl 4: D16, Tbl 6: D18
There was no statistically significant difference in the number of men (307,900) and women (275,300) who were victimised by a female stranger.
B38, D38
The difference in rates of violence for women and men perpetrated by a stranger of the same sex as the victim was statistically significant.
The difference in rates of violence for women and men perpetrated by a stranger of the opposite sex to the victim was statistically significant.
How can you say it both is and is not statistically significant?
In this section it is possible to test a range of combinations of data for statistical differences. In the paragraph above, only some rates were sufficiently different to be statistically significant.
These differences are statistically significant:
Female victims of male violence (903,700) compared to
male victims of female violence (307,900)
(opposite sex comparison);
Female victims of female violence (275,300) compared to
male victims of male violence (2,978,800)
(same sex comparison).
These differences are not statistically significant:
Female victims of female violence
compared to
male victims of female violence
(same perpetrator type comparison).
I thought it was one in three?
The statistics “one in three women have experienced domestic violence” and “one in three domestic violence victims are men” have both been circulated in Australian public discourse for several years.
Among women, the “one in three” statistic refers to women’s experience of physical violence by any type of perpetrator. It is accurate to say “one in three” women have experienced:
- physical violence by a male or female perpetrator (34.4%);
- violence (physical and/or sexual) by a known male or female perpetrator (35.6%); and
- violence (physical and/or sexual) by a known male perpetrator (33.7%).
As previously discussed, the PSS collects information on individual incidents of violence by a partner rather than a pattern of violence and control, the latter being a common community and professional definition of domestic violence. The statistic from the PSS that relates most closely to domestic violence is that one in six women have experienced violence by a cohabiting partner (see commentary on “Why don’t you just call it domestic violence?” in Section 3: Women’s experiences of partner violence: 1.1 for an explanation of why using the term “domestic violence” may be misleading).
Regarding men, the statement “one in three victims of domestic violence are men” is also sometimes used. This figure relates to the group of men who have experienced violence by a cohabiting partner (male or female) since the age of 15. Specifically, the PSS estimates that 448,000 of the 1,928,000 victims of cohabiting partner violence were men, meaning that men represent 23.2% of this population and women represent 76.8% of this population.
There are several ways that the aforementioned “one in three” statements may be misconstrued:
- Statistics about the experience of incidents of violence do not necessarily mean that a person has experienced a pattern of violence and control over a period of time which is “domestic violence”. The PSS collects information about incidents of violence, not patterns over a period of time (see above).
- In addition, it is important to be clear on the population that is being considered. In the case of men’s experience of violence, the statement “one in three victims of cohabiting partner violence are men” has as its population all victims of violence in Australia (both male and female) from all perpetrators (both male and female). In comparison, the statement “one in three men in Australia experience cohabiting partner violence” has as its population all men in Australia. The first statement is correct, while the second is not – in fact, the second statement refers to the 448,000 adult men reporting cohabiting violence out of the Australian population of adult men and the correct figure would be “one in 20 men in Australia experience cohabiting violence”.
3 Incident characteristics: What happens in an incident of violence?
3.1 Injury
The following statistics relate to people who have experienced physical assault since the age of 15 and describe their injuries in their most recent incident of physical assault.
Both women and men were more likely to suffer fractured or broken bones/teeth when their assailant was male than when they were assaulted by a female perpetrator. Men were injured more often by male assailants than female, whereas women were injured in approximately equal proportions by male and female perpetrators.
In relation to their most recent physical assault by a male, both male and female victims were equally likely to be physically injured and to see a doctor about their injuries. In comparison to male victims, women had more changes in their routine as a result of their injuries. Women were more likely than men to be physically injured and to see a doctor about their injuries from their most recent physical assault perpetrated by a woman.
Graph F: Proportion and number of women and men, experience of injury in most recent incident of physical assault: By sex of victim and sex of perpetrator
Data table for Graph F:
| Perpetrator of violence | Injured | Not injured |
|---|---|---|
| Male victim of male physical assault | ~1,255,500 (54%) | ~1,069,500 (46%) |
| Female victim of male physical assault | ~961,880 (55.6%) | ~768,120 (44.4%) |
| Male victim of female physical assault | ~444,240 (61.7%) | ~275,760 (38.3%) |
| Female victim of female physical assault. | 47.3% | 52.7% |
Note: Data relates to incidents since the age of 15.
Most recent incident (MRI) data and the separation of male and female perpetrators
The data in this section is based on reporting of an individual’s “most recent incident” of a particular type of violence. This means that the results do not refer to whether a person has ever done a particular thing (e.g. sought assistance from police) but rather whether they did so for the most recent instance of that type of violence.
MRI data is collected when the ABS asks a survey respondent about their most recent incident of eight types of violence (sexual assault, sexual threat, physical assault and physical threat by a male or female perpetrator). As part of this module, the participant answers who perpetrated the most recent incident.
MRI data does not provide information about patterns of violence; it only provides information about the most recent incident. For example, a person may have been hit 50 times by their boyfriend and once by their best friend, but if the most recent incident was being hit by their best friend, it will be the only one captured in the MRI data.
The MRI data is exceptionally useful for understanding in detail what happened in one instance of violence. By asking about the most recent incident, the ABS also gets the most salient (and thus, hopefully, accurate) data. By asking a lot of detail about one incident only, respondents are not overburdened and are also less likely to confuse incidents (e.g. “did that happen three times or four times ago?”).
MRI data is collected separately for male and female perpetrators. It is not possible to combine perpetrator types. This means that data in this section is always specific to the gender of the perpetrator and is therefore routinely represented in a 2×2 cube of perpetrator and victim gender.
MRI data is highlighted in orange to remind the reader that it should be used carefully.
Note: In the table below, the symbols and indicate whether there is a statistically significant difference between the statistics for male and female victims (the two columns). This testing has only been completed for the numbers within the row with the symbol.
Table B: Characteristics of physical injury after most recent incident of physical assault: By sex of victim and sex of perpetrator
Male perpetrator:
| Icon | Female victim | Male victim |
|---|---|---|
| In their most recent physical assault by a man, just over half of women were physically injured (55.6%): this is close to a million women. Of women who were physically injured: | In their most recent physical assault by a man, just over half of men were physically injured (54%). This is over 1.25 million men. Of men who were physically injured: Of men who were physically injured: |
| Nearly 900,000 women obtained scratches, bruises or cuts (92.7%). | Over 1.1 million men obtained scratches, bruises or cuts (88.7%). |
| One in 24 women were stabbed, shot or otherwise had a deep wound – this is 39,600* women (4.1%*). | 70,400 men were stabbed, shot or otherwise had a deep wound inflicted: this is one in 18 men (5.6%). |
| 10,400* experienced a miscarriage. | ||
| Less than one in three women saw a doctor about their injuries (300,700, 31.5%). | One in three men saw a doctor about their injuries (419,200, 33.4%). |
| Six out of ten women had changes in routine as a result of their injuries (58.8%). | Three out of ten men had changes in routine as a result of their injuries (30.5%). | |
| Changes in social/leisure activities (298,700, 31.3%), sleeping habits (305,300, 32%), building or maintaining relationships (26.1%, 249,100) were the most common. | One in five men experienced changes to their social/leisure activities (244,600, 19.5%), and one in nine had changes to their work, school or study activities (141,100, 11.3%). |
| Table A10, column B | Table A10, column H |
Female perpetrator:
| Icon | Female victim | Male victim |
|---|---|---|
| In their most recent physical assault by a woman, just over half of women were physically injured (236,000, 52.7%). Of women who were physically injured: | In their most recent physical assault by a woman, less than four out of ten men were physically injured (278,100, 38.3%). Of men who were physically injured: |
| 93.2% of women sustained scratches, bruises or cuts (219,900) | 94.6% of men sustained scratches, bruises or cuts (263,200). |
| Less than 1% of women were stabbed, shot or otherwise had a deep wound inflicted (1,800**, 0.8%**). | Approximately one in 20 men were stabbed, shot or otherwise had a deep wound inflicted (15,900*, 5.7%*). | |
| Less than three out of ten women saw a doctor about their injuries (68,100, 28.9%). | One in seven men saw a doctor about their injuries (40,400*, 14.5%). |
| Half of the women had changes in routine as a result of their injuries (50.1%). | Three out of ten men had changes in usual routine as a result of their injuries (30.8%). | |
| Changes in social/leisure activities (86,800, 36.8%), sleeping habits (42,800, 18.1%) were common. | – | |
| Changes in building or maintaining relationships (35,900, 15.2%) were also common. | The only change in routine to effect more than one in ten men was building and maintaining relationships (35,300, 12.7%). |
| Table A10, columns D and E | Table A10, columns J and K |
The changes to routine in this section relate to those that happen due to physical injuries. Many uninjured people will have also had changes in their usual routine; the experiences of these individuals are not reflected in the information above.
Why are all the similar numbers coming up as non-significant?
You may have noticed that the finding that a third of women and a third of men are physically injured was found to be “not significant”
. Statistical significance testing is a way to test whether numbers are meaningfully different from one another. When it is applied to numbers that are similar, we anticipate that the result will be not significant. This does not mean that this similarity doesn’t matter, but rather indicates that the numbers are, in fact, alike.Instead of reading as meaning “this difference is not statistically significant” it may be more helpful in these cases to think of it as meaning “there is no (statistically significant) difference between X and Y”.
Graph G: Proportion of women and men, incidents involving alcohol, whether victim or perpetrator believed to be under the influence of alcohol or other drugs, most recent incident: By sex of victim
Data table for Graph G:
| Group affected by drugs/alcohol | Male victim | Female victim |
|---|---|---|
| Perpetrator affected by drugs/alcohol | 45% | 14% |
| Victim affected by drugs/alcohol | 95% | 95% |
Note: Data relates to incidents since the age of 15. This data is limited to most recent incident of physical assault by a male.
3.2 Alcohol and other drugs
The ABS asks people who had experienced violence since the age of 15 to describe the drug and alcohol use of both victim and perpetrator in their most recent incident of that specific form of violence. This data is collected separately for each of the 8 types of violence (sexual assault, sexual threat, physical assault and physical threat by a male and female perpetrator), however below we look mainly at their most recent incident of physical assault by a male.
Male victim
In nearly 1.6 million incidents, alcohol was believed to contribute to the most recent physical assault by a male. This is about seven out of ten incidents of physical assault of a male by another male (67.7%).
Tbl 18:H14, I14
Regarding their most recent physical assault by a male, male victims reported that:
- they were affected by drugs or alcohol in about 45% of these cases; and
- the perpetrator was affected by drugs or alcohol in 95% of cases.
Female victim
In over 900,000 incidents, alcohol or other drugs were believed to contribute to the most recent physical assault by a male. This is over half the incidents of physical assault of a female by a male (53.4%). A similar percentage was reported for:
- Sexual assault by a male (474,600, 55.7%); and
- Physical threat by a male (351,700, 50%).
Tbl 18: H26, H24, H30
Regarding their most recent physical assault by a male, female victims reported that:
- they were affected by drugs or alcohol in about 14% of these cases; and
- the perpetrator was affected by drugs or alcohol in 95% of cases.
What does “contributed to the incident” mean?
Survey respondents are asked whether they think drugs or alcohol contributed to their most recent incident of physical assault. If they answer “yes” to this question, they are then asked about the nature of the contribution, including whether they were under the influence of alcohol or other substances; whether alcohol or drugs were added to their drink without their consent; and whether they believed the perpetrator was under the influence of alcohol or drugs.
For each scenario, alcohol and other substances are asked about separately.
Graph H: Number of women and men, most common location of most recent incident of physical assault by a male: By sex of victim
Data table for Graph H:
| Location of assault | Male victim | Female victim |
|---|---|---|
| Place of entertainment | ~800,000 | ~90,700 |
| Respondent’s home | ~200,000 | ~1,040,000 |
Note: Data relates to incidents since the age of 15.
3.3 Location of incident
The following statistics relate to people who had experienced physical assault since the age of 15 and describe the location of their most recent physical assault.
Men were most likely to experience physical assault in a place of entertainment. Women were most likely to experience physical assault in their own home.
Male victim
For men, a place of entertainment was the most common place for their most recent physical assault:
Close to 800,000 men were physically assaulted by another male while in a place of entertainment. This is about a third of all most recent incidents of a man being physically assaulted by another man (34.1%).
Tbl 19: F17, G17
In addition, over 600,000 men experienced their most recent physical assault by a man outside. More than 300,000 men experienced this type of assault in their workplace.
F18, F16
Men were nine and a half times more likely than women to be physically assaulted by a man in a place of entertainment, with 90,700 women physically assaulted by a male in a place of entertainment. Approximately 100,000 women were physically assaulted by another woman in this location.
F32, H32
Female victim
For women, the most common place for their most recent physical assault to occur was their own home:
Over one million women experienced physical assault by a male in their own home. This represents six out of ten physical assaults of a woman by a man (61.5%).
Tbl 19: F28, G28
Approximately 2.7 times more women than men were assaulted by an opposite sex perpetrator in their home, with close to 400,000 physically assaulted by a woman in this location. In addition, close to 200,000 men were physically assaulted by another man in their home.
F13, H13
Whose home is it?
When a victim and perpetrator live in the same house, the house is categorised as the victim’s home. This means that a house that is categorised as a perpetrator’s house is not the residence of the victim, but a victim’s house may or may not be the perpetrator’s home. The ABS categorises residences in this way as the focus of the survey is on the experiences of the victim of the violence, not the perpetrator.
The most common place for a woman to experience her most recent assault was in a private residence – this was true across all assault types by same and opposite sex perpetrators.
For men, there is much more variation in the most common location of his most recent assault: assault perpetrated by women was most likely to occur in the victim’s home, while violence by another man most commonly occurred in a place of entertainment/recreation or an “other” site outside of the home or workplace .
Table C: Most common location of most recent incident of physical or sexual assault: By sex of victim and sex of perpetrator
Physical assault
| Sex of perpetrator | Female victim | Male victim |
|---|---|---|
| Opposite sex perpetrator | Victim’s own home (1,055,200) | Victim’s own home (388,700) |
| Same sex perpetrator | Victim’s own home (130,200) | Place of entertainment/recreation (793,100) |
Sexual assault
| Sex of perpetrator | Female victim | Male victim |
|---|---|---|
| Opposite sex perpetrator | Victim’s own home (381,600) | Victim’s own home (56,500*) |
| Same sex perpetrator | Perpetrator’s home (where this is not also the victim’s home) (9,400*) | “Other” (including place of study, motel, serviced apartment, while waiting or using public transport etc.) (20,700**) |
Table 19: Rows 13-19, 28-34
This sub-section has provided some detail of the nature of violent incidents experienced by women and men. Of note is how, for both women and men, injuries tended to be more severe when the assault is perpetrated by a male. In addition, violence in the context of alcohol and other drug use was reported more often by male victims than by female victims. In the next section, we examine the post-incident impacts of violence, as well as the actions that victims take after a violent episode.
What does it mean when you don’t have a statistical testing symbol for a section of text?
Statistical testing has only been performed for a minority of data points. These points were chosen because we thought it was likely that the data would be compared; or, that this type of testing was important in understanding the survey data. Thus, most statistical testing has occurred in this first section of the report that looks at the experiences of violence of women and men.
A statistical testing symbol is used for all instances where a statistical significance test has been completed. If there is no symbol, this means that the test has not been run by the researcher.
4 Post-incident actions and impacts: What happens after an incident of violence?
4.1 Police contact and court appearance
Women and men report similar progressions through the criminal justice system, with about a third of victims contacting police and less than 15% indicating that the perpetrator went to court. While there is some variation by perpetrator type, the overall pattern of steady withdrawal from the criminal justice system is consistent.
Below we provide details of police and court contact for men’s and women’s most recent physical assault. Data on police and court contact is collected through the most recent incident module of the PSS and therefore is unable to be aggregated for different violence types. We have chosen to focus on physical assault as it is the most common form of violence for both women and men, and therefore analysis of this data provides the most robust estimates. Less detailed data is available for sexual assault.
Victims aren’t always aware of judicial responses
It is important to note that information related to the charging of perpetrators and their attendance at court is from the viewpoint of the victim. This information is collected through the survey and relies on the victim’s understanding of the criminal justice response to their assault. In some cases, the victim may not be aware of the judicial processes related to their assault. This may affect the accuracy of the rates reported below.
4.1.1 Physical assault
The following statistics relate to people who have experienced physical assault since the age of 15 and describe their engagement with the justice system in relation to their most recent incident of physical assault.
Police contacted
A little under a third of victims contacted police about their most recent physical assault.
Tbl A11: Row 21
Regarding women and men who had experienced physical assault by an opposite sex perpetrator, the proportion of female victims who contacted the police was higher than the proportion of male victims.
There is no statistically significant difference in the proportion of victims who contacted police when comparing women and men who had experienced physical assault by a same sex perpetrator.
Perpetrator charged
In approximately a third of cases where the victim has gone to the police about their most recent physical assault, the respondent reported that the perpetrator was then charged.
Tbl A11: Row 26
There is no statistically significant difference in the proportion of perpetrators charged when comparing women and men who had experienced physical assault by an opposite sex perpetrator.
When considering male perpetrated physical assault, the rate varied slightly:
- 27.8% for male victims; and
- 39% for female victims.
Perpetrator went to court
In about eight out of ten cases, the respondent reported that the charged perpetrator went to court.
Tbl A11: Row 31
There was no statistically significant difference in this rate, regardless of the sex of the victim or perpetrator.
Why are these numbers different?
The statistics above are calculated by determining the percentage of people who have experienced a particular type of violence who go onto the next stage in the criminal justice process.
In contrast, the proportions below are calculated as a percentage of all men/women who have experienced a particular type of violence.
For instance, 219,600 women who were physically assaulted by a man reported that the perpetrator was charged. This is both:
- one in eight cases (12.8%) of women’s most recent incident of physical assault by a man (as below); and
- four in ten (39%) cases where the female victim had gone to the police about her most recent incident of physical assault by a man (as above).
Both statistics are correct – they are just looking at the same information in a different way.
What do you mean by “charged”?
A person is said to have been charged if they are charged with a criminal offence. This includes, but is not limited to, being charged with a breach of a domestic violence order.
Table D: Police involvement after most recent incident of physical assault: By sex of victim and sex of perpetrator
Male perpetrator:
| Female victim | Male victim |
|---|---|
| Regarding their most recent physical assault by a man (1,716,300): | Regarding their most recent physical assault by a man (2,322,800): |
| In one in three instances, the woman contacted police (32.8%): this is more than half a million women. | In one in three instances, the man (victim) contacted police (32.1%): this is three quarters of a million men. |
| In one in eight cases, the victim reported that the male perpetrator was charged (219,600, 12.8%). | In one in 11 cases, the victim reported that the male perpetrator was charged (207,200, 8.9%). |
| In one in nine cases, the victim reported that the male perpetrator went to court (191,700, 11.1%): this is 87.3% of cases where the perpetrator was charged. | In one in 14 cases, the victim reported that the male perpetrator went to court (163,300, 7%): this is 78.8% of cases where the perpetrator was charged. |
| Table A11, columns B and C | Table A11, columns H and L |
Female perpetrator:
| Female victim | Male victim |
|---|---|
| Regarding their most recent physical assault by a woman (448,000): | Regarding their most recent physical assault by a woman (726,000): |
| In one in three instances, the woman (victim) contacted police (31.6%): this is 141,400 women. | In less than one in four instances, the man contacted police (18.8%): this is 136,400 men. |
| In one in nine cases, the victim reported that the female perpetrator was charged (49,000, 10.9%). | In one in 18 cases, the victim reported that the female perpetrator was charged (40,400*, 5.5%). |
| In one in 11 cases, the victim reported that the female perpetrator went to court (42,100, 9.4%): this is 85.9% of cases where the perpetrator was charged. | In one in 22 cases, the victim reported that the female perpetrator went to court (33,100*, 4.5%): this is 81.8% of cases where the perpetrator was charged. |
| Table A11, columns D and E | Table A11, columns J and K |
With the exception of the last row of each square, the proportions above are calculated using the number of people having experienced the violence as the total (i.e., the first number in each square).
As discussed earlier in this section, both women and men were more likely to experience violence perpetrated by a man – for men, this violence was mostly perpetrated by strangers or by someone they knew (but were not in an intimate relationship with), while for women this violence tended to be perpetrated by a partner. It is likely that these differences in incident characteristics influence the difference in criminal justice system responses. For example, it seems logical that male-on-male violence resulted in less charges being laid, as laying charges against a stranger is likely to be more logistically difficult than laying charges against a partner.
As disaggregated sexual assault data for male sexual assault victims is not available, a full comparable analysis for sexual assault is not included in this publication.
The following statistics relate to people who have experienced sexual assault since the age of 15 and describe their actions in relation to their most recent sexual assault.
Table E: Police involvement after most recent incident of sexual assault: By sex of victim and sex of perpetrator
Sexual assault committed by a same sex perpetrator is a low prevalence crime. In the context of the PSS, this means that estimates related to these incidents have very high RSEs. Thus, even though more men (33.5%**) than women (4.3%**) had contacted police about being sexually assaulted by a same sex perpetrator, the difference in these numbers was not significant.
Regarding sexual assault committed by an opposite sex perpetrator, women were more likely to contact police than men.
Overall, this section demonstrates that police contact was more common for physical assault than sexual assault and that, regardless of the assault type, the sex of the victim or the sex of the perpetrator, only a minority of people reported their assault to police.
4.2 Advice and support
For both physical and sexual assault, and for both male and female victims, the majority of help seeking related to assaults perpetrated by males. This reflects both: a) the higher absolute numbers of victims in these categories; and b) the higher proportion of victims who sought advice and support about assaults perpetrated by men.
Telling someone is different to getting advice or support
In relation to their most recent incident of violence, the PSS asks participants both about sources of advice and support and people they have told about the incident. The PSS distinguishes between these two types of telling.
To tell someone about an incident only requires that you inform them about the incident: it does not require that the person give you any advice or support.
If you said to someone “John hit me the other day” – this would be telling them about the incident.
You would be getting advice or support if you said to someone “John hit me: could you help me work out what to do about it?”.
Graph I: Proportion and number of women and men, whether sought advice or support about most recent incident of physical assault: By sex of victim and sex of perpetrator
Data table for Graph I:
| Victims of violence | Sought advice | Did not seek advice |
|---|---|---|
| Male victim of male violence | 44.9% | 55.1% |
| Female victim of male violence | 68.1% | 31.9% |
| Male victim of female violence | 35.3% | 64.7% |
| Female victim of female violence | 60.7% | 39.3% |
Note: Data relates to incidents since the age of 15.
4.2.1 Physical assault
The following statistics relate to people who have experienced physical assault since the age of 15 and describe their actions in relation to their most recent physical assault.
Overall, women sought advice more than men. The highest proportion and largest number of victims who sought advice and support for their most recent physical assault were female victims of male violence.
Table F: Seeking of advice and support after most recent incident of physical assault: By sex of victim and sex of perpetrator
| Sex of perpetrator | Female victim | Male victim |
|---|---|---|
| Male perpetrator | Of women who had experienced physical assault by a man (1,716,300): Close to seven out of ten women who had been physically assaulted by a male had sought support for their most recent incident (1,168,600, 68.1%). | Of men who had experienced physical assault by a man (2,322,800): A little under half of the men who had been physically assaulted by another man sought advice or support for their most recent incident (1,043,000, 44.9%). |
| Female perpetrator | Of women who had experienced physical assault by a woman (448,000): Six out of ten women had sought support when the most recent assault was perpetrated by a woman (271,800, 60.7%). | Of men who had experienced sexual assault by a woman (726,000): A bit over a third of men who were physically assaulted by a woman had accessed support for their most recent incident (256,600, 35.3%). |
| Tables 16 and A11 |
Regarding their most recent physical assault, men sought support and advice less often than women (44.9% vs 68.1% for physical assault by a male perpetrator, 35.3% vs 60.7% for physical assault by a female perpetrator).
Tbl 16: C13, C25, C14, C26
Graph J: Proportion and number of women and men, whether sought advice or support about most recent incident of sexual assault: By sex of victim and sex of perpetrator
Data table for Graph J:
Note: Data relates to incidents since the age of 15.
4.2.2 Sexual assault
The following statistics relate to people who have experienced sexual assault since the age of 15 and describe their actions in relation to their most recent sexual assault.
Both women and men sought advice and support more often for sexual assaults by a male perpetrator than by a female perpetrator.
Table G: Seeking of advice and support after most recent incident of sexual assault: By sex of victim and sex of perpetrator
There was no statistically significant difference in the rate of advice seeking for women and men who experienced sexual assault by a same sex or opposite sex perpetrator.
Regarding sexual assault committed by an opposite sex perpetrator, women were more likely to contact police than men.
4.3 Time off work
The following statistics relate to people who had experienced violence since the age of 15 and describe whether they took time off work for their most recent physical or sexual assault.
One in ten employed men, and one in five employed women had taken time off work in the year after their most recent physical assault by a male.
Most recent incident of physical assault by an opposite sex perpetrator
238,600 women took time off work as a result of their most recent physical assault by a male: this represents 20% of the women who had experienced this type of assault and were working during that period.
Tbl 20: B11
47,500* men took time off work as a result of their most recent physical assault by a female: this is 7.6% of men who experienced this type of assault and were in work during this period.
B14
Most recent incident of physical assault by a same sex perpetrator
22,900 women took time off as a result of their most recent physical assault by a female: this is 7.8% of women who experienced this type of assault and were in work during this period.
Tbl 20: B22
199,200 men took time off work in the 12 months after their most recent incident of physical assault by a man: this is 10.4% of men who experienced this type of assault and were in work during this period.
B13
Most recent incident of sexual assault by an opposite sex perpetrator
93,200 women who had experienced sexual assault by a man took time off work in the year following their most recent incident. This is:
- 10.9% of all women who had experienced sexual assault by a man; and
- 17% of women who experienced this type of assault and were working during this period.
Tbl 20: B19
8,300** men took time off work as a result of a sexual assault by a female: this is 7.2% of men who were sexually assaulted by a woman and were working during this time.
B12
Most recent incident of sexual assault by a same sex perpetrator
2,100** women took time off as a result of their most recent sexual assault by a woman. This is 11.4%** of women who were sexually assaulted by a woman and were working during this time.
Tbl 20: B20
2.8%** of men who were sexually assaulted by another man took time off work after their most recent incident. The estimated number of men who took time off work after a sexual assault by a male perpetrator was not available.
B11
Between 7.8% (physical assault by a female) and 20% (physical assault by a male) of employed women reported taking time off work in the year following the assault. In contrast, between 2.8% (sexual assault by a male) and 7.8% (physical assault by a male) of employed men reported taking time off due to their most recent assault.
4.4 Fear and anxiety
When compared to male victims, 1.9 times as many women were afraid in the 12 months after their most recent physical assault by a man (524,100 vs 1,007,900).
Tbl A11: H10, B10
When we look at the percentage of victims who had experienced anxiety in the year after the assault, women who were physically assaulted by a male were:
- 2.6 times more likely to feel fear or anxiety than men who had been physically assaulted by a male; and
- 4.3 times more likely to feel fear or anxiety than men who had been physically assaulted by a female.
Table H: Fear and anxiety after most recent incident of physical assault: By sex of victim and sex of perpetrator
| Sex of perpetrator | Female victim | Male victim | |
|---|---|---|---|
| Male perpetrator | Of women physically assaulted by a man (1,716,300):
This is an estimated 1,007,900 women | Of men physically assaulted by a man (2,322,800): Five in 20 men reported having experienced anxiety or fear in the year after the most recent incident (22.6%). This is an estimated 524,100 men. | |
| Female perpetrator | Of women physically assaulted by a woman (448,000):
This is an estimated 180,300 women. | Of men physically assaulted by a woman (726,000): Three in 20 men reported having experienced anxiety or fear in the year after the most recent incident (13.6%). This is an estimated 98,600 men. | |
| Table 17, Rows B and F |
More than half of women physically assaulted by a man reported feeling fear and anxiety after their most recent assault. This is the only group of physical assault victims where a majority of respondents reported feeling fear and anxiety.
Graph K: Proportion of women and men who experienced anxiety and fear after their most recent incident of violence: By sex of victim and sex of perpetrator
Data table for Graph K:
| Location of assault | Female victim | Male victim |
|---|---|---|
| Male perpetrator | 58% | 22.5% |
| Female perpetrator | 41% | 14% |
Note: Data relates to incidents since the age of 15.
In relation to their most recent physical assault, both time off work and fear and anxiety affected a greater proportion of female victims than male victims. Women seek advice and support more often than men, possibly due to the increased likelihood that they are dealing with violence perpetrated by someone they know and/or who they live with. Engagement with the police and courts is a consequence of a minority of assaults, regardless of the sex of the victim or perpetrator. Both women and men experience substantial, and at times debilitating, impacts after a violent incident.
In the next section, we examine in detail data related to women’s experiences of sexual assault.
Section two: Women’s experiences of sexual assault
Sexual assault is experienced by one in six women in Australia. These assaults are almost all perpetrated by men known to the victim. In comparison to other assault types, a smaller percentage of women contacted police about sexual assault. Sexual assaults have substantial post-incident impact, with most women reporting being fearful or afraid in the year after their most recent sexual assault by a male. One in six women have never told anyone about their most recent sexual assault by a male.
This section examines the nature and impact of sexual assault, including its prevalence in the Australian female population; victim demographics; perpetrator demographics; incident characteristics; and post-incident actions and impacts.
Contents for this section
1. Prevalence: How many women are sexually assaulted?
2 Victim demographics: Who does sexual assault happen to?
2.2 State or territory of residence
3 Perpetrator demographics: Who perpetrated the sexual assault?
3.1.1 Sexual assaut by intimate partners
3.1.2 Sexual assault by others
3.2 In the 12 months prior to the survey
4 Incident characteristics: What happened in a sexual assault incident?
4.2.1 Consumption of alcohol and other drugs
4.2.2 Consumption of alcohol and other drugs by perpetrator type
5 Post-incident actions and impacts: What happens after a sexual assault?
5.1.1 Police contact – comparison to other assault types
5.1.2 Contact with police by victim demographics
5.1.3 Contact with police by perpetrator type
5.1.4 Reasons for not contacting the police by perpetrator type
5.2.2 First person told by perpetrator type
5.2.3 Sought advice or support
5.2.4 Advice seeking by victim demographics
5.2.5 Source of advice by perpetrator type
5.3.1 Time off work by perpetrator type
5.3.2 Time of work by victim demographics
5.3.3 Women not in the workforce
Women only from now on!
Section 1 of this report gives an overview of the gendered nature of violence in order to put the rest of the report into context. In the remaining sections – and consistent with the scope of this report and ANROWS’s mandate under the National Plan to Reduce Violence against Women and their Children 2010-2022 – we focus on a description of the victimisation of women.
1 Prevalence: How many women are sexually assaulted?
1.2 Since the age of 15
Sexual violence (assault or threat)
Women were more than four times as likely as men to have experienced sexual violence.
Over their adult lifetime, 1.7 million women had experienced sexual violence. This is approximately one in five women (19.4%).
Tbl 1: D39
Sexual assault
Nearly 1.5 million women had experienced sexual assault since the age of 15. This represents:
- 17.1% of all women in Australia; and
-
two out of five (42%) women who had experienced any form of violence since the age of 15.
Tbl 1: D37
Of women who had experienced sexual assault, 99% had experienced sexual assault by a man.
1.3 In the last 12 months
In the year prior to the survey, just over 100,000 women had experienced sexual assault and/or sexual threat.
Tbl 1: D23
87,800 women were sexually assaulted in the year prior to the survey. This is:
- Approximately one in five (18.8%) women who had experienced any form of violence in this period; and
- 1% of the entire female population of Australia.
D21
Violence vs assault
The PSS defines assault as a subset of violence:
- Sexual assault is defined as “an act of a sexual nature carried out against a person’s will through the use of physical force, intimidation or coercion, and includes any attempts to do this. This includes rape, attempted rape, aggravated sexual assault (assault with a weapon), indecent assault, penetration by objects, forced sexual activity that did not end in penetration and attempts to force a person into sexual activity. Sexual assault excludes brief unwanted sexual touching”.
- Sexual violence is defined as sexual assault or the threat of assault (where the victim reasonably believes that the assault could be completed).
This means that all women who have experienced sexual assault will have experienced sexual violence, and more women will have experienced sexual violence than experienced sexual assault.
But isn’t that just wordy?
You may have noticed that the report says “women in Australia” not “Australian women” – this is because you don’t need to be an Australian citizen to complete the survey, you just have to live here.
2 Victim demographics: Who does sexual assault happen to?
When compared to the 12-month national rate of sexual assault, young women (aged 18-24 years) have a higher rate and older women (aged 55+ years) have a lower rate. Apart from these two groups, there was no statistically significant variation in prevalence identified in the data. Research from other sources suggest more between-group differentiations than the PSS has identified. This difference from other research is likely to reflect two key factors:
- Victim demographic analysis must use data related to victimisation in the 12 months prior to the survey. As victim demographics change over time (people get older, they move state, they get a new job), it would be misleading to use lifetime data (i.e. since the age of 15). However, the use of prior year data reduces the sample size, thus increasing the RSE and making it more difficult for variations between groups to be classified as statistically significant.
- Challenges in accessing marginalised communities due to language and structural constraints (see below).
Overall, this section identifies minimal demographic variation in 12 month prevalence of sexual assault.
Graph L: In the last 12 months, proportion of women experiencing sexual assault: By sociodemographic characteristics
Data table for Graph L:
| Sociodemographic characteristic | Percentage |
|---|---|
| National rate | 1.0% |
| 18-24 years | 2.2% |
| 55+ years | 0.2% |
Note: Includes only sociodemographic characteristics with a 12 month sexual assault rate that is statistically significantly different from the national 12 month sexual assault rate.
Statistical significance has been determined against the national rate
- Statistical testing has been completed for the information in this section.
- All significance testing has been against the national rate for sexual assault in the last 12 months (1%).
- The significance of differences in rates within a group (e.g. between different ages) has not been calculated.
What does statistically significant mean?
Statistical significance testing is a way of determining whether the difference seen between numbers is likely to be a result of a “real” difference or as a result of the research sample. When we say that a difference is “statistically significant”, we are indicating that, according to accepted statistical modelling, in at least 19 out of 20 cases, the difference is “real” and not a chance variation in sample characteristics.
Another way of understanding this is to say that based on a statistical test, we can be 95% sure the result is not by chance but is an accurate representation of the phenomenon; in this case, the difference in rates of sexual assault experienced by particular demographic groups as compared to the national rate.
2.1 Broad age groups
The rate of sexual assault varied significantly with age. Young women were at increased risk when compared to the national average, with 2.2%* (23,500*) of women aged 18-24 years having experienced sexual assault in the last 12 months.
Tbl A3: C18
Older women were at decreased risk when compared to the national rate, with 0.2%* (7,000)* of women aged 55 years and older having experienced sexual assault in the previous 12 months.
C22
The difference between the rates for women aged 18-24 and those over 55 years and the national rate was statistically significant.
2.2 State or territory of residence
Rates of sexual assault of women during the last 12 months did not vary significantly between jurisdictions. Six out of eight jurisdictions had a rate of sexual assault between 0.9%* and 1.2%*. The ACT had a rate of 1.8% and Victoria had a rate of 0.7%*, however there was no statistically significant difference in rates when compared to the national average.
Tbl A3: C8 – 15
Why are you talking about differences that are not statistically significant?
Sometimes the estimated populations were quite different for two groups of respondents but the difference between the groups was not statistically significant. This happens when there is a high RSE for one or both estimates.
We report these non-statistically different numbers as they provide a complete picture of the PSS data and allow the reader to note the full range of estimates that are of interest to them. We do, however, also acknowledge that the differences are unlikely to reflect “real life” differences.
As a compromise between comprehensibility and statistical exactness, we have attempted to provide commentary around non-statistically different numbers without explicitly comparing them.
2.3 Country of birth
Last 12 months
Just over 1% of women who were born in Australia had experienced sexual assault in the last 12 months (67,600, 1.1%). For women who were born overseas, the rate was 0.7%* (20,100*). The difference between these rates and the national rate was not statistically significant.
Tbl 15:C14, C18
Since the age of 15
The difference in rates by country of birth was more noticeable when considering sexual assault since the age of 15. 19.2% (1,159,700) of women born in Australia and 12.4% (334,300) of women born overseas had experienced adult sexual assault. For women born in countries where English was not the main spoken language the rate was 9.3% (162,800), which is less than half the rate for women born in Australia.
Tbl 15:G14, G18, G17
There is a statistically significant difference between the national rate (17.1%) and the rates for women: born overseas; born in a non-English speaking country; and, born in Australia.
G11
What is a main English speaking country?
The ABS defines the United Kingdom, the Republic of Ireland, New Zealand, Canada, South Africa and the United States of America as “main English speaking countries”.
A “non main English speaking country” is any country that is not listed as a “main English speaking country.”
Tbl A17: Footnotes
Does this seem surprising to you?
The ABS acknowledges that the PSS may under-represent people from culturally and linguistically diverse communities. This is because the survey is primarily completed in English. While the ABS provides some foreign language interviewers, this is not always sufficient to ensure that all selected respondents who don’t speak English are able to complete the survey.
2.4 Labour force
There was no difference in the rate of sexual assault for women who were employed and those that were unemployed or not in the labour force: the rate of sexual assault experienced for both groups in the 12 months prior to the survey was 1%.
Tbl A3:C25, C26
How does the PSS define “employed”?
- The PSS uses the standard ABS definition of employment. It includes as “employed”, amongst other scenarios, a person who in the week prior to the interview:
- worked at least an hour for pay (or without pay in a family business);
- was on strike;
- was on workers compensation (and expected to return to work); or
- was an employer.
Glossary
2.5 Level of education
There was no statistically significant difference in rate of sexual assault for women who have (0.9%) and have not (1.1%) received a post-school qualification (e.g. a vocational training qualification or university degree).
Tbl A3:B30, B29
2.6 Disability status
1.5% of women with a disability had experienced sexual assault in the last year (42,800). In comparison, 0.8% of women without a disability had experienced sexual assault in the same time period (45,000).
Tbl A3: B53, B54
Women with a disability represent about half of all female victims of sexual assault in the 12 months before the survey.
The difference between these rates and the national rate was not statistically significant.
What counts as disability?
The PSS uses a standard measure of core activity limitation that is used in other ABS surveys. The measure assesses the extent to which a person “needs help, has difficulty, or uses aids or equipment with [self-care, mobility or communication]”. A person may be defined as having a profound, severe, moderate or mild disability, depending on the level of core activity limitation that they experience.
A person must have experienced, or be likely to experience, the limitation for at least 6 months in order for them to be classified as a person who has a disability or long-term health condition.
The PSS only selects respondents from private dwellings. Therefore, no women or men living in institutional care settings were interviewed as part of the survey. This is likely to affect the quality of the data related to this population.
Glossary
2.7 Socio-economic status
The ABS provides a range of measures of socio-economic status. The measures selected for this analysis were:
- household weekly income (the amount of money a single household receives each week); and
- the Socio-Economic Indexes For Areas (SEIFA) ranking for the area in which the respondent lives (this measure considers various indicators of socio-economic status for the area in which a person lives).
24,500 (1.8%) women from the most disadvantaged areas (lowest SEIFA quintile) experienced sexual assault in the 12 months prior to the survey. The number of sexual assaults in the other quintiles was between 15,200* and 16,400* (0.8-1%*).
Tbl A3: B46, B47-B50
What is a socio-economic quintile?
The ABS has developed several measures of socio-economic status. The data collected in the ABS Census of Population and Housing allows for the calculation of Socio-Economic Indexes For Areas (SEIFA) rankings for areas. One of these is the Index of Relative Socio-economic Advantage and Disadvantage (IRSAD). Data about the location of PSS respondent’s households can be considered within these rankings. The IRSAD “summarises information about the economic and social conditions of people and households within an area, including both relative advantage and disadvantage measures”.
IRSAD data is presented using quintiles: a quintile is a “grouping that result[s] from ranking households by [the IRSAD rate] and then dividing the population into… five equal groups”.
Household income is also grouped by quintile.
For more information on the IRSAD, see: https://www.abs.gov.au/ausstats/abs@.nsf/Lookup/2033.0.55.001main+features100042011
Where are the statistics on Aboriginal and Torres Strait Islander people?
The PSS does not publish data relating to a person’s Aboriginal and Torres Strait Islander status because they are unable to collect a representative sample of this population.
The ABS and the PSS Survey Advisory Group have agreed that the current survey may not be culturally appropriate for collection from all Aboriginal and Torres Strait Islander persons, with a large amount of investigation, engagement and design work required to ensure maximum data quality. Further, given that approximately one in five Aboriginal people live in remote areas, it is practically difficult to obtain a sample that would allow the ABS to create meaningful estimates related to violence experienced by Aboriginal and Torres Strait Islander people. Some Aboriginal and Torres Strait Islander people in urban and regional areas of Australia may be randomly selected to be part of the survey, however we do not know the extent of this sampling as this data is not collected.
The ABS has a specific Aboriginal and Torres Strait Islander statistics program and acknowledges that quality statistics for Aboriginal and Torres Strait Islander Australians are of critical importance. They are continuing to work with stakeholders and communities to find the best ways to collect data on Aboriginal and Torres Strait Islander Australians’ experiences of violence.
3 Perpetrator demographics: Who perpetrated the sexual assault?
This sub-section examines the relationship between the victim and perpetrator of a sexual assault. The data used in this section relates to the part of the PSS where a respondent is asked about their relationship to the perpetrator at the time of the survey (as opposed to their relationship at the time of the assault). We examine three sets of perpetrator data – the more inclusive “since the age of 15” data, and the two sub-sets of “in the last 12 months” and “most recent incident”. In all cases, women were most likely to be assaulted by someone known to them, with intimate partners (including former and current cohabiting partner, as well as boyfriend/girlfriend/dates) being a substantial portion of this population.
Three kinds of perpetrator data
There are two main reasons why we have provided multiple accounts of the relationship of the victim to the perpetrator:
- The most common perpetrator varies depending on the time frame used.
- The different populations of perpetrators relate to different sections of this report. Specifically:
- Lifetime data (since the age of 15) is most valuable when considering prevalence (part 1 of this section).
- Previous year data is used for victim demographics (part 2 of this section).
- Most recent incident data is used for both incident characteristics (part 4) and post-incident actions and impacts (part 5).
Due to the variation in the data, it is valuable to include all three datasets as each provides a different piece of the puzzle, with none “more true” than the others.
3.1 Since the age of 15
The information in this section:
- Is useful for considering the overall pattern of experiences of sexual assault;
- Can be related to Section 2: 1.1 Prevalence: Since the age of 15; and
- Relates to male perpetrators.
1.5 million women have experienced sexual assault since the age of 15: this is one in six women in Australia.
Tbl 1: D37
3.1.1 Sexual assault by intimate partners
Intimate partner (includes cohabiting partner and boyfriend/date)
Since the age of 15, 805,900 women were sexually assaulted by a male intimate partner: this is one in 11 women in Australia (9.2%).
Tbl A1: H12
The number of women sexually assaulted by a female partner was too small to report.
H22
Cohabiting partner
At the time of the survey:
- 44,200 women were in a cohabiting relationship with a man who had sexually assaulted them (current partner). This is 3% of women who had been sexually assaulted by a male perpetrator since the age of 15.
- 354,100 were separated from a male cohabiting partner that sexually assaulted them (former partner). This is 23.7% of women who have been sexually assaulted by a male perpetrator since the age of 15.
Tbl A1:H13, H14
Boyfriend/date
Close to half a million women had been sexually assaulted by a boyfriend or male date (469,900). This is a greater number of women than the number who had been sexually assaulted by a male cohabiting partner.[5]
Tbl A1:H15
3.1.2 Sexual assault by others
Women were equally likely to be assaulted by a (male or female) cohabiting partner (397,500) as by a (male or female) stranger (335,000).
Tbl 12: D33
Reminder!
The category of cohabiting partner includes both former and current partners who have lived with the survey respondent in a marriage or de facto relationship.
The category of intimate partner includes both cohabiting partners and boyfriends/girlfriends/dates.
Graph M: In the last 12 months, number of women experiencing sexual assault: By relationship to male or female perpetrator
Data table for Graph M:
| Relationship | Number of sexual assaults |
|---|---|
| Current partner | ~11,000 |
| Former partner | ~17,000 |
| Boyfriend/girlfriend/date | ~24,500 |
| Other known person | ~25,500 |
| Stranger | ~17,000 |
3.2 In the 12 months prior to the survey
The information in this section:
- is useful for considering recent assaults and immediate service need;
- can be related to Section 2: 2. Victim demographics;
- relates to both male and female perpetrators (female perpetrators cannot be reported by themselves due to data quality concerns).
A similar pattern of perpetrator types was found in the “12 month” and “since the age of 15” data.
Intimate partner
Of the 87,800 women sexually assaulted in the last year, 75,500 (85%) were sexually assaulted by person known to them.
Tbl A2:H17
Two thirds of these women were assaulted by cohabiting partner, boyfriend, girlfriend or date (52,400).
H12
Of the women who were sexually assaulted by a male intimate partner:
- 20.4% (10,700*) were assaulted by a current partner;
- 32.6% (17,100*) were assaulted by a former partner; and
- 46.9% (24, 600*) were assaulted by a boyfriend, girlfriend or date.
H13, H14, H15
Stranger
The same number of women were sexually assaulted by a former cohabiting partner (17,100*) as by a stranger (17,300*).
Tbl A2: H10
Graph N: Women who had experienced sexual assault by a male, most recent incident: By relationship to perpetrator (proportion)
Data table for Graph N:
| Relationship | Percentage |
|---|---|
| Former male partner | 25% |
| Boyfriend/date | 24% |
| Friend/acquaintance/employer/co-worker | 23% |
| Male stranger | 16% |
| Other family member | 5% |
| Current male partner | 4.5% |
| Other known male | 3% |
Note: As a person can only have one “most recent incident” this is the only data to add up to 100%. Data includes most recent incidents since the age of 15.
3.3 Most recent incident
The information in this section:
- Can be related to Section 2: 4. Incident characteristics and 5. Post-incident actions and impacts; and
- Relates to male perpetrators and cannot be provided as a gender aggregate as the data for male and female perpetrators is collected separately in the most recent incident module.
Most recent incident (MRI) data has particular limitations that means it should be used carefully. Please see the text box in Section 1: 1.3: Injury (Most recent incident data and the separation of male and female perpetrator) for more detail. MRI data is highlighted in orange to help the reader be aware of when this data is being used.
Sexual assault
For most women, their most recent sexual assault by a male was perpetrated by:
- a previous partner (212,300, 24.9%);
- a boyfriend or date (including an ex) (204,200, 23.9%); or
- a friend, acquaintance, employer or co-worker (192,700, 22.6%).
Tbl A4:G10, G12, G13
About one in 22 women who had been sexually assaulted were assaulted by their current partner in their most recent incident (4.5%, 38,000).
G9
Sexual threat
When considering a woman’s most recent sexual threat, the majority were perpetrated by:
- strangers (35.4%); or
- friends, acquaintances, employers or co-workers (29.1%)
Tbl A4: I8, I13
Why do things get (even more) wordy when we are talking about perpetrators?
The PSS is a victim survey, not a perpetrator survey. This means that it asks people about their experiences of victimisation: it does not ask about experiences of perpetration.
It is not valid to assume that patterns of perpetration mirror patterns of victimisation. For example, imagine that Judy was sexually assaulted by Paul. When asked about her most recent incident, Judy answers regarding this incident. However, since this incident, Paul has assaulted two other women. If he was to answer questions about his most recent perpetration, he would not answer about the incident with Judy.
The data presented here represent victims’ perceptions of incidents.
4 Incident characteristics: What happened in a sexual assault incident?
Almost all of the detailed data on sexual assault comes from the most recent incident (MRI) data module. This data has specific limitations that make it difficult to report in some contexts.
MRI data is collected when the ABS asks a study respondent about their most recent incident of eight types of violence. Two of these types are sexual assault: by a male, and by a female.
MRI data has several limitations that are outlined in detail in Section 1: 3. Incident characteristics. These limitations are a consequence of the fact that MRI data only tells us what happened in the most recent incident.
MRI data is highlighted in orange to help the reader be aware that this information should be used with caution.
The statistics in Part 4 of this section, Incident characteristics, relate to a woman’s most recent incident of sexual assault by a male perpetrator.
4.1 Injury
A quarter of a million women reported being physically injured in their most recent sexual assault by a male. Scratches, bruises and cuts were the most common form of injury. Four out of ten women went to see a doctor due to their assault. Most women had changes in their routine due to their injury.
4.1.1 Nature of injury
Of women who had experienced sexual assault by a male perpetrator, one in three reported that they were physically injured in their most recent incident: this is over a quarter of a million women (284,000).
Tbl A10: F9
For women who were physically injured:
- 88.4% (251,000) experienced scratches, bruises or cuts;
- 11.1% (31,600) experienced fractures or broken bones/teeth; and
- 2.6%** (7,300*) were stabbed, shot or had another form of deep wound.
F14, F15, F16
8,800* women reported a miscarriage as an injury from their most recent sexual assault.
F17
More separations
When a person completes the PSS, they are asked a series of questions about their most recent incident of sexual assault. For the sake of the survey, sexual assault by a male and by a female are asked about separately.
This means that we cannot combine most male and female perpetrator sexual assault data.
More detail on the issue of “double counting” is provided in the text box in Section 3: 3.6 Violence and pregnancy: Why are former and current partner separated?
The changes to routine in this section relate to those that happen due to physical injuries. Many uninjured women will have also had changes in their usual routine, and these women’s experiences are not reflected in the information above.
See also: Section 1: 3.1 Injury.
4.1.2 Medical consultation
Four out of ten (105,700, 37.2%) women who were physically injured in their most recent sexual assault by a male consulted a doctor about their injuries.
Tbl A10: F22
In comparison, approximately three out of ten women consulted their doctor for their most recent physical assault (31.5% for physical assault by a male, 28.9% for physical assault by a female).
C22, E22
The PSS asks respondents whether they have seen a doctor about the injuries they sustained in an incident of violence. Some women may have also accessed medical services after a sexual assault for other reasons such as STI testing, pregnancy testing and/or contraception, meaning that the number of women who have seen a doctor after a sexual assault may be larger than what is reported in the PSS.
4.1.3 Impacts of injury
Most women who were injured in their most recent sexual assault by a male reported a change in their usual routine in the 12 months after the incident. These changes were as a result of their physical injury, with the three most common impacts being:
- changes in their sleeping habits (147,200, 51.8%);
- changes in social/leisure activities (131,000, 46.1%); and
- changes in building and maintaining relationships (120,100, 42.3%).
Tbl A10: G35, G27, G33
Graph O: Women who were physically injured in their most recent sexual assault by a male, since the age of 15: By type of injury experienced
Data table for Graph O:
| Type of injury | Percentage |
|---|---|
| Scratches, bruises or cuts | 88% |
| Fractures or broken bones/teeth | 11% |
| Stabbed, shot or other deep wound | 2% |
| Miscarried | 3% |
4.2 Alcohol and other drugs
Please see Section 1: 3.2 Alcohol and other drugs for a definition of “contributes to the incident.”
The use of alcohol and other drugs was a common feature of sexual assault incidents with just over half the women survey indicating that this was a contributing factor in their most recent sexual assault by a male. More women assessed that their perpetrator’s (rather than their own) drug and alcohol use contributed to their most recent sexual assault.
4.2.1 Consumption of alcohol and other drugs
Over half the women surveyed indicated that drugs or alcohol contributed to their most recent sexual assault by a male perpetrator (474,600, 55.7%).
Tbl 18: I24
One in five female victims of sexual assault reported that they were under the influence of drugs or alcohol (162,800, 19.1%). This is one in three women who had reported that drugs/alcohol contributed to their most recent sexual assault.
E24
Close to half the respondents reported contributing alcohol/drug use[6] by the perpetrator at the time of the assault (48.2%, 410,900). This represents nine out of ten incidents where the victim indicated that drugs/alcohol contributed to the incident.
G24
Of all incidents of sexual assault where women indicated that alcohol and other drugs contributed to the incident, it was mostly the perpetrator’s use that was assessed as being a contributing factor.
4.2.2 Consumption of alcohol and other drugs by perpetrator type
What’s the deal with the Venn diagrams?
Venn diagrams are used in a number of places in this report to help emphasise where populations do (and do not) overlap. In the section above, they represent how some incidents of violence may involve both victim and perpetrator being under the influence of drugs and/or alcohol – these instances are counted in both perpetrator and victim populations, but are only counted once for the total.
Venn diagrams are intended as a visual reminder of the complexity of the data.
Reminder!
The category of cohabiting partner includes both former and current partners who have lived with the survey respondent in a marriage or de facto relationship.
Two out of three sexual assaults by a stranger were assessed by the victim to have contributing alcohol/drug use (87,400, 65.1%).
Tbl A5:K24
One in two incidents involving known persons, including cohabiting partners, were assessed by the victim to have had contributing alcohol/drug use (387,100, 53.9%).
K25
Of all most recent incidents of sexual assaults by a male perpetrator that involved a contributing use of drug/alcohol (474,600):
- 18.4% were perpetrated by a stranger (87,400);
- 29.4% were perpetrated by a cohabiting partner (139,500); and
- 52.2% were perpetrated by a known person (excluding cohabiting partners, but including boyfriends and male dates) (247,600).
J28, J24, J26, J27
For information about:
The role of alcohol and other drugs in partner violence, see Section 3: 3.4 Alcohol and other drugs.
Perpetrator characteristics for sexual assault, see Section 2: 3.3 Most recent incident.
4.3 Location of incident
Three quarters of women reported that their most recent sexual assault by a male occurred in a private residence, of which, close to 70% were perpetrated by a cohabiting partner or boyfriend/date .
Private residence
The following statistics relate to a woman’s most recent incident of sexual assault by a male perpetrator.
Three out of four sexual assaults occurred in a private residence (627,600, 73.6%), of which:
- 44.7% (381,600) occurred in the victim’s home;
- 14% (119,800) occurred in the perpetrator’s home; and
- 14.8% (126,100) occurred in another person’s home.
Tbl 19: C28, C29, C30
Almost all (93%) sexual assaults perpetrated by a male that occurred in the home were committed by a man known to the victim. Of these most recent sexual assaults by a known person:
- Four out of ten (243,500, 41.7%) were perpetrated by a cohabiting partner.
- Three out of ten (167,200, 28.7%) were perpetrated by boyfriend or date.
Three out of ten (172,600, 29.6%) were perpetrated by an other known male such father, son, brother, teacher, friend etc.
Table A5: Additional analysis, B24-B28
One in 14 (7%) sexual assaults perpetrated by a male in a private residence were perpetrated by a stranger.
Less than 10% of assaults occurred:
- outside (e.g., laneway, carpark, park) (62,400, 7.3%);
- while using or waiting for public transport (5000*, 0.6%)[7];
- in the respondent’s workplace (19,500, 2.3%); or
- in a place of entertainment (52,600, 6.2%).
Tbl 19:C33, C31, C32
Whose home is it?
When a victim and perpetrator live in the same house, the house is categorised as the victim’s home. This means that a house that is categorised as a perpetrator’s house is not the residence of the victim, but a victim’s house may or may not be the perpetrator’s home.
Place of entertainment
Of the 52,600 women who reported their most recent sexual assault was perpetrated by a man in a place of entertainment, a statistically equivalent number of assaults were committed by strangers as known men (including cohabiting partners) (28,000*, 24,600).
Tbl A5: D28, D24, D25
Outside and while using or waiting for public transport
More women experienced their most recent sexual assault while outside or using or waiting for public transport than while in a place of entertainment.
Of the 67,400 women who experienced their most recent sexual assault while outside or waiting for public transport:
- 53.7% were perpetrated by a male stranger (36,200); and
- 46.4% were perpetrated by a known male (31,300).
Tbl A5: F28, F24, F25
For more information about location of partner violence, see Section 3: 3.5 Location of incident.
Graph P: Proportion of women victims, location of most recent incident of sexual assault by a male
Data table for Graph P:
| Location | Percentage |
|---|---|
| Private residence | ~74% |
| Place of entertainment | ~6% |
| Outside/public transport | ~7.5% |
| Other | ~12% |
Note: Data relates to incidents since the age of 15.
In relation to their most recent sexual assault by a male, most women reported that the incident occurred in a private residence, by a man known to them. A slight majority of victims said that the use of drugs and/or alcohol was a contributing factor in their assault. Most women were not physically injured during the assault.
5 Post-incident actions and impacts: What happens after a sexual assault?
5.1 Police and court contact
One fifth of women reported their most recent sexual assault by male to police, and just over one in 20 women indicated that the perpetrator had ended up in court. Although women were more likely to perceive an assault by a stranger as a crime, this did not result in a marked increase in prosecution for this perpetrator type.
5.1.1 Police contact – comparison to other assault types
Most recent sexual assault
One in five women reported their most recent sexual assault by a male to the police (162,800, 19.1%).
Tbl 17: B29, B31, B32
In contrast:
- one in three women contacted police about their most recent physical assault by a male (562,600, 32.8%); and
- one in three women contacted police about their most recent physical assault by a female (141,400, 31.6%).
In the 12 months prior to the survey
Of women who had experienced sexual assault by a male in the year prior to the survey, one in six reported their most recent incident to the police (16.9%*, 14,800*): five out of six (83.1%), or an estimated 72,800, women did not report their most recent incident of sexual assault by a male to the police.
Tbl 17: C16, E16
A smaller percentage reported to the police their most recent incident of sexual assault (16.9%, 14,800), than reported:
- a physical assault by a male (28.3%, 61,000); or
- a physical assault by a female (41.3%, 25,300*).
C16, C18, C19
For information about police contact for all types of partner violence, see Section 3: 4.1 Police and court contact.
Graph Q: Proportion of women who contacted police about their most recent assault: By assault type
Data table for Graph Q:
| Location | Percentage |
|---|---|
| Sexual assault by a male | 19% |
| Physical assault by a male | 33% |
| Physical assault by a female | 31.5% |
Note: Data relates to incidents since the age of 15.
Figure C: Most recent incident of sexual assault by a male: Police to court flowchart
Based on Tbl A14.
Text alternative:
Women who experienced sexual assault
Sexual assault: 852,800
Whether most recent incident was perceived as a crime
Incident perceived as a crime: 305,600
This is 35.8% of women who have been sexually assaulted.
Incident not perceived as a crime:
365,900 perceived the incident as wrong but not a crime (43%).
153,400 perceived the incident as something that just happens (18%).
Whether contacted police about most recent incident
Police contacted: 162,800
This is: 19.1% of women who have been sexually assaulted.
Police not contacted: 690,100
Whether victim believed perpetrator was charged for most recent incident.
Perpetrator charged: 59,000
This is: 6.9% of women who have been sexually assaulted. 36.2% of cases where the woman contacted police.
Perpetrator not charged: 103,800
Whether victim believed perpetrator went to court for most recent incident.
Perpetrator went to court: 48,700
This is: 5.7% of women who have been sexually assaulted. 29.9% of cases where the woman contacted police. 82.5% of cases where the perpetrator was charged.
Perpetrator did not go to court: 10,300*
Note: A small number of women who did not perceive the assault as a crime contacted the police
5.1.2 Contact with police by victim demographics
There was no statistically significant difference in the rates of police contact for:
- Women who were employed (10,100*, 21%*) and women who were unemployed or not in the labour force (4,600**, 11.8%**).
- Women who had a post-school qualification (8,200**, 18.1%*) and those who did not (15.5%*, 6,500*).
- Women who had a disability or long-term health condition (7,200*, 16.9%*), and those who did not (7,500*, 16.8%*).
Tbl A16: C9, C10, C14, C13, C21, C22
See also: Section 2: 2. Victim demographics, for relevant sub-population data.
Graph R: Women’s most recent sexual assault by a male perpetrator, whether incident perceived as crime at the time and police involvement
Data table for Graph R:
| Location | Percentage |
|---|---|
| Perceived as a crime | 36% |
| Reported assault to police | 19% |
| Perpetrator charged | 7% |
| Perpetrator went to court | 6% |
Note: Information on perpetrator’s involvement in the justice system from victim’s reports in PSS only.
5.1.3 Contact with police by perpetrator type
The following information outlines stages of engagement with the justice system by perpetrator type and relates only to a woman’s most recent sexual assault by a male:
Perceived as crime
Women were twice as likely to perceive their most recent sexual assault by a male as a crime if the perpetrator was a stranger (61,400, 60.6%), as compared to:
- a male cohabiting partner (83,400, 33.3%); or
- an other known male (140,800, 30.1%).
Tbl A14: C10, E10, G10
Reported assault to police
One in seven (14%, 65,500) women whose most recent sexual assault was by a known male (other than their cohabiting partner) reported their assault to police.
G17
In comparison:
- one in three (46,900, 34.9%) women sexually assaulted by a stranger contacted the police; and
- one in five (50,400, 20.1%) women sexually assaulted by a cohabiting partner contacted the police.
C17, E17
Perpetrator charged
Of women who contacted police about their most recent sexual assault by a male:
- four out of ten reported that the perpetrator was charged if the assault was perpetrated by:
- a cohabiting partner (20,900*, 41.5%); or
- an other known male (26,100*, 39.9%*).
- one in four (11,900*, 25.5%*) who were sexually assaulted by a stranger reported that the perpetrator was charged.
E46, G46, C46
Perpetrator went to court
Of women who reported that the male perpetrator of their most recent sexual assault was charged:
- 99.9% reported that the perpetrator went to court if the assault was by a stranger;
- 72.4% reported that the perpetrator went to court if the assault was by a “cohabiting partner”; and
- 82.8% reported that the perpetrator went to court if the assault was by an other known male.
C51, E51, G51
For information on perpetrator demographics for sexual assault, see Section 2: 3.3 Most recent incident.
Reminder!
The category of cohabiting partner includes both former and current partners who have lived with the survey respondent in a marriage or de facto relationship.
The table below outlines women’s engagement with the justice system based on the perpetrator type for a woman’s most recent incident of sexual assault by a male.
Figure D: Police involvement after most recent incident of sexual assault by a male: By relationship to perpetrator
Based on Tbl A14
Data table for Figure D:
| Action | By their cohabiting partner in their most recent incident (250,300) | By a known male other than their cohabiting partner in their most recent incident (468,300) | By a stranger in their most recent incident (134,300) |
|---|---|---|---|
| Perceived the incident as a crime | One in three (83,400, 33.3%) | Approximately one in three (140,800, 30.1%) | Approximately two in three (81,400, 60.6%) |
| Reported that they contacted the police about the incident | One in five (50,400, 20.1%) | One in seven (65,500, 14%) | One in three (46,900, 34.9%) |
| Reported that the perpetrator was charged | 8.3% (20,900*) This is: 41.5% of cases where the woman contacted police. | 5.6% (26,100*) This is: 39.9%* of cases where the woman contacted police. | 8.9% (11,900*) This is: 25.5%* of cases where the woman contacted police. |
| Reported that the perpetrator went to court | 6.1% (15,200*) This is: 30.2% of cases where the woman contacted police. 72.4% of cases where the perpetrator was charged. | 4.6% (21,600*) This is: 33% of cases where the woman contacted police. 82.8% of cases where the perpetrator was charged. | 8.8% (11,900*) This is: 25.4% of cases where the woman contacted police. 99.9% of cases where the perpetrator was charged. |
Note: A small number of women who did not perceive the assault as a crime contacted the police
5.1.4 Reasons for not contacting the police by perpetrator type
Common reasons for not contacting the police
Women reported a range of reasons for not reporting their most recent sexual assault by a male to police.
Tble A14:
Approximately half of women reported a main reason that was either “did not regard it as a serious offence or a crime” or “did not want to ask for help/felt they could deal with it by themselves”. This trend was present regardless of the perpetrator type.
Additional analysis
Three out of ten women whose most recent sexual assault was by a cohabiting partner said that the main reason they did not report the incident was because of fear of the person responsible (55,900, 28%). This is between five and eight times the percentage of women who said that this was their main reason when the assault was perpetrated by:
- a stranger (3,100**, 3.6%**); or
- an other known male (21,100, 5.2%).
E38, C38, G38
One in five women whose most recent sexual assault was by a stranger indicated that the main reason that they did not report the incident to police was that they did not “trust the police/think they would believe me/think there was anything they could or would do” (17,500, 20%). This is about double the percentage of women who said that this was their main reason when the assault was perpetrated by:
- a cohabiting partner (17,000, 8.5%); or
- an other known male (44,200, 11%).
C37, E37, G37
Uncommon reasons for not contacting the police
In only 3.8% (26,400) of cases did the woman indicate that the main reason for not reporting her most recent sexual assault was that she did not want the person responsible arrested. Further disaggregation by perpetrator type was not possible, with perpetrator type data for this reason only available for cohabiting partner (11,400*, 5.7%*).
I35, E35
1.6% of women said that the main reason they did not report their sexual assault was cultural or language reasons (11,100).
I40
For information on perpetrator demographics for sexual assault, see Section 2: 3.3 Most recent incident.
The table below outlines the main reasons women did not contact police by perpetrator type for a woman’s most recent sexual assault by a male. When answering this question in the survey, participants could only nominate one main reason.
Table I: Police involvement after a woman’s most recent incident of sexual assault by a male perpetrator, select main reason for not contacting police: By relationship to perpetrator
5.2 Advice and support
One in six women have not told anyone about their most recent sexual assault by a male. Of those women that have told someone, women were most likely to first disclose their assault to a “friend, family member, work colleague or minister of religion”. Women were also most likely to get advice and support from this group, with “counsellor, support work or telephone hotline” and “GP or health professional” also common sources of advice and support.
Please see Section 3: 4.2 Advice and support, for detail on help seeking for women who experience partner physical assault.
Telling someone is different to getting advice or support
According to the PSS, to tell someone about an incident only requires that you inform them about the incident: it does not require that the person give you any advice or support.
If you said to someone “John wanted to have sex and wouldn’t take no for an answer” – this would be telling them about the incident.
You would be getting advice or support if you said to someone “John made me have sex when I didn’t want to: could you help me work out what to do about it?”.
5.2.1 Disclosure
One in six women had not told anyone about their most recent sexual assault by a male (134,100, 15.7%): most of these women were sexually assaulted by their cohabiting partner (76,600).
Tbl A9: H77, F77
Of the 718,700 women who had told someone about their most recent sexual assault by a male:
- three quarters spoke first to a friend, family member, work colleague or minister of religion (531,600, 74%);
- one in 12 spoke first to their GP or other health professional (59,800, 8.3%); and
- one in 15 spoke first to the police (49,200, 6.8%).
H75, H72, H74
5.2.2 First person told by perpetrator type
Regardless of who assaulted them, women were most likely to first tell a friend, family member, work colleague or a minister of religion.
The table below outlines the most common first person told by perpetrator type for a woman’s most recent sexual assault by a male. This table tells us who women are most likely to tell first about their sexual assault.
Table J: Women’s most recent incident of sexual assault by a male perpetrator, first person told: By relationship to perpetrator
| Person told | Of women physically assaulted by their cohabiting partner: | Of women physically assaulted by their cohabiting partner: | Of women physically assaulted by their cohabiting partner: |
|---|---|---|---|
| Most common first person told | Friend/family member/work colleague/minister of religion. (117,200, 46.8%) | Friend/family member/work colleague/minister of religion. (317,100, 67.7%) | Friend/family member/work colleague/minister of religion. (97,200, 72.4%) |
| Second most common first person told | Counsellor, support worker or telephone hotline. (26,000, 10.4%) | GP or health professional. (31,100, 6.6%) | Police. (11,200*, 8.4%*) |
| Third most common first person told | Police. (25,000*, 10%*) | “Other” person/service such as refuge/shelter/government housing, community services or legal/financial service. (18,300**, 3.9%**) | GP or health professional. (8,500*, 6.3%*) |
| Never told anyone | 18.7% (46,800) | 16.4% (76,600) | 8%* (10,700*) |
| Grid reference | Table A9: column D | Table A9: column F | Table A9: column B |
Note: Women can only “first tell” a single person, meaning that they can only select one answer for this question and the total will equal 100%.
5.2.3 Sought advice or support
Three out of five women sought support or advice for their most recent sexual assault by a male (505,400, 59.3%).
Tbl 16: C23
Of the half a million women who sought advice or support for their most recent sexual assault by a male, some of whom received support from more than one source:
- three quarters sought advice or support from a friend, family member, work colleague or minister of religion (375,000);
- a third sought advice or support from a counsellor, support worker or telephone hotline (185,600); and
- a third sought advice or support from a GP or other health professional (183,800).
Tbl A9: H59, H68, H64, H63
“First told” is different to “sought advice”
Although similar, the data for “first told” and “sought advice” provides us with different insights:
- “Sought advice” data shows all the types of person that the victim sought advice from after their assault – this data gives a sense of the number of professionals (and lay people) who need to be comfortable dealing with a disclosure and providing support to a victim.
- “First told” data provides us with information about who women first told about their assaults – these people are likely to need specific skills, as the first disclosure may be more distressing than subsequent disclosures.
5.2.4 Advice seeking by victim demographics
In regards to their most recent sexual assault by a male:
- three quarters of employed women sought advice or support (36,800, 76.3%); and
- half of the women who were unemployed or not in the labour force sought advice or support (19,400*, 49.4%).
Tbl A16: G9, G10
There was no statistically significant difference in rates of advice seeking for:
- women who had post-school qualification (30,400*, 67.2%) and those who did not (25,800, 61.1%);
- women who were born in Australia (45,400, 67.3%) and those who were born overseas (10,800*, 53.8%*); and
- women who have a disability or long-term health condition (28,600*, 67%), and those who did not (27,700*, 61.8%).
G14, G13, G17, G18, G21, G22
See also: Section 2: 2. Victim demographics for relevant sub-population data.
5.2.5 Source of advice by perpetrator type
Regardless of who sexually assaulted them, women were most likely to seek advice and support for their most recent sexual assault from a friend, family member, work colleague or minister of religion.
The table below outlines the most common sources of support by perpetrator type for a woman’s most recent sexual assault by a male. Women may have sought support and advice from multiple sources.
Table K: Women’s most recent incident of sexual assault by a male perpetrator, sources of support and advice: By relationship to perpetrator
| Source of advice | Of women sexually assaulted by their cohabiting partner: | Of women sexually assaulted by a known male other than their cohabiting partner: | Of women sexually assaulted by a stranger: |
|---|---|---|---|
| Most common source of advice | Friend/family member/work colleague/minister of religion. (85,300, 34.1%) | Friend/family member/work colleague/minister of religion. (227,600, 48.6% ) | Friend/family member/work colleague/minister of religion. (62,200, 46.3%) |
| Second most common source of advice | Counsellor, support worker or telephone hotline. (73,200, 29.2%) | GP or health professional. (86,000, 18.4%) | GP or health professional. (34,700, 25.8%) |
| Third most common source of advice | GP or health professional. (63,200, 25.5% ) | Counsellor, support worker or telephone hotline. (79,800, 17%) | Police. (33,600*, 25%) |
| Grid reference | Table A9: column D | Table A9: column F | Table A9: column B |
For information on perpetrator demographics for sexual assault, see Section 2: 3.3 Most recent incident.
5.3 Time off work
93,200 women reported that they took time off work after in the 12 months after their most recent sexual assault by a male. This represents:
- 10.9% of all women who had experienced a sexual assault; and
- 17% of women who were working in the 12 months after the assault.
Tbl A6: H32, I32
The data below relates only to a woman’s most recent sexual assault by a male.
See also Section 3: 4.3 Time off work for detail on time off work for women who experience partner violence.
5.3.1 Time off work by perpetrator type
When considering women who were in the workforce during the year after their most recent assault:
- One in four women who were assaulted by a stranger took time off work (22.5%*).
- One in five women who were assaulted by a cohabiting partner took time off work (19.8%).
- One in seven women who were assaulted by a known person (excluding cohabiting partner) took time off work (14%).
Tbl A6: Additional analysis of data
See also Section 2: 3.3 Most recent incident for information on perpetrator demographics for sexual assault.
5.3.2 Time of work by victim demographics
One in six employed women took time off work in the year after their most recent sexual assault (17%).
In instances where the perpetrator was a stranger:
- one in six employed women born overseas took time off work (15.5%**); and
- one in four employed women born in Australia took time off work (24.2%*).
In incidents where the perpetrator was a cohabiting partner, employed women who were born in a non-main English speaking country were twice as likely to take time off work than employed women born in Australia (18% vs 37.8%**).
Tbl A7: Additional analysis of data
See also Section 2: 2.3 Country of birth for relevant victim demographic information.
5.3.3 Women not in the workforce
306,000 women who were sexually assaulted reported that they were unemployed or not in the workforce for the 12 months after their most recent assault. Of these women:
- 34.1% (104,500) were assaulted by a cohabiting partner;
- 53.3% (163,000)were assaulted by a known person other than a cohabiting partner; and
- 12.6% (38,600) were assaulted by a stranger.
Tbl A7: P36, L36, N36, J36
The category of cohabiting partner includes both former and current partners who have lived with the survey respondent in a marriage or de facto relationship.
5.4 Psychological impacts
Fear and anxiety are a common response to sexual assault. Women were equally likely to experience fear and anxiety in the year after the assault if their most recent incident was perpetrated by a cohabiting partner or a stranger. However, due to the higher absolute number of assaults by known males (including boyfriends/dates), a greater number of women reported feeling fear and anxiety after assaults by this type of perpetrator.
Six out of ten women had experienced fear or anxiety after their most recent incident of sexual assault by a male: this is over half a million women (517,600, 60.7%).
Table A13: H10
When reporting their most recent incident of sexual assault by a male:
- Three quarters of women who were sexually assaulted by a male cohabiting partner reported being anxious or afraid for their personal safety during the 12 months after the incident (185,100, 74%).
- Two thirds of women who were sexual assaulted by a male stranger reported being anxious or afraid for their personal safety during the 12 months after the incident (86,200, 64.2%).
- Half of women reporting sexual assault by a known male other than a cohabiting partner reported being anxious or afraid for their personal safety during the 12 months after the incident (246,300, 52.6%).
E10, C10, G10
Women were more likely to feel anxiety and fear after their most recent incident of sexual assault by a male if the perpetrator was a cohabiting partner when compared to an assault by a known male (but not when compared to an assault by a male stranger).
See also Section 3: 4.4 Psychological impacts, for detail on fear and anxiety for women who have experienced partner violence.
Graph S: Proportion and number of women who experienced anxiety and fear after their most recent sexual assault by a male: By relationship to perpetrator
Data table for Graph S:
| Relationship | Experienced fear and anxiety | Did not experience fear and anxiety |
|---|---|---|
| Male stranger | 64.2% (~85,000) | 35.8% (~48,000) |
| Other known male | 52.6% (~247,000) | 47.4% (~223,000) |
| Male cohabiting partner | 74% (~185,000) | 26% (~65,000) |
Note: Data relates to incidents since the age of 15.
This sub-section has outlined a range of post-incident impacts of sexual assault. A fifth of women reported their most recent sexual assault to the police, with approximately 5% indicating that the perpetrator went to court. Most women spoke to someone about their assault, although disclosure was not as common for women who were sexually assaulted by their cohabiting partner. Sexual assault frequently resulted in women experiencing anxiety and fear, with women who were either in a cohabiting relationship with the perpetrator or were victimised by a stranger more likely to feel anxiety.
Using a similar report structure, the following section examines women’s experiences of partner violence.
Section three: Women’s experiences of partner violence
Section three of this report provides a detailed examination of the PSS data relating to women’s experiences of partner violence. One in six women reported violence by a partner they had lived with (cohabiting partner) and one in four reported violence by a partner they may or may not have lived with (i.e. a combined total for cohabiting partner and boyfriend/girlfriend/date).
Similar to the previous section, in this section we examine prevalence in the Australian female population, victim demographics, incident characteristics and post-incident actions and impacts. Due to the additional data collection in the PSS related to partner violence, this chapter is able to provide significantly more detail on incident characteristics and post-incident impacts.
For high level prevalence and demographic data we have included a new, more inclusive, category of partner. The term intimate partner is used to refer to this new category, which includes both cohabiting partners and boyfriend/girlfriend/dates. This new category is valuable in understanding the full extent of partner violence in Australia.
Contents for this section
1 Prevalence: How many women does partner violence happen to?
1.1.2 Intimate partner violence (broad definition)
1.1.2.1 Male intimate partner violence
1.1.2.2 Female intimate partner violence
1.1.3 Boyfriend, girlfriend or date violence
1.1.4 Cohabiting partner violence
1.1.4.1 Former and current cohabiting partner
1.1.4.2 Former cohabiting partner only
1.2.2 Intimate partner violence (broad definition)
1.2.3 Cohabiting partner violence
2 Victim demographics: Who does partner violence happen to?
2.2 State or territory of residence
2.4 Labour force participation
3 Incident characteristics: What happens in partner violence incidents?
3.2 How recently did violence occur?
3.3 Emotional abuse by a partner
3.3.3 Anxiety and fear due to emotional abuse (since the age of 15)
3.3.4 Link between emotional abuse and cohabiting partner violence
3.6.1 Current cohabiting partner
3.6.2 Former cohabiting partner
3.7 Violence witnessed by children
3.7.1 Current cohabiting partner
3.7.2 Former cohabiting partner
4 Post-incident actions and impacts: What happens after a partner violence incident?
4.1.1 Contact with police by victim demographics/a>
4.1.2 Contact with police by extent of violence
4.2.3 Advice seeking by victim demographics
4.2.4 Advice seeking by extent of violence
4.4.1 Anxiety and fear in the 12 months after violence
4.4.2 Fear by extent of violence
4.4.3 Fear and anxiety by type of violence
4.4.4 Fear and anxiety by type of perpetrator
4.4.5 Changes in routine due to fear and anxiety
4.5.1 Temporary separations from a current partner
4.5.2 Temporary separations prior to final separation from former male partner
4.5.3 Reasons for returning to partner
4.5.4 Final separation from former partner
4.5.5 Reasons for last separation
1 Prevalence: How many women does partner violence happen to?
1.1 Since the age of 15
One in four women in Australia have experienced violence by an intimate partner (broadly defined) – approximately two-thirds of these women have lived with the violent partner at some time. Of women who have lived with their violent partner, most had experienced more than one incident of violence.
1.1.1 All violence
Since the age of 15, two out of five women in Australia had experienced some form of violence (3,560,600, 40.8%).
Tbl 4: E13
Close to three million women, or one in three women in Australia experienced violence by a male who they knew[8](2,943,200, 33.7%).
Tbl A1:S11
One in four women had experienced violence by a male intimate partner (broadly defined – see below) (2,194,200, 25.1%). Women who have experienced male intimate partner violence represent three quarters of women who have experienced violence by a known male.
S12
See also Section 3: Partner violence: 1.2 Violence in the last 12 months.
Graph T: Proportion of women experiencing partner violence since the age of 15: By perpetrator type
Data table for Graph T:
| Perpetrator type | Proportion |
|---|---|
| Boyfriend/girlfriend/date | 11% |
| Cohabiting partner | 17% |
| Intimate partner | 25.5% |
Note: A woman may experience violence by both a boyfriend/girlfriend/date or a cohabiting partner but will only be counted once in the intimate partner total.
1.1.2 Intimate partner violence (broad definition)
Note: Intimate partner violence is an aggregate prevalence category comprised of boyfriend/girlfriend/date and cohabiting partner. Some women will have experienced violence by both a cohabiting partner and boyfriend/girlfriend/date. In order to avoid double-counting, these multi-victimised women are included only once in the intimate partner category. Data relates to incidents since the age of 15.
In order to distinguish intimate and cohabiting partner data, these data items have been coloured.
1.1.2.1 Male intimate partner violence
All violence
If we use a broad definition of intimate partner that includes male cohabiting partners, boyfriends and male dates, then since the age of 15:
Close to 2.2 million women have experienced at least one incident of violence by a male intimate partner: this is one in four women (25.1%).
Tbl A1: R12, S12
Can I compare sexual assault and partner violence statistics?
Not really. The way information is collected in the PSS means that an individual respondent can show up in multiple groups in the final estimates. The PSS groups respondents into “populations” based on their experiences of violence:
Partner violence is defined as:
- any type of violence
- perpetrated by a particular type of person
Sexual assault is defined as:
- a particular type of violence
- perpetrated by any type of person
A woman who is sexually assaulted by her cohabiting partner will show up in the “partner violence” data, but it will not be possible to identify that the violence she experienced from her partner was sexual assault.
(Partner violence encompasses four “types” of violence perpetrated by cohabiting partners: physical assault, physical threat, sexual assault and sexual threat – respondents who are considered to have experienced partner violence may have experienced one or more of these types, but we cannot tell which type/s).
In addition to showing up in the “partner violence” data, a woman who is sexually assaulted by her cohabiting partner may show up in the “most recent incident” data, but only if her most recent sexual assault was perpetrated by her partner. For a woman whose most recent incident of sexual assault was perpetrated by someone other than her partner, the ABS will have no detailed information about the sexual assault committed by her partner. Moreover, the data for MRI by a cohabiting partner may not be representative of all sexual assaults by a cohabiting partner.
The population of women whose most recent incident of sexual assault was perpetrated by their cohabiting partner is a sub-set of the partner violence population. This means that when considering the data presented here, the “sexual assault” and “partner violence” populations cannot be compared to one another.
Physical violence
Over 1.8 million women have experienced physical violence by a male intimate partner:
Tbl A1: F12
Over 1.7 million women have experienced physical assault by a male intimate partner: this is one in five women in Australia (19.6%).
B12 C12
432,100 women reported physical threat by a male intimate partner: this is one in twenty women in Australia[9] (4.9%).
D12 E12
Sexual violence
One in ten women in Australia have experienced sexual violence by a male intimate partner (873,000, 10%):
Tbl A1: L12
- Over 800,000 women have experienced sexual assault by a male intimate partner: this is one in 11 women (9.2%).
- 126,500 women have experienced sexual threat by a male intimate partner.
H12, I12, J12
Why don’t you just call it domestic violence?
The PSS classifies a person as having experienced partner violence if they have experienced, at any point since they turned 15, at least one incident of violence (assault or threat) by a partner. In the broader community, as well as by professionals working to prevent violence against women, the term “domestic violence” tends to be used to refer to a sustained pattern of violence and threat that works to create a context of coercive control. Although the PSS “cohabiting partner violence” cohort will include women who have experienced coercive control, it will also include women whose experience of violence is much more sporadic and incidental (see Section 3: Partner violence: 1.1.4.3: Extent of violence).
1.1.2.2 Female intimate partner violence
Using the broad definition of an intimate partner, 0.3% of all women in Australia have experienced violence by a female intimate partner since the age of 15 (26,000):
Tbl A1: S22, R22
- 24,900 women reported physical violence by a female intimate partner.
- Data for women who experienced sexual violence by a female intimate partner was not reported due to data quality concerns.
F22, L22
Not all women in same sex relationships are lesbians
The PSS does not collect data on the sexual identity of survey respondents.
The information above is about women who have experienced violence by a female partner, girlfriend or date. This data tells us about the sex of the person the female victim was in a relationship with – it does not indicate their sexual identity. Women in this category may, or may not, identify as lesbian – they could, among other things, identify as bisexual, queer, curious, heterosexual or straight. This identity could also change over time, so that, for example, a woman may not identify as lesbian at the time of the survey, but may have done so at the time of the assault.
(Similarly, not every woman who experiences sexual violence by a man identifies as heterosexual.)
According to the Australian Study of Health and Relationships, the population prevalence of women in cohabiting same sex relationships is 0.55%. This is five or six women in every thousand. This population prevalence would mean that the number of respondents to the PSS who are in same sex cohabiting relationships is very low. The small sample size means that the statistics on this population are unlikely to be reliable. It also means that there is very limited data able to be reported from the PSS about women who experienced violence by a same sex partner.
Grulich et al., 2014
Warning – definition change ahead!
The information above uses a broad definition of partner that includes both cohabiting partners and boyfriends/girlfriends/dates. The information below separates data about cohabiting partners and about boyfriends/girlfriends/dates.
The broader definition gives us a better sense of the scale of the problem of intimate partner violence. However, most of the PSS data is limited to cohabiting partners.
1.1.3 Boyfriend, girlfriend or date violence
Close to a million women have experienced violence perpetrated by a “boyfriend, girlfriend or date” (990,700). This is two thirds the number of women who reported being victimised by a cohabiting partner.[10]
Tbl 4:D21
1.1.4 Cohabiting partner violence
1.1.4.1 Former and current cohabiting partner
What exactly are we talking about? Cohabiting partners
The category of cohabiting partner includes both former and current partners who have lived with the survey respondent.
A current cohabiting partner is a person who, at the time of the survey, the survey respondent was living with in a marriage or de-facto relationship.
A former partner is a person who the survey respondent lived with at some point in a marriage or de facto relationship, but who they no longer live with, and includes:
- A partner who was violent towards the survey respondent during the relationship, but the relationship has now ended.
- A partner who was not violent during the relationship, but has been violent since the relationship ended.
- A partner who was violent both during and after the relationship.
A former partner has, at some point in time lived with the survey respondent, however the violence may have started after they stopped cohabiting.
Approximately 1.5 million women, or 16.9% of all women in Australia, have experienced violence by a current or former cohabiting partner: this is one in six women. This equals 41.6% of women who have experienced violence at some point since the age of 15.
Tbl 4: D18 E18
16.8% of women had experienced violence perpetrated by a male partner (1,470, 200) and 0.1% by a female partner (11,100*).[11]
Tbl 6: E20 E40
Some of the women who experienced cohabiting partner violence had also experienced violence from other types of perpetrator.
1.1.4.2 Former cohabiting partner only
I thought it was one in three?
The statistic “one in three women have experienced violence” refers to women’s experience of physical violence by any type of perpetrator.
In contrast, one in six women have experienced violence by a cohabiting partner (see Section 3: 1.1 for an explanation of why using the term “domestic violence” may be problematic, and see Section 1: 2.5 for a detailed explanation of one in three statistics.).
Of women who had experienced violence by a male or female cohabiting partner, 85.6% were victimised by a partner with whom they were no longer in a relationship at the time of the survey (although the vast majority experienced violence while in the relationship) (1,267,200).
Tbl 4: D20
Some women experienced violence by both a former and current partner.
1.1.4.3 Extent of violence
Current cohabiting partner
For women who were in a relationship with their violent cohabiting partner at the time of the survey, two thirds had experienced more than one incident of abuse (154,500, 65.1%).
Tbl 22:D13
Of women who had experienced more than one incident of violence by their current partner, three out of five reported that the violence occurred “a little of the time” (93,200).
D18
Approximately 15,400* women reported that the violence happened all or most of the time. This represents:
- 10% of the women who experienced violence more than once; and
- 6.5% of women who had experienced violence once or more than once by their current cohabiting partner.
D16, Additional analysis
Women who were no longer with their abusive partner reported more frequent abuse than women who were still in a relationship with the abusive partner.
Is that really a “violent partner”?
The term “violent partner” is used in this report to refer to a partner who has perpetrated at least one act of violence, including either threat or assault. The use of this term does not indicate that the partner was necessarily repeatedly violent in the relationship. The term is used as a shorthand and should not be read as having the connotations of repeated violence that may be associated with it in other contexts.
Former cohabiting partner
73% of women who had experienced violence by a former cohabiting partner reported that the violence occurred more than once: this is close to a million women (925,100).
Tbl 22:
E28, D28
Of women who had experienced abuse more than once, 347,900 women reported having experienced abuse all or most of the time, with about half this number reporting abuse that had happened a little of the time (197,200).
D31, D33
Women who had experienced the most frequent abuse (all or most of the time) represented:
- Over a third (38%) of women who experienced abuse more than once; and
- 27% of women who had experienced violence once or more than once by their former cohabiting partner violence.
Additional analysis
Be careful with comparisons
Some of the prevalence data reported in this section looks at women’s experiences of violence by both male and female partners, however much of the detailed analysis is limited to male perpetrators (e.g. where data is collected separately for male and female perpetrators, such as most recent incident data). The focus on male perpetrators also reflects the reality that the vast majority of women report that intimate partner violence is perpetrated by a male partner. Therefore care should be taken when comparing prevalence information and other data in this report, as the populations may be different.
For more statistics related to extent of violence, please see:
Section 3: Partner violence: 3.2 How recently did violence occur?
Section 3: Partner violence: 4.1.5 Contact with police by extent of violence.
Section 3: Partner violence: 4.2.4 Advice and support: Advice seeking by extent of violence.
Section 3: Partner violence: 4.4.2 Psychological impacts: Fear by severity of violence.
1.2 In the last 12 months
The following information relates only to incidents that occurred in the 12 months prior to the woman taking the survey.
1.2.1 All violence
In the last 12 months, one in 20 women in Australia had experienced violence (467,300, 5.3%). Most of these women knew their perpetrator.
Tbl 3:D13
See also: Section 3: 1.1.1 Since the age of 15: All violence
1.2.2 Intimate partner violence (broad definition)
Of women who experienced violence by a known person (346,400), about half experienced violence by an intimate partner (including cohabiting partners and boyfriends, girlfriends and dates) (186,900).
Tbl A2:R11, R12
One in 50 women in Australia experienced at least one incident of violence by an intimate partner in the 12 months prior to the survey (2.1%).
S12
An equal number of women were victimised by:
- a cohabiting partner they remained in a relationship with (66,200, 0.8%);
- a cohabiting partner that they were separated from by the time they completed the survey (66,300, 0.8%); or
- a boyfriend, girlfriend or date (68,700, 0.8%).[12]
R13, R14, R15
1.2.2.1 Type of violence
All violence
In the year prior to the survey, nine out of ten women who reported violence by an intimate partner experienced assault (sexual and/or physical). One in four reported threat (sexual and/or physical).
Tbl A2:N12, P12
84% of women who experienced intimate partner violence experienced physical violence (assault and/or threat) (157,400).
F12
One in three women who experienced intimate partner violence had at least one incident of sexual violence (assault and/or threat) in the last year (55,000).
L12
Assault only
Of women who experienced male intimate partner violence:
- Seven out of ten experienced physical assault by their cohabiting partner, boyfriend/girlfriend or date (135,900).
- 28% experience sexual assault (52,400)
B12, H12
These numbers include women who, in the 12 months prior to the survey, had experienced separate incidents of physical and sexual assault.
Remember!
Women who reported having experienced violence may have experienced any combination (or only one) of: physical assault, physical threat, sexual assault and sexual threat.
Comparing violence in different relationship types
More women reported having experienced sexual assault by a boyfriend/girlfriend or date than by a current cohabiting partner (24,600 vs 10,700).
Tbl A2:H15, H13
More women reported physical assault in their current cohabiting relationship (53,800) than by:
- a former partner (42,600); or
- a boyfriend/girlfriend/date (41,300).
B13, B14, B15
Of women who had experienced violence in the last year, a greater number reported physical violence than sexual violence: of these women, most had experienced at least one assault.
For more comparisons by type of perpetrator see also:
Section 3: Partner violence: 4.4.4 Fear and anxiety by type of perpetrator.
Section 2: Sexual assault: Perpetrator characteristics.
1.2.3 Cohabiting partner violence
In the 12 months prior to completing the survey, 132,500 women experienced violence perpetrated by a cohabiting partner. This is 1.5% of all women in Australia, and 28.4% of women who experienced violence during this time.
Tbl 3: D18, E18
The same percentage of women experienced violence by a cohabiting partner in the 12 months prior to the 2005 and the 2012 surveys (1.5%).
Tbl 21: D12, E12
Graph U: Number of women who experienced assault during the last 12 months: By perpetrator type
Data table for Graph U:
| Relationship | Sexual assault | Physical assault |
|---|---|---|
| Former cohabiting partner | ~17,000 | ~42,000 |
| Current cohabiting partner | ~11,000 | ~54,000 |
| Boyfriend/girlfriend/date | ~25,000 | ~41,000 |
2 Victim demographics: Who does partner violence happen to?
This section outlines a range of key demographic features of victims of cohabiting and intimate partner violence. Statistically significant variation was associated with age, a lack of post-school qualifications and country of birth. No statistically significant variation was identified for the 12 month prevalence of either the categories of cohabiting or intimate partner violence for state or territory of residence, labour force participation, disability status or socio-economic status. With the exception of findings related to location, all data below relates to male partners only.
Statistical significance has been determined against the national rate
Statistical testing has been completed for the information in this section. All significance testing has been against the national rate (i.e., 1.5% for cohabiting partner violence and 2.1% for intimate partner violence).
The significance of differences in rates within a group (e.g., between different ages) has not been calculated.
Tbl A18: B56, Tbl A17: G57
The following demographic information includes data using both the broad and narrow definitions of “partner”.
Recall that:
- Cohabiting partner is a person that the respondent is living with in a marriage or de facto relationship.
- Intimate partner is a broad definition of partner and includes partners that a person may or may not be living with. This category includes cohabiting partners, as well as boyfriends, girlfriends and dates.
2.1 Broad age group
The rate of intimate and cohabiting male partner violence varied with age.
18-24 years
When compared to the rate for all ages, in the year prior to the survey young women were not at increased risk of male cohabiting partner violence (15,500, 1.4%*).
Tbl A18: B18
However, when we used the broader definition of partner, young women were at a statistically significant increased risk of male intimate partner violence (33,500, 3.1%). This result is to be expected as this younger group is more likely to have non-cohabiting intimate relationships.
Tbl A17: F19
25-34 years
The highest rate of male cohabiting partner violence was found in women aged 25-34 years, possibly reflecting the tendency for women of this age to cohabit with their partners.
More than one in 40 women in this age group experienced male cohabiting partner violence in the 12 months prior to the survey (44,300, 2.7%).
Tbl A18: B19
This age group also has the highest rate of male intimate partner violence (61,200, 3.8%), with approximately one in 25 women in this age range having experienced intimate partner violence.
Tbl A17: F20
The difference between these rates and the national rate is statistically significant.
35-54 years
The rate of male cohabiting and intimate partner violence was consistent with the national rate for women aged 35-44 and 45-54 years.
Tbl A17: F21-22, Tbl A18: B20-21
Over 55 years
Older women were at decreased risk, with 0.4%* (12,800*) of women aged 55 years and older having experienced male cohabiting partner violence in the previous 12 months.[13]
Tbl A18: B22
The difference between this rate and the national rate is statistically significant.
2.2 State or territory of residence
None of the states and territories differed significantly from the national estimate for either male cohabiting partner violence or male intimate partner violence.
Tbl A18: C8 – C15, Tbl A17: G9 – G16
2.3 Country of birth
1.6% of women who were born in Australia experienced male cohabiting partner violence in the 12 months prior to completing the survey (94,800).
Tbl A18: B33
For women who were born overseas, the rate is 1.3% (34,600), of which the majority are from countries where English is not the main language (27,100*).
C34 C36
The rate of male cohabiting partner violence experienced by women from main English speaking countries (7,500*, 0.8%*) was about half that of women from countries where English was not the main language (27,100*,1.5%).
C35 C36
The pattern was more marked when we consider the broader category of intimate partners:
Women born in Australia had the highest reported rate of male intimate partner violence (136,100, 2.3%), while women born in other English speaking countries had the lowest (11,600*, 1.2%*).
Tbl A17:F34 F36
The difference between the rates of violence experienced by women from countries where English is the main language and the national rate was statistically significant for both cohabiting partners and intimate partners. All other rates were consistent with the national rate.
Information on the definition of “main English speaking country” is in Section 2: Sexual assault: 2.3 Country of birth.
2.4 Labour force participation
In the year prior to the survey, there was no difference in the rate of male cohabiting partner violence experienced by women who were employed and those that were unemployed or not in the labour force: the rate of sexual assault experienced for both groups in the 12 months prior to the survey was 1.5%.
Tbl A18: C25 – C26
When considering the broader definition of intimate partner violence, there is a statistically insignificant variation between women who were employed and women who were unemployed or not in the workforce (112,500, 2.3% vs 68,300, 1.8%).
Tbl A17: G26 – G27
These rates are not significantly different to the national rate.
Information on the definition of labour force is in Section 2: 2.4 Labour force participation.
2.5 Level of education
Women with a post-school qualification (79,200, 1.7%) reported a statistically equivalent rate of male cohabiting partner violence as women with no post-school qualification (50,200, 1.3%).
Tbl A18: C29 C30
In contrast, when we used the broader definition of intimate partner, 1.7 times as many women who had a post-school qualification (120,700, 2.5%) reported male intimate partner violence compared to women with no post-school qualification (60,100, 1.5%).
Tbl A17: G31 G30
The difference in the rate of intimate partner violence and the national rate was statistically significant. All other rates are consistent with the national rate.
Graph V: Proportion of women who experienced male partner violence in the last 12 months: By partner type and sociodemographic characteristics
Data table for Graph V – Cohabiting Partner:
| Sociodemographic characteristic | Percentage |
|---|---|
| National rate | 1.5% |
| 25-35 years | 2.7% |
| 55+ years | 0.4% |
| Born outside Australia (English main language) | 0.8% |
Data table for Graph V – Intimate Partner:
| Sociodemographic characteristic | Percentage |
|---|---|
| National rate | 2.1% |
| 18-24 years | 3.1% |
| 25-35 years | 3.8% |
| 55+ years | 0.4% |
| Born outside Australia (English main language) | 1.2% |
| No post-school qualification | 1.5% |
Note: Includes only sociodemographic characteristics with a 12 month partner violence rate that is statistically significantly different from the national 12 month partner violence rate
2.6 Disability status
Women with a disability were more likely to experience male partner violence in the year prior to the survey when compared to women without a disability. This is true for both:
the narrow definition of cohabiting partner (51,200, 1.8% vs 78,300, 1.3%); and
Tbl A18: C53 – C54
the broader definition of intimate partner (73,900, 2.6% vs 106,800, 1.8%).
Tbl A17: G54 – G55
The difference between the rates of violence by a male cohabiting or intimate partner for women with and without disability and the national rate was not statistically significant.
Women with a disability represent about 40% of all female victims of cohabiting and intimate partner violence and 32.3% of the entire survey respondent population (those who had, and had not, experienced violence).
Information on the definition of disability is in Section 2: 2.6: Disability status.
2.7 Socio-economic status
The PSS provides mixed evidence regarding the socioeconomic characteristics of women who experience partner violence. A consistent, but statistically insignificant decrease in violence was seen with increased household income for male cohabiting partner violence and the increased ranking in the Socio-Economic Index of Advantage/Disadvantage for male intimate partner violence.
However, these patterns did not hold for:
- household weekly income for intimate partner violence; and
- the index of advantage/disadvantage for cohabiting partner violence.
Information on the measures of SES status is in Section 2: 2.7 Socio-economic status.
Household weekly income
The rate of male cohabiting partner violence decreased with higher household weekly earnings:
For women with household incomes in the bottom 40%, the rate of cohabiting partner violence was 1.8%.
Tbl A18: C39 – C40
The rate was 1.7% (22,800) for women with an average income (between 40% and 60%).
C41
The rate was 1.6%* (18,700*) for those with a bit more money than most (top 20-40%) and 1.4% (15,600) for those who have the most household income (top 20%).
C42 C43
Socio-Economic Index of Advantage/Disadvantage
The same pattern was present when considering the more expansive cohort of intimate partner violence and the Socio-Economic Index of Advantage/Disadvantage.
The rate of male intimate partner violence in the last 12 months for the most disadvantaged women (lowest quintile) was 2.9% (40,500). For the most advantaged women (in the most advantaged two quintiles), the rate of intimate partner violence was 1.6%.
Tbl A17: G47 – G51
The difference between the rates for measures of socio-economic status and the national rate was not statistically significant.
2.8 Location
Women who lived outside capital cities at the time of the survey (84,400, 1.5%) experienced the same rate of cohabiting partner violence in the previous year as women who lived in capital cities (48,000, 1.6%). These estimates include both opposite and same sex partners.
Tbl A22: I8 – I9
The difference in rates of violence by location was not statistically significant.
This isn’t what I was expecting… is this another limitation of the PSS?
Within the PSS, a person is understood as having experienced cohabiting partner violence if, since the age of 15, they have experienced at least one incident of a partner either hurting them or threatening to do so (see the introduction for exact definition).
A large number of the women who were classified as having experienced cohabiting partner violence had only experienced a single incident (27% for former partner, 34.9% for current partner). Although some of these women are likely to have experienced substantial impacts from that single incident, it is plausible that some would not have experienced “domestic violence” in the way that it is commonly understood (i.e., as a sustained pattern of abuse that results in fear and intimidation).
Differences between the PSS and qualitative domestic violence research are not surprising given these different definitions. Put concretely, we must expect differences in the lived experience of women who are living in a woman’s refuge (a common qualitative study population) and a woman who has experienced, at some point since she was 15, one incident of assault or threat by a cohabiting partner.
For further data by demographic characteristics of victims, see:
Section 1: 2. Victim demographics
Section 2: 2. Victim demographics
Section 3: 4.1.1 Contact with police by victim demographics
Section 3: 4.2.3 Advice seeking by victim demographics
Section 4: 2. Victim demographics
Why haven’t you described perpetrator characteristics for partner violence?
In the section on sexual assault, there is a sub-section on perpetrator characteristics. This sub-section is not included in the partner violence section of the report.
The PSS collects limited information on a victim’s account of the characteristics of their perpetrator(s). This incident related data is limited to the relationship that the victim had with the perpetrator (“type” of perpetrator) and the perpetrator’s gender. Thus, we are unable to give any further demographic detail than what is already embedded in the selection of population for this section.
Some comparison between cohabiting partners and other perpetrator types is included in the sub-sections on Incident Characteristics and Post-incident Impacts and Actions.
3 Incident characteristics: What happens in partner violence incidents?
This sub-section describes the characteristics of the partner violence incidents. The majority of incidents involved physical violence, most of which was physical assault (rather than threat only). About half the women who reported having experienced violence by their current cohabiting partner also reported emotional abuse. A similar percentage reported that alcohol/drug use contributed to their most recent incident of violence. Almost all incidents occurred in a private residence. The majority of women who had children in their care at the time of violence reported that their children heard or saw the violence. Most women reported that their most recent incident of cohabiting partner violence occurred more than ten years ago.
Most recent incident (MRI) data has particular limitations that means it should be used carefully. Please see Section 1, ‘Most recent incident data and the separation of male and female perpetrators’ for more detail. MRI data is highlighted in orange to help the reader be aware of when this data is in use.
3.1 Type of violence
Intimate partner violence may involve physical and/or sexual violence.
More women reported that their partner (male or female) perpetrated physical violence than sexual violence, although some women may have experienced both types of violence.
As noted earlier, 2.2 million women had experienced intimate partner violence since the age of 15.
Tbl A1: R12
3.1.1 Physical violence
Since the age of 15, approximately 1.8 million women had experienced physical assault and/or physical threat by a male intimate partner (including cohabiting partner, boyfriend or date). This represents eight out of ten (83.3%) women who have experienced any type of violence by a male intimate partner.[14]
Tbl A1: F12
Most women reported physical violence from a former cohabiting partner:
- 226,800 women experienced physical violence by a current male cohabiting partner;
- 1,149,000 women experienced physical violence by a former male cohabiting partner; and
- 580,300 women experienced physical violence by a boyfriend or date.
F13, F14, F15
Women who are counted in the PSS as having experienced physical violence may have experienced physical assault, physical threat or both.
Physical assault
Nine out of ten women who reported physical violence by a male intimate partner indicated that they experienced physical assault. This was true for current cohabiting partner, former cohabiting partner and boyfriend/date.
Tbl A1: B13 – B15
Physical threat
Of women who had experienced male intimate partner physical violence, between one in six (boyfriend or date) and one in four (former cohabiting partner) women had experienced physical threat.
D13 – D15
3.1.2 Sexual violence
Since the age of 15, 873,000 women had experienced sexual assault and/or sexual threat by a male intimate partner. This represents 40% of women who experienced violence by a male intimate partner. These women may, or may not, have also experienced physical violence.
Tbl A1: L12
Most women reported sexual violence from a boyfriend or date:
- 44,900 women experienced sexual violence by a current male cohabiting partner;
- 382,000 women experienced sexual violence by a former male cohabiting partner; and
516,600 women experienced sexual violence by a boyfriend or date.
L13, L14, L15
Sexual assault
Of women who have experienced intimate male partner sexual violence, between 91% (boyfriend or date) and 98.4% (current cohabiting partner) women had experienced sexual assault.
H13 – H15
Sexual threat
Of women who have experienced male intimate partner sexual violence, one in six women had experienced sexual threat by a former cohabiting partner.
J13 – J15
For more detail of prevalence of sexual assault by a partner, see: Section 2: Sexual assault: 1 Prevalence.
It might be tempting, but…
It is not possible to determine how many women had experienced both sexual and physical violence within a single relationship. The survey asks these questions separately and it is impossible to cross-tabulate the information.
Warning – definition change ahead!
The information above uses a broad definition of partner that includes both male cohabiting partners and boyfriend/date. The information below is about cohabiting partners only.
3.2 How recently did violence occur?
The majority of cohabiting partner violence occured 10 or more years ago.
For women who had experienced male cohabiting partner violence:
- Six out of ten said that the most recent incident of this form of violence occurred ten or more years ago (880,100, 59.9%).
- One in six (15.8%) respondents said their most recent incident of male cohabiting partner violence occurred less than two years ago. Of these:
- one in nine (8.8%) said their most recent incident occurred in the 12 months prior to the survey.
Tbl A19: R14 – R1,5 R9 – R10, R9
Graph W: Women who experienced cohabiting partner violence since the age of 15, when the most recent incident occurred
Data table for Graph W:
| When the most recent incident occurred | Percentage |
|---|---|
| 10+ years ago | 59.9% |
| 2-10 years ago | 24.3% |
| <2 years ago | 15.8% |
Note: Data relates to incidents since the age of 15.
Most of the numbers in this section are based on a single incident, potentially a long time ago. Could this mean we are exaggerating the problem?
No. What it means is that the PSS is defining the problem based on behaviours, rather than the meaning or impact of those behaviours. Some women may experience few incidents of violence, but the impact may be very high. Some may experience a lot of violence but not experience this as traumatic or problematic. The PSS tries to disentangle these groups in some of the questions, but it doesn’t include or exclude people from the category of experiencing cohabiting partner violence based on their response to the violence.
However, we need to be careful exactly how we report these statistics – if we say that 1.4 million women have experienced domestic violence, rather than 1.4 million have experienced violence by a partner, then we risk exaggerating the issue. While time consuming and frustrating, being exact with words is important because it ensures that the statistics are accurate.
3.3 Emotional abuse by a partner
Emotional abuse is a common aspect of abusive relationships. About half the women who reported that they had experienced violence by their current cohabiting partner also reported that they had experienced emotional abuse by that partner (assuming that they did not have more than one current partner that they were living with).
What is emotional abuse?
Emotional abuse is defined in the PSS as “behaviours or actions that are aimed at preventing or controlling [a partner’s] behaviour with the intent to cause them emotional harm or fear”.
Emotional abuse is only reported for cohabiting partner relationships.
Examples of emotional abuse include deliberate acts to stop or try to stop a partner from:
- contacting family or friends;
- using the telephone, internet or car;
- knowing about or having access to household money;
- working or earning money; or
- studying.
Other examples (not exhaustive) include constant put downs; destroying property; depriving them of medical or psychological care; threatening to harm children, pets or self (but not threats to harm the survey respondent – this would be sexual or physical threat).
Glossary
3.3.1 Since the age of 15
Former or current cohabiting partner
Over 2.1 million women in Australia had experienced at least one incident of emotional abuse by a former or current cohabiting partner since the age of 15: this is one in four women in Australia (24.5%).
Tbl 32: E22
Former cohabiting partner only
Approximately 1.8 million women reported that they had experienced emotional abuse from a partner they were no longer in a relationship with: this is one in five women in Australia (1,840,600, 21.1%).
D24
Current cohabiting partner only
Since the age of 15, an estimated 392,100 women have experienced emotional abuse from a cohabiting partner who they were in a relationship with at the time of the survey: this is one in 22 women (4.5%).
D23, E23
3.3.2 In the last 12 months
One in 20 women in Australia had experienced emotional abuse by a former or current partner in the 12 months prior to the survey (406,800, 4.7%).
Tbl 32:E13
Approximately half of these women had experienced emotional abuse by their current cohabiting partner in the 12 months prior to the survey (217,000, 2.5%).
E14
The other half experienced emotional abuse by a former cohabiting partner (191,300, 2.2%).
E15
3.3.3 Anxiety and fear due to emotional abuse (since the age of 15)
Three out of four women had experienced anxiety or fear due to emotional abuse by a former cohabiting male partner (1,382,600, 76.3%).
Tbl 33:B18
Three out of five women experienced anxiety or fear when this abuse was by:
- a current male cohabiting partner (243,700, 62.5%); or
- a former female cohabiting partner (23,300*, 62.5%).
B16 B19
Being afraid of violence vs being afraid due to emotional abuse
The information in this section relates to fear and anxiety caused by emotional abuse. In the context of the PSS, this is different to fear and anxiety caused by violence. For more information on this distinction and for information on the fear and anxiety as a result of partner violence, please see Section 3: Partner Violence: 4.4 Psychological impacts.
Graph X: Number of women who have experienced violence, emotional abuse or both from a current cohabiting partner
Data table for Graph X:
| Type of abuse | Number |
|---|---|
| Emotional abuse only | ~260,000 |
| Violence only | ~110,000 |
| Both violence and abuse | ~130,000 |
Note: Data relates to incidents since the age of 15.
The following statistics relate to the number of women who had experienced both emotional abuse and violence from the same partner, as well as outlining the number of women who had experienced one type of abuse/violence but not the other.
In order to look at these relationships, we are limited to data about current cohabiting partners. We also make the assumption that women are not living with multiple partners at the same time.
3.3.4 Link between emotional abuse and cohabiting partner violence
About half the women who reported having experienced violence by their current cohabiting partner also reported emotional abuse.
Two thirds of women who had experienced emotional abuse by their current cohabiting partner had not experienced violence by that partner.
Below we examine the interaction between violence and emotional abuse in more detail.
See below for references
3.3.4.1 Since the age of 15
Current cohabiting partner emotional abuse and violence
Since the age of 15, 129,400 women had experienced both emotional abuse and violence from their current cohabiting partner. This is:
- 33% of women who had experienced current cohabiting partner emotional abuse;
- 54.6% of women who have experienced current cohabiting partner violence;
- 1.5% of women in Australia.
Tbl A21: B9 C9 Tbl A20: C12
Current cohabiting partner emotional abuse but not violence
Since the age of 15, 262,800 women had experienced emotional abuse but not violence from their current cohabiting partner. This is:
- 67% of women who had experienced current cohabiting partner emotional abuse;
- 3% of women in Australia.
Tbl A21: B10
Current cohabiting partner violence but not emotional abuse
Since the age of 15, 107,800 women had experienced violence but not emotional abuse from their current cohabiting partner. This is:
- 45.4% of women who had experienced current cohabiting partner violence;
- 1.2% of women in Australia.
Tbl A21: D9 E9
Current cohabiting partner emotional abuse or violence
Since the age of 15, 499,900 women had experienced either emotional abuse and/or violence from a current cohabiting partner. This is:
- 1.9 times as many women as had experienced current cohabiting partner emotional abuse only;
- 4.6 times as many women than had experienced current cohabiting partner violence only;
- Approximately one in 17 (5.7%) women in Australia.
Tbl A20: B20, C20
3.3.4.2 In the last 12 months
Current cohabiting partner emotional abuse and violence
In the 12 months prior to the survey, 42,100 women experienced both emotional abuse and violence from a current cohabiting partner: this is 0.5% of women in Australia.
Tbl A20: C9 B9
Current cohabiting partner emotional abuse or violence
In the 12 months prior to the survey, 241,100 women had experienced either emotional abuse or violence from a current cohabiting partner: this is 2.8% of women in Australia.
B17 C17
See also: Section 3: Partner Violence: 4.4 Psychological impacts.
Most women who reported experiencing emotional abuse reported being anxious or fearful due to the abuse. Although emotional abuse is common in relationships that have included at least one incident of violence, it is certainly not a universal feature of these relationships.
Why is the writing so repetitive?
You may have noticed that sometimes the same sentence structure is used when talking about different populations (e.g. women who have experienced emotional abuse, violence or both) with the same variables (e.g. prevalence in the last 12 months). We do this so that:
- the reader is easily able to compare across populations;
- the reader can be familiar with the structure of the sentence (and therefore the data) and use this structural knowledge to help them understand the content;
- we ensure that if a piece of text is taken out of this report, it still includes the information that is needed for it to be accurate; and
- we can write accurately about a survey that provides detailed but complex data (e.g. in order to give the statistics in the dot points of the previous paragraph on cohabiting emotional abuse or violence, we needed to identify and address ten variables).
A (very) partial picture: Most recent incident data
Some of the data we have about partner violence comes from the most recent incident (MRI) data module. This data has specific limitations that makes it difficult to report in some contexts.
MRI data is collected when the ABS asks a survey respondent about their most recent incident of eight types of violence (sexual assault, sexual threat, physical assault and physical threat by a male or female perpetrator). As part of this module, the participant answers who perpetrated the most recent incident.
A person’s most recent incident of violence may, or may not, be their most recent incident of partner violence. For example, imagine that Joe has experienced sexual assault by both a partner and a friend. The assault by the friend happened after the assault by the partner. Although Joe has a most recent incident of partner sexual assault that she could answer questions about, when she responds to the survey with the ABS staff member, she will answer about her most recent sexual assault (i.e., by the friend).
MRI data does not provide information about patterns of violence; it only provides information about the most recent incident. A person may have been hit 50 times by their boyfriend and once by their best friend, but if the hit by the best friend was the most recent incident, it will be the only one captured in the MRI data.
MRI data does not provide information about whether someone has ever done something (e.g., gone to the police), it only says how many people have done so in their most recent incident.
MRI data is highlighted in orange to help the reader be aware that it should be used carefully.
3.4 Alcohol and other drugs
Warning – definition change ahead!
The following section includes data for women who had a male cohabiting partner(s).
Alcohol and other drugs “contributed to the incident”
Survey respondents are asked whether they think drugs or alcohol contributed to their most recent incident of eight types of violence.
“Contributing” may include if the victim was under the influence of alcohol or other substances; if the victim believes that alcohol or drugs were added to their drink without their consent; or if the victim believed the perpetrator was under the influence of alcohol or drugs.
For each scenario, alcohol and other substances are asked about separately.
The following data refers to a woman’s most recent incident of violence by a male perpetrator (MRIMP). See A (very) partial picture above for information about how this information is collected.
Where a woman’s MRIMP was perpetrated by a male cohabiting partner, about 50% of respondents reported that alcohol/drugs contributed to the most recent incident.
Alcohol and other drug data is collected by type of incident and cannot be collated. Between 47.2% (physical threat) and 55.7% (sexual assault) of women said that alcohol/drug use contributed to the most recent incident of that type of violence when it was perpetrated by a male cohabiting partner. The difference across violence types was not statistically significant.
Tbl A5: K18 K25
For information about alcohol use in relation to sexual assault, including cohabiting partner sexual assault, see Section 2: 4.2 Alcohol and other drugs.
3.5 Location of incident
Three quarters of a million women reported that their MRIMP of physical assault was perpetrated by a cohabiting partner and occurred in a private residence. A quarter of a million women reported that their MRIMP of sexual assault by a cohabiting partner occurred in the same location.
Tbl A5: B12 B26
For more information about location of incidents in relation to sexual assault, including partner sexual assault, see Section 2: 4.3 Location of incident.
Graph Y: Proportion of women victims, location of most recent incident of assault by a male, where assault perpetrated by cohabiting partner: By violence type and location
Data table for Graph Y:
| Type of Assault | Private residence | Other |
|---|---|---|
| Sexual assault | 97% | 3% |
| Physical assault | 96% | 4% |
Note: Data relates to incidents since the age of 15. Data limited to women whose most recent incident of assault was by a cohabiting partner – this data will exclude women who experienced assault by a cohabiting partner if this violence was not their most recent physical/sexual assault by a male.
No more blue and purple after this!
The rest of this section deals only with cohabiting partners and so we have ceased the colour distinctions for cohabiting and intimate partners.
3.6 Violence and pregnancy
Violence during pregnancy is experienced by a minority of women who have been pregnant during a violent cohabiting relationship.
Why are former and current partner separated?
Statistics on violence perpetrated by a cohabiting partner are collected in a range of places in the PSS. For statistics collected in the partner module, the research participant is asked the same set of questions for a former and current partner. This means that they give two answers to each question.
In some cases (as above), the ABS is able to combine the results for former and current cohabiting partner violence. However, in several cases, this is not possible.
To explain why we sometimes need to keep these statistics separate, imagine that Jenny had experienced violence by both her former and current partner. In her survey interview, the ABS staff member asked her “did you call the police?” Jenny answers “Yes” for former partner and “No” for current partner. When it comes time for the ABS to analyse this data, former and current partner are separated, and they can easily record and analyse this information.
Now imagine if we try to combine former and current partner data for Jenny: in one scenario she called the police and in another she did not. At a data level, Jenny has both called the police and has not called the police. Both things are equally true, but they can’t be recorded that way if we combine the data.
If the ABS was to prefer one answer to another (as it would have to do if it was to combine data on former and current partner), then it could be, rightfully, accused of bias. The only way to keep the data balanced is to report former and current partner separately.
Although it may be tempting to combine former and current partner data, it is important to keep these statistics separated. If you combine these numbers, you are ignoring the logic of the survey. Any combined number (that hasn’t been combined by the ABS) is not statistically valid as it will include a number of individuals who have been double counted across the two data sets.
3.6.1 Current cohabiting partner
An estimated 180,600 women had experienced violence by a current cohabiting partner and were pregnant during the relationship. One in five (21.7%) of these women experienced violence during their pregnancy: four out of five of these women did not experience violence while they were pregnant.
Tbl 27: B16
Of the 39,100 women who did experience violence during pregnancy, three out of five (24,000*, 61.4%) experienced violence for the first time during pregnancy.
B14 B12
More women reported that they experienced violence by a former cohabiting partner than a current cohabiting partner during pregnancy (see below).
This data is also represented in the flowchart below.
Figure E: Violence and pregnancy: Current cohabiting partner flowchart
Text alternative for Figure E:
Women who experienced current cohabiting partner violence
237,100
Women who were pregnant during their relationship
(Unknown – this statistic not collected with the PSS sample)
Women who experienced violence and were pregnant during their relationship
180,600 (100%)
Women who experienced violence WHILE pregnant
39,100 (21.7%)
Women who DID NOT experience violence WHILE pregnant
141,500 (78.3%)
Women who experience violence for the first time while pregnant
24,000* (13.3%)
Women who did not experience violence for the first time while pregnant
15,100* (8.4%)
Why do you record how many women were pregnant at some point in their relationship and experienced violence at some point in their relationship?
The data that is outlined about women who were pregnant and had experienced violence demonstrates the need for careful identification of relevant population groups. It is essential to identify women who had experienced violence and were pregnant in the same relationship (but may not have experienced violence while pregnant) so that we can identify the population of women for whom experiencing violence while pregnant was a possibility and thus meaningfully identify the size of the problem.
Put differently, it means nothing to say that a certain percentage of women who had experienced cohabiting partner violence experienced violence while pregnant if we don’t know how many people could have experienced violence while pregnant.
3.6.2 Former cohabiting partner
More than three quarters of a million women were pregnant during their relationship and experienced violence perpetrated by a former cohabiting partner (i.e. a partner they have since broken up with).
Tbl 27: D16
More than half of these women experienced violence during their pregnancy (414,600, 53.9%).
E14
Of the women who experienced violence during their pregnancy, slightly less than half experienced violence for the first time during pregnancy (195,500, 47.1%). This represents a quarter of the women who were pregnant during their violent relationship.
E12
This data is also represented in the flowchart below.
Figure F: Violence and pregnancy: Former cohabiting partner flowchart
Text alternative for Figure F:
Women who experienced former cohabiting partner violence
1,267,200
Women who were pregnant during their relationship
(Unknown – this statistic not collected with the PSS sample)
Women who experienced violence and were pregnant during their relationship
768,800 (100%)
Women who experienced violence WHILE pregnant
414,600 (53.9%)
Women who DID NOT experience violence WHILE pregnant
354,200 (46.1%)
Women who experience violence for the first time while pregnant
195,500 (25.4%)
Women who did not experience violence for the first time while pregnant
219,000 (28.5%)
3.7 Violence witnessed by children
Most women who had children in their care during a violent relationship said that the children heard or saw the violence.
3.7.1 Current cohabiting partner
Just over half of women who experienced violence by a current cohabiting partner had children in their care at the time of the violence (128,500, 54.2%). For 57.8% of women in this group, the children heard or saw the violence (74,300).
Tbl 28:D13 D15
A higher percentage of women reported that the violence was witnessed by children when they reported about violence perpetrated by a former partner.
This data is also represented in the following flowchart.
Figure G: Violence witnessed by children: Current cohabiting partner flowchart
Text alternative for Figure G:
Women who experienced current cohabiting partner violence
237,100
Women who had children in their care during their relationship
(Unknown – this statistic not collected with the PSS sample)
Women who experienced violence and had children in their care when the violence happened
128,500 (100%)
Children heard or saw the violence
74,300 (57.8%)
Children did not hear or see the violence
54,200 (42.2%)
3.7.2 Former cohabiting partner
Close to three quarter of a million women who have since left their violent cohabiting partner had children in their care when the violence occurred (733,900). Over half a million of these women reported that their children had seen or heard the violence (568,700): this is 77.5% of women who had children in their care at the time of the violence.
Tbl 28:D22 D24
This data is also represented in the flowchart below.
Figure H: Violence witnessed by children: Former cohabiting partner flowchart
Text alternative for Figure H:
Women who experienced former cohabiting partner violence
1,267,200
Women who had children in their care during their relationship
(Unknown – this statistic not collected with the PSS sample)
Women who experienced violence and had children in their care when the violence happened
733,900 (100%)
Children heard or saw the violence
568,700 (77.5%)
Children did not hear or see the violence
165,200 (22.6%)
For more information on the impact of violence on children, please see Section 3: Partner violence: 4.5 Separations.
Cohabiting partner violence is often witnessed by children, tends to involve alcohol/drug use that is assessed by the victim to have contributed to the incident, and almost always occurs in the home. Such violence is most often a physical assault. When women experience emotional abuse (either as part of the violence or in contexts where there is no violence), they are often frightened.
4 Post-incident actions and impacts: What happens after a partner violence incident?
When their most recent assault by a male (MRIMP) was perpetrated by a cohabiting partner, most women did not contact police. Of those who did contact the police, most indicated that the perpetrator was not charged. The majority of women had told someone about their MRIMP physical assault. A greater proportion of women took time off work because of their MRIMP physical assault by a male cohabiting partner than after a physical assault by a stranger or other known person. Unsurprisingly, women who experienced more violence also experienced more fear and anxiety about the violence. Most women did not permanently leave their violent partner the first time that they separated.
Keeping sexual assault and physical assault separate
The data used here to examine police and court contact comes from the MRI data module. This means that the data on sexual and physical assault is separated and cannot be added together. The finer detail of assault type allows for consideration of differences in engagements with legal responses by the type of assault that a woman has experienced.
This section only considers women’s most recent incidents of violence where the perpetrator was a (male) cohabiting partner. This data does not represent all incidents of violence by a cohabiting partner.
4.1 Police and court contact
There are many steps from experiencing an assault to having someone convicted for that crime. The PSS collects data for different stages of that journey. In comparison to women whose MRIMP assault was a sexual assault by a cohabiting partner, more women who were physically assaulted engaged with the criminal justice system.
The following flow charts relate to a woman’s most recent incident of either physical or sexual assault by a male.
Graph Z: Women’s most recent assault by a cohabiting partner, whether incident perceived as crime at the time and police involvement: By assault type
Data table for Graph Z:
| Perception | Sexual assault | Physical assault |
|---|---|---|
| Perceived their most recent incident as a crime | 33.3% | 47.1% |
| Contacted the police about their most recent incident | 20.1% | 35.5% |
| Report that the perpetrator was charged for the recent incident | 8.3% | 14.5% |
| Report that the perpetrator went to court | 6% | 12.2% |
Note: Data relates to incidents since the age of 15. Data limited to women whose most recent incident of assault was by a cohabiting partner – this data will exclude women who experienced assault by a cohabiting partner if this violence was not their most recent physical/sexual assault by a male.
Below we provide three flowcharts outlining the stages of a woman’s engagement with the police and court system(s). The first flowchart is a summary of the available data, while the second provides detailed information on physical assault and the third provides the same detail for sexual assault.
Please note that this information is limited to instances of assault (i.e., it does not include threat and therefore is not an account of “violence”).
Figure I: Violence by a male cohabiting partner (summary): Police to court flowchart
Based on Tbl A8.
Data table for figure I:
| Action | Sexual assault: 250,300 where partner violence was most recent incident | Physical assault: 814,100 where partner violence was most recent incident |
|---|---|---|
| Most recent incident was perceived as a crime | Sexual assault: 83,400 One in three (33.3%) women who have been sexually assaulted | Physical assault: 383,500 Half (47.1%) of women who have been physically assaulted |
| Contacted police about most recent incident | Sexual assault: 50,400 One in five (20.1%) women who have been sexually assaulted | Physical assault: 289,000 One in three (35.5%) women who have been physically assaulted |
| Respondent believed perpetrator was charged for most recent incident | Sexual assault: 20,900* 8.3% of women who have been sexually assaulted | Physical assault: 118,700 One in seven (14.5%) women who have been physically assaulted |
| Respondent believed perpetrator went to court for most recent incident | Sexual assault:15,200* 6% of women who have been sexually assaulted | Physical assault: 99,300 One in eight (12.2%) women who have been physically assaulted |
Note: A small number of women who did not perceive the assault as a crime contacted the police.
Reminder!
The category of cohabiting partner includes both former and current partners who have lived with the survey respondent in a marriage or de facto relationship.
Figure J: Most recent incident of physical assault by a male cohabiting partner (detailed): Police to court flowchart
Based on Tbl A8.
Data table for figure J:
Women whose most recent incident of physical assault was by a male cohabiting partner.
Physical assault: 814,100
| Action | Yes | No |
|---|---|---|
| Whether most recent incident was perceived as a crime | Incident perceived as a crime: 383,500 (This is: 47.1% of women who have been physically assaulted.) | Incident not perceived as a crime: 294,200 perceived as wrong but not a crime (36.1%). 136,300 perceived as something that just happens (16.7%). |
| Whether contacted police about most recent incident | Contacted police: 289,000 (This is: 35.5% of women who have been physically assaulted.) | Main reason police not contacted: Did not want to ask for help/felt they could deal with it themselves (159,400). Fear of person responsible (100,600). |
| Whether victim believed perpetrator was charged for most recent incident | Perpetrator charged: 118,700 (This is: 14.5% of women who have been physically assaulted 41% of cases where the woman contacted police.) | Perpetrator not charged: 170,300 |
| Whether victim believed perpetrator went to court for most recent incident | Perpetrator went to court: 99,300 (This is: 12.2% of women who have been physically assaulted. 34.4% of cases where the woman contacted police. 83.7% of cases where the perpetrator was charged.) | Perpetrator did not go to court: 19,400* |
Note: A small number of women who did not perceive the assault as a crime contacted the police
Figure K: Most recent sexual assault by a male cohabiting partner (detailed): Police to court flowchart
Based on Tbl A8.
Data table for Figure K:
Women whose most recent incident of sexual assault was by a male cohabiting partner
Sexual assault: 250,300
| Action | Yes | No |
|---|---|---|
| Whether most recent incident was perceived as a crime | Incident perceived as a crime: 83,400 (This is: 33.3% of women who have been sexually assaulted.) | Incident not perceived as a crime: 115,200 perceived as wrong but not a crime (46%). 51,700 perceived as something that just happens (20.7%). |
| Whether contacted police about most recent incident | Contacted police: 50,400 (This is: 20.1% of women who have been sexually assaulted. 60.4% of women who perceived the assault as a crime.) | Main reason police not contacted: Did not want to ask for help/felt they could deal with it themselves (63,700). Fear of person responsible (55,900). |
| Whether victim believed perpetrator was charged for most recent incident | Perpetrator charged: 20,900* (This is: 8.3% of women who have been sexually assaulted. 25% of women who preceived the assault as a crime. 41.5% of cases where the woman contacted police.) | Perpetrator not charged: 29,500 |
| Whether victim believed perpetrator went to court for most recent incident | Perpetrator went to court: 15,200* (This is: 6% of women who have been sexually assaulted. 18.2% of women who perceived the assault as a crime. 30.2% of cases where the woman contacted police. 72.7% of cases where the perpetrator was charged.) | Perpetrator did not go to court: 3,200** |
Note: A small number of women who did not perceive the assault as a crime contacted the police
4.1.1 Contact with police by victim demographics
In general, women who reported demographic characteristics typically associated with social disadvantage contacted the police more than women who reported characteristics that are typically associated with social advantage. Specifically, a higher proportion of women contacted police who were:
- unemployed or not in the workforce;
- did not have post-school qualifications;
- were born overseas; and/or
- had a disability.
Compared to women reporting current partner violence, a higher percentage of women reported that they had contacted police about violence perpetrated by a former partner.
The following information is regarding women’s contact with the police in the 12 months prior to the survey regarding male cohabiting partner violence:
Graph AA: During the last 12 months, proportion of women who experienced former cohabiting partner violence who contacted police about the violence: By sociodemographic characteristics
Data tables for Graph AA:
| Disability status | Percentage |
|---|---|
| Did not have a disability | 56.1% |
| Had a disability | 63.2% |
| Country of birth | Percentage |
|---|---|
| Born in Australia | 55.9% |
| Born overseas | 71.6% |
| Post-school qualifications | Percentage |
|---|---|
| Had post-school qualification | 49.8% |
| No post-school qualification | 71.1% |
| Employment | Percentage |
|---|---|
| Employed | 40.4% |
| Unemployed/not in the workforce | 79.5% |
Note: Data relates to incidents in the 12 months prior to the survey.
Need the police more or more willing to call the police?
Data on the demographics of women contacting the police does not give us information on the severity of the violence. See 4.2.3 of this section for more detail.
Data in this table relates only to experiences of cohabiting partner violence in the last 12 months. This means that the “former partner” category is a lot smaller when compared to lifetime prevalence statistics.
Table L: Women who experienced male cohabiting partner violence in the last 12 months who contacted police about the violence: By sociodemographic characteristics
Of women who have experienced cohabiting partner violence:
| Employment |
|---|
| Three in ten women who were unemployed or not in the workforce (9,100*, 34.4%*) contacted the police about violence perpetrated by their current partner: this percentage goes up to eight out of ten when considering women who experienced violence by a former partner (23,500*, 79.5%). |
| Two in ten women who are employed (9,200*, 23.1%*) contacted the police about violence perpetrated by their current partner: this percentage goes up to four out of ten of who experienced violence by a former partner (13,600*, 40.4%*). |
| Post-school qualifications |
|---|
| Three in ten women who did not have post-school qualifications contacted the police about violence perpetrated by their current partner (7,000*, 29.6%*): this percentage goes up to seven out of ten when considering women who experienced violence by a former partner (18,800*, 71.1%). |
| One in four women who had post-school qualifications contacted the police about violence perpetrated by their current partner (11,300*, 26.5%*): this percentage goes up to five out of ten when considering women who experienced violence by a former partner (18,300*, 49.8%). |
| Country of birth |
|---|
| Three in ten women who were born overseas contacted the police about violence perpetrated by their current partner (8,000*, 34.4%*): this percentage goes up to seven out of ten when considering women who experienced violence by a former partner (8,000*, 71.6%). |
| Two in ten women who were born in Australia contacted the police about violence perpetrated by their current partner (10,200*, 23.9%*): this percentage goes up to six in ten when considering women who experienced violence by a former partner (29,100, 55.9%). |
| Disability |
|---|
| Four in ten women who had a disability or long-term health condition (10,000*, 36.2%*) contacted the police about violence perpetrated by their current partner: this percentage goes up to six in ten when considering women who experienced violence by a former partner (14,800*, 63.2%). |
| Four in ten women who did not have a disability or long-term health condition (8,300*, 21.4%*) contacted the police about violence perpetrated by their current partner: this percentage goes up to six in ten when considering women who experienced violence by a former partner (22,300*, 56.1%). |
Table A23
For further data by demographic characteristics of perpetrators, see:
Section 3: 2: Victim demographics: Who does violence happen to?
Section 3: 4.2.3 Advice seeking by victim demographics.
Contacting the police vs severity of the violence
Data on the demographics of women contacting the police does not give us information on the severity of the violence.
See 4.2.3 of this section for more detail.
Graph AB: Proportion of women who contacted police about male cohabiting partner violence: By number of incidents
Data tables for Graph AB:
| Disability status | Single incident of violence | Multiple incidents of violence |
|---|---|---|
| Former cohabiting partner | 7.8% | 26.3% |
| Current cohabiting partner | 24.2% | 49.2% |
Note: Data relates to incidents since the age of 15.
4.1.2 Contact with police by extent of violence
Women were more likely to contact police about male cohabiting partner violence when there has been more than one incident of violence.
Current male cohabiting partner
One in 13 women who had experienced a single incident of current male cohabiting partner violence reported the incident to police (6,400*, 7.8%*). In contrast, one in four women who had experienced more than one incident had contacted the police at least once (40,600, 26.3%).
Tbl A28:C13 E13
Former male cohabiting partner
A similar pattern was seen for previous male cohabiting partner violence, with one in four (82,300, 24.2%) women contacting police where there had been a single incident only, and one in two (451,000, 49.2%) women having contacted policed when they had experienced more than one incident.
C22 E22
For more statistics related to extent of violence, please see:
Section 3: Partner violence: Frequency: 1.1.4.3 Extent of violence.
Section 3: Partner violence: 3.2: How recently did violence occur?
Section 3: Partner violence: 4.2.4 Advice and support: Advice seeking by extent of violence.
Section 3: Partner violence: 4.4.2 Psychological impacts: Fear by severity of violence.
For more information about contact with police, please see Section 2: Sexual assault: Police and court contact.
4.2 Advice and support
Most women who had experienced cohabiting partner violence talked to someone about their most recent physical assault by a partner, however more women did not disclose this type of assault than assaults by other types of perpetrators. The most common source of advice and support was a friend, family member, work colleague or a person providing pastoral care.
The information below on advice and support relates to women’s most recent incident of specific types of violence. It is separated by violence type. Due to the method of data collection, it is not possible to add together data about different violence types as women may have experienced more than one form of violence.
Telling someone is different to getting advice or support
According to the PSS, to tell someone about an incident only requires that you inform them about the incident: it does not require that the person give you any advice or support.
See Section 2: 4.2 Alcohol and other drugs for more detail on the distinction between seeking advice and disclosure.
4.2.1 Disclosure
The following data refers to the most recent physical assault a women experienced by a male perpetrator (MRIMP). See “A very partial picture” for information about how this information is collected.
Told no one
Where a woman’s MRIMP physical assault was perpetrated by a male cohabiting partner, one in nine women have not told anyone about the assault (91,300, 11.2%).
This is higher than the number of women who didn’t tell anyone when their MRIMP physical assault was perpetrated by:
- a stranger (10,400*, 4.4%*); or
- an “other known male”[15] (58,800, 8.8%).
Tbl A9:E31 C31 G31
Who first told
Of the 722,800 women who have told someone about their MRIMP physical assault (where it was perpetrated by a male cohabiting partner):
- Just under two thirds first disclosed the incident to a friend, family member, work colleague or minister of religion (457,600).
- One in six women told the police first (121,600).
- One in ten women told a general practitioner or other health professional first (68,200).
Tbl A9:D29 D27 D24
Please see Section 2: 5.2 Advice and support for detail on help seeking for women who experience partner sexual assault.
Graph AC: Proportion of women who have experienced physical assault by a male cohabiting partner: First person told about most recent incident, by broad category
Data table for Graph AC:
| First person told | Percentage |
|---|---|
| Told no one | 11.2% |
| Informal support | 56.2% |
| Formal/professional support | 32.6% |
Note: Data relates to incidents since the age of 15.
Formal support includes counsellors, police, health professional etc.
Informal support includes family members, friends etc.
4.2.2 Advice and support
In relation to their most recent physical assault by a male cohabiting partner, 70.5% of women sought advice or support after the incident (574,100).
The percentage is not statistically different to when the MRIMP physical assault was perpetrated by:
- a stranger (151,800, 64.7%); or
- an other known male (442,700, 66.3%).
Tbl A9:E11 C11 F11
Source of advice or support
Half of women whose most recent physical assault was by a male cohabiting partner sought advice and support from a friend, family member, work colleague or minister of religion (410,800). This represents seven out of ten women who sought advice or support about this type of violence.
About one in four women sought advice from:
- a general practitioner or other health professional (196,500, 24.1%); or
- a counsellor, support worker or telephone hotline (192,400, 23.6%).
Tbl A9:E20 E15 E16
There was a similar pattern of support seeking when a physical assault was perpetrated by a cohabiting partner, stranger or other known person (see table opposite).
The table below outlines the most common sources of support by perpetrator type for a woman’s most recent incident of physical assault by a male. Women may have sought support and advice from multiple sources.
Table M: Women’s most recent incident of physical assault by a male perpetrator, sources of support: By relationship to perpetrator
| Source of support | Of women physically assaulted by their cohabiting partner: | Of women physically assaulted by a known male other than their cohabiting partner: | Of women physically assaulted by a stranger: |
|---|---|---|---|
| Most common source of support | Friend/family member/work colleague/ minister of religion (410,800, 50.5%) | Friend/family member/work colleague/minister of religion (360,100, 53.9%) | Friend/family member/work colleague/minister of religion (109,200, 46.6%) |
| Second most common source of support | GP or health professional (196,500, 24.1%) | Counsellor, support worker or telephone hotline (101,300, 15.2%) | Police (57,300, 24.4%) |
| Third most common source of support | Counsellor, support worker or telephone hotline (192,400, 23.6%) | GP or health professional (91,600, 13.7%) | GP or health professional (43,600, 18.6%) |
| Fourth most common source of support | Police (179,600, 22.1%) | Police (12.7%, 84,700) | Counsellor, support worker or telephone hotline (24,100*, 10.3%*) |
Please see Section 2: 5.2 Advice and support for detail on help seeking for women who experience partner sexual assault.
4.2.3 Advice seeking by victim demographics
In general, women who reported demographic characteristics that were typically associated with social disadvantage accessed more support and advice than women in situations generally associated with social advantage.
This trend held for both current and former cohabiting partner violence.
There were two exceptions to this:
- Employment status – for women who had experienced former cohabiting partner violence, women who were employed sought advice more often than women who were unemployed or not in the workforce; and
- Disability status – for women who had experienced former cohabiting partner violence, women who did not have a disability or long-term health condition sought advice more often than women who had a disability or long-term health condition.
It is plausible that these two exceptions may reflect the relatively greater social connectedness of women who are employed and/or do not have a disability or long-term health condition.
For all sociodemographic characteristics, the same or higher proportion of women reported accessing services for former partner violence than current partner violence.
The following information is regarding women’s seeking of advice and support in the last 12 months regarding male cohabiting partner violence.
Need more help or more willing to get help?
The analysis completed here does not help us understand why certain populations are more likely to seek help than others. We do not know, for instance, whether people access more services because the violence is more severe and they need more services, or because they are more willing to talk to people about what has happened and so access services in less severe contexts.
Looking at help seeking behaviours is not a proxy for the severity of violence – rather it only indicates the tendency of people to ask for help.
Of women who have experienced cohabiting violence:
Table N: Women who experienced male cohabiting partner violence in the last 12 months who sought advice and support about the violence: By sociodemographic characteristics
| Employment |
|---|
| Eight out of ten women who were unemployed or not in the workforce (21,000, 79.6%) sought advice or support about violence perpetrated by their current partner: this percentage goes up to nearly nine out of ten when considering women who experienced violence by a former partner (26,000*, 87.7%). |
| Six out of ten women who were employed (24,700, 61.9%) sought advice or support about the violence perpetrated by their current partner: this percentage goes up to more than nine out of ten (94%) of women who experienced violence by a former partner (31,600). |
| Post-school qualifications |
|---|
| Six out of ten of women who did not have post-school qualifications sought advice or support about violence perpetrated by their current partner (15,200, 64%): |
| Seven out of ten women who had post-school qualifications contacted the police about violence perpetrated by their current partner (30,500, 71.7%): |
| this percentage goes up to nine out of ten when considering women who experienced violence by a former partner (24,200*, 91.4% for women with no post-school qualification and 33,400, 90.8%, for women with post-school qualifications). |
| Country of birth |
|---|
| Seven out of ten women who were born either in Australia or overseas sought advice or support about violence perpetrated by their current partner (16,100*, or 68.8%* for women born overseas and 29,600, or 69.1%, for women born in Australia): this percentage goes up to nine out of ten when considering women who experienced violence by a former partner (10,400* or 92.2% for women born overseas and 47,200 or 90.8% for women born in Australia). |
| Disability |
|---|
| Eight out of ten women who had a disability or long-term health condition (21,600, 78%) sought advice or support about violence perpetrated by their current partner: this percentage goes up to slightly more than eight out of ten when considering women who experienced violence by a former partner (19,500*, 83%). |
| Six out of ten women who did not have a disability or long-term health condition (24,100, 62.5%) sought advice or support about violence perpetrated by their current partner: this percentage goes up to more than nine out of ten when considering women who experienced violence by a former partner (38,100, 95.8%). |
Table A28
Note: Proportions have been rounded to deciles (“out of ten”) to assist with comparisons across groups.
For further data by demographic characteristics of victims, see:
Section 3: 2: Victim characteristics.
Section 3: 4.1.4 Contact with police by victim demographics.
4.2.4 Advice seeking by extent of violence
Women were more likely to seek advice and support about violence when they had experienced more than one incident.
Current male cohabiting partner
One in two women who experienced a single incident of current male cohabiting partner violence sought advice or support about the incident (41,500, 50.2%).
Tbl A28:C10
Two out of three women who experienced more than one incident sought advice and support about the violence (103,100, 66.8%).
E10
Former male cohabiting partner
A similar pattern was seen for previous male cohabiting partner violence, with:
- two thirds of women (227,600, 67%) seeking advice or support where there had been a single incident only; and
- eight out of ten women (727,800, 79.4%) who had experienced more than one incident seeking advice or support.
C19 E19
Asking for help is not “per incident”
Survey respondents were asked whether they had ever accessed advice and support about the violence that they had experienced. This means that when we compare women who had experienced “one incident” and “more than one incident” of violence, we do not know the relative likelihood of women asking for help when that likelihood is calculated on a “per incident” basis.
Women who have experienced more violence may report more advice seeking over the course of their relationship, but this does not mean that, per incident, they access more support. For example, if a woman experienced three incidents of violence and spoke to 20 friends about it, she would have been recorded in the same way as a woman who spoke to one person about 30 incidents (or 300).
For more statistics related to extent of violence, please see:
Section 3: 1.1.4.3 Extent of violence.
Section 3: 3.2: How recently did violence occur?
Section 3: 4.2.4 Advice seeking by extent of violence.
Section 3: 4.4.2 Fear by severity of violence.
4.3 Time off work
Most employed women continued to attend work after their most recent assault by a cohabiting partner.
By violence type
Survey participants were asked if they took time off work in the 12 months after their most recent assault, where this most recent incident by a male was perpetrated by a cohabiting partner. This leave was “as a result of the incident” and not just general time off work.
145,700 women who had been physically assaulted by a male cohabiting partner, took time off work in the 12 months after the incident. This is over one in four women who were employed during this time and who had experienced this type of violence.
Tbl A6:D15
One in five (19.8%) employed women who had been sexually assaulted by a male cohabiting partner took time off as a result of their most recent assault (29,000).
D32
By perpetrator type
A greater proportion of women took time off work because of their most recent physical assault by a male cohabiting partner than after a physical assault by a stranger or other known person.
Rows 15, 32
Country of birth
A little over one in four employed women born in Australia took time off work after their most recent physical assault by a male cohabiting partner (26%). Three out of ten employed women born overseas took time off work after this type of assault (29.7%*). There is no statistically significant difference in these estimates.
Tbl A7: Additional analysis of data
See also: Section 3: 2.3 Country of birth for relevant victim demographic information.
See also: Section 3: 4.5: Separations for data related to whether women move away from their family home.
4.4 Psychological impacts
The psychological impacts of cohabiting partner violence are significant. Women who live with their perpetrator reported feeling fear and anxiety after their most recent incident of violence at a higher rate than women who experienced violence by a known male (excluding cohabiting partner) or stranger. Women reported more fear and anxiety when they experienced violence more frequently.
Being afraid of violence vs being afraid due to emotional abuse
The information in this section is about the psychological impacts of violence. This data relates to fear associated with partner violence (defined as physical and sexual violence and excluding emotional abuse). These questions are asked only of people who have experienced violence that was perpetrated by a cohabiting partner.
This section includes a different set of questions than those asked about “emotional abuse by a partner” (see 3.3. of this section). Emotional abuse is not classified as violence in the PSS and is addressed in a separate set of questions that are asked of all participants.
Graph AD: Proportion of women who experienced anxiety or fear due to previous partner violence: By how often violence occurred and how often anxiety and fear experienced
Data tables for Graph AD:
Violence occurred all the time – How often felt fear or anxiety
| Frequency | Percentage |
|---|---|
| All of the time | ~61% |
| Most of the time | ~19% |
| Some of the time | ~13% |
| A little of the time/once | ~7% |
Violence occurred a little of the time – How often felt fear or anxiety
| Frequency | Percentage |
|---|---|
| All of the time | ~13% |
| Most of the time | ~27.5% |
| Some of the time | ~31.5% |
| A little of the time/once | ~28.5% |
Note: Data relates to incidents since the age of 15.
4.4.1 Anxiety and fear in the 12 months after violence
Ever experienced anxiety
Seven out of ten women who had ever experienced violence by a male previous cohabiting partner reported that they had experienced anxiety or fear due to the violence: this is just over 900,000 women (71.9%).
Tbl A26:C7
Of these women who had experienced fear or anxiety, a little over half (54%) experienced fear all or most of the time: this is close to half a million women (488,500).
C12-13
Anxiety in the 12 months prior to the survey
In the 12 months prior to the survey, one out of five women who had ever experienced violence by a male previous partner reported that they felt anxiety or fear due to the violence: this is a bit over a quarter of a million women (273,500, 21.8%). Many of these women would have experienced their most recent incident of violence more than a year ago.
C19
Of these women who had experienced fear or anxiety, about four out of ten (38.2%) experienced fear all or most of the time: this was 104,500 women.
C24 – 25
4.4.2 Fear by extent of violence
The PSS asks women about how frequently they have experienced violence by a previous cohabiting partner. The survey also asks how often they have felt anxiety or fear due to violence. When these two answers are cross-tabulated, we can see the relationship between the frequency of violence and the amount of fear that women experience.
Women who had experienced more frequent violence also experienced more frequent fear or anxiety.
Sometimes it only takes the threat of harm
Some women experience extreme anxiety in contexts where physical harm is rare or has never occurred. For these women, sustained patterns of coercive control and threat may create contexts of intense fear.
Of women who had experienced violence by their previous cohabiting male partner all of the time:
- Eight out of ten experienced fear or anxiety all or most of the time (67,300, 80.2%), of which six out of ten had experienced fear all of the time (51,300, 61.1%).
- One in 14 experienced fear only a little of the time or once only (6,000*, 7.1%*).
Tbl A27:B9, D9, H9
One in eight women who experienced infrequent violence (a little of the time or once only) experienced anxiety all of the time (38,000, 12.9%).
C12
Violence is not always scary
It may initially seem strange that one in 14 women experienced violence all of the time and yet they did not feel much fear about it. There are a range of reasons that this might be the case, including that the violence has become normalised or familiar. Some women may be engaged in bi-directional violence, where both partners are aggressive and where these physical arguments are part of the dynamic of the relationship. These fights, which do not have the elements of coercive control associated with domestic violence, may not be reported as frightening or experienced as abusive.
For more statistics related to extent of violence, please see:
Section 3: 1.1.4.3 Extent of violence.
Section 3: 3.2 How recently did violence occur?
Section 3: 4.1.5 Contact with police by extent of violence.
Section 3: 4.2.4 Advice seeking by extent of violence.
4.4.3 Fear and anxiety by type of violence
Where a woman’s most recent incident of violence was perpetrated by a male cohabiting partner, women reported that they experienced anxiety or fear for their personal safety in:
- Two thirds of incidents of physical assault (538,000, 66.1%); and
- Three quarters of cases of sexual assault (185,100, 74%), physical threat (158,300, 73%) and sexual threat (32,700, 74.9%).
Tbl A6:E11, E28, E22, E39
The difference between the rate of fear and anxiety for women who experienced physical assault and those who experienced sexual assault or physical threat was statistically significant.
4.4.4 Fear and anxiety by type of perpetrator
Women were most likely to experience fear and anxiety after their most recent incident of violence if that violence was perpetrated by a male cohabiting partner (when compared to incidents perpetrated by male strangers or known males). This trend is seen for all types of violence identified in the PSS (physical assault, physical threat, sexual assault and sexual threat).
Tbl A6: Rows 11, 22, 28, 39
Graph AE: Proportion of women experiencing anxiety or fear after the most recent incident of violence by a male perpetrator: By violence type and perpetrator type
Data tables for Graph AE:
| Perpetrator type | Physical assault | Sexual assault | Physical threat | Sexual threat |
|---|---|---|---|---|
| Cohabiting partner | 66.1% | 74% | 73% | 74.9% |
| Stranger | 54.8% | 64.2% | 50% | 59.5% |
| Other known | 51.1% | 52.6% | 59.9% | 51.5% |
Note: Data relates to incidents since the age of 15.
Table O: Proportion (estimate) of women experiencing anxiety or fear after the most recent incident: By violence type and perpetrator type
| Most recent incident of physical assault by a: | Proportion (estimate) of women reporting anxiety or fear after incident |
|---|---|
| Cohabiting partner | 66.1% (538,000) |
| Stranger | 54.8% (128,400) |
| Other known person | 51.1% (341,500) |
| Most recent incident of sexual assault by a: | Proportion (estimate) of women reporting anxiety or fear after incident |
|---|---|
| Cohabiting partner | 74% (185,100) |
| Stranger | 64.2% (86,200) |
| Other known person | 52.6% (246,300) |
| Most recent incident of physical threat by a: | Proportion (estimate) of women reporting anxiety or fear after incident |
|---|---|
| Cohabiting partner | 73% (158,300) |
| Other known person | 59.9% (160,800) |
| Stranger | 50% (109,000) |
| Most recent incident of sexual threat by a: | Proportion (estimate) of women reporting anxiety or fear after incident |
|---|---|
| Cohabiting partner | 74.9% (32,700) |
| Stranger | 59.5% (49,400*) |
| Other known person | 51.5% (55,600) |
Note: Limited to male perpetrators
4.4.5 Changes in routine due to fear and anxiety
Two thirds of women had changes in routine due to their fear or anxiety as a result of former male cohabiting partner violence. The following were the most common changes in routine:
- sleeping habits (103,000, 37.7%);
- social/leisure activities (97,900, 35.8%); and
- building or maintaining relationships (83,000, 30.3%).
Tbl A26:C39 C31 C37
4.5 Separation
About half of women who are no longer in a relationship with their violent partner reported that they separated several times prior to the final separation.
Women returned to violent relationships for a range of reasons, with the three most common being that the partner promised to stop assaults, threats or abuse; commitment to relationship; and, for the sake of the children. About half of women who reported experiencing violence from their cohabiting partner indicated that the violence was the main reason for their separation (regardless of if it was a temporary or final separation). A quarter of women reported that the violence increased after their final separation.
4.5.1 Temporary separations from a current partner
149,200 women who experienced violence by their current partner had never separated from their current partner. Just over half of these women (81,900, 54.9%) wanted to leave their current partner but never had.
Tbl 29: B66 C63
In the remainder of this section, similar data is presented for temporary separation from current partner (4.5.1), temporary separation prior to final separation (4.5.2) and final separation from former partner (4.5.4). As different populations are used throughout this section, care should be taken when making comparisons across these groups.
Temporarily separated
87,900 women who had experienced violence in their current relationship had temporarily separated from their current cohabiting partner. This is 37.1% of women who were currently in a relationship that had involved at least one incident of violence. The vast majority (75,100, 85.4%) of these women did not experience violence while separated.
B34 C34 B42
Moved away
Approximately half the women who separated from their partner moved out of their home (45,600, 51.9%). Of these women, three quarters stayed at a friend or relative’s house (35,000, 76.8%).
B48 B55
Experienced violence
12,800* women experienced violence while temporarily separated from their current partner.
B41
Oh, that makes sense…
A current partner is someone the respondent is still in a relationship with. This means that any separation that they have experienced with their current partner must have been temporary.
Warning – definition change ahead
This section relates to male cohabiting partners only.
4.5.2 Temporary separations prior to final separation from former male partner
A most recently violent previous male partner? Are all those words really necessary?
In the detailed partner module, the PSS only asks about a person’s most recently violent previous partner. This means that if they had experienced violence by more than one previous partner, only data about the most recently violent partner is collected. Thus, the data below should not be considered a representation of separation patterns for all separations from violent previous partners.
Temporarily separated
Of women who are no longer in a relationship with their most recently violent previous male cohabiting partner, half had temporarily separated at least once prior to the final break up (594,200, 50.1%).
Tbl A24:C7
Of women who had temporarily separated from a violent former partner:
- a third had one temporary separation (199,800, 33.6%);
- a third separated two or three times (206,000, 34.7%); and
- a third separated more than three times (188,000, 31.6%).
C12 C13-14 C15
Violence while separated
Two out of five women experienced violence while temporarily separated from their violent former male cohabiting partner (242,100, 40.7%).
C19
Six out of ten women who experienced violence while temporarily separated reported an increase in violence during the separation (138,200):
- 76,500 women had experienced an increase in violence during a temporary separation: this is one in three women who experienced violence while temporarily separated from a male previous partner;
- An additional 61,300 women had experienced violence for the first time during the temporary separation: this is one in four women who had experienced violence while temporarily separated from a male previous partner.
Aditional analysis, B29, B24
Graph AF: Women who had temporary separations from their most recently violent previous male cohabiting partner: Number of temporary separations prior to final separation
Data table for Graph AF:
| Number of temporary separations prior to final separation | Percentage |
|---|---|
| One temporary separation | 31.6% |
| Two or three temporary separations | 34.7% |
| More than three temporary separations | 33.6% |
Note: Data relates to incidents since the age of 15. Does not add to 100% due to rounding.
Moved away
Two thirds of women who had temporarily separated from their most recently violent previous male cohabiting partner, had moved away from their home during the temporary separation (378,300, 63.7%).
Tbl A24:C34
When women could list all the places that they stayed during temporary separations:
- Four out of five women said they stayed with a friend or family member (301,700, 79.7%);
- Three out of ten (103,500, 27.4%) said they relocated to a new house or rental property;
- One in seven stayed at a shelter or refuge (54, 600, 14.4%); and
- One in 12 slept rough, such as on the street, in a car, in a tent or squatted in an abandoned building (30,600, 8.1%).
C39 C43 C40 C42
Looking similar but not the same
The ABS has published data on separations on its website. Table 30 looks similar to the data represented here, but the numbers are slightly different. The reason for the difference is that we are limited to male cohabiting partners, while the previous ABS tables include both male and female cohabiting partners.
4.5.3 Reasons for returning to partner
Common reasons for returning
Women reported the same top three reasons for returning to a violent male partner, regardless of whether or not they were permanently separated from their partner at the time of the survey. When women could give multiple answers, the most common reasons were:
- partner promised to stop assaults, threats or abuse;
- commitment to relationship; and
- sake of the children.
The order of these priorities varied depending on whether the woman was describing returning to:
- a partner they were still with at the time of the survey (current cohabiting partner); or
- a partner they were no longer in a relationship with (former cohabiting partner).
Women returning to a current cohabiting partner were most likely to say that commitment to the relationship was a reason for returning to the relationship (40,900, 46.5%).
Tbl A25: C22
In contrast, the most common reason for returning to a former partner was the partner’s promise to stop the assaults, threats or abuse (267,800, 45.1%).
Tbl A24: C48
Graph AG: Proportion of women who experienced male cohabiting partner violence, top three reasons for returning to partner after temporary separation: By partner type
Data table for Graph AG:
| Reason for returning to partner after temporary separation | Current cohabiting partner | Previous cohabiting partner |
|---|---|---|
| Sake of the children | ~29.1% | ~30.3% |
| Commitment to relationship | ~46.5% | ~36.7~ |
| Partner promised to stop violence/abuse | ~26% | ~45.1% |
Note: Respondents could nominate more than one reason for returning. Data relates to incidents since the age of 15.
Uncommon reasons for returning
There are a number of less common reasons given for women returning to their violent cohabiting partner.
When women could give multiple answers, and of women who had temporarily separated from a violent previous male partner:
- one in eight said they returned because they had no money/financial support (70,800, 11.9%);
- one in 12 said they returned because they had nowhere to go (51,500, 8.7%);
- one in 14 said they returned because of shame or embarrassment (41,000, 6.9%); and
- one in eight said they returned because of fear of their partner (71,600, 12%).
Tbl A24:C49, C50, C52, C53
The characteristics were similar for temporary and final separations from a former violent cohabiting partner.
4.5.4 Final separation from former partner
Violence after final separation
For a quarter of the women who had experienced violence in their relationship with a male, the violence increased after the final separation (217,500, 24.4%).
Tbl A24:C69
Moved away
Consistent with temporary separations, two out of three women moved away from their homes at the end of their relationship with a violent male cohabiting partner (731,900, 61.8%). Two thirds of these women stayed with friends or family (464,600, 63.5%). However, unlike temporary separations, 42.6% (311,900) relocated to a new home (including a rental property).
C74, C79, C83
Less stable accommodation may have been experienced by some women, including those who stayed at:
- a refuge or shelter (57,000, 7.8%);
- motel, hotel, boarding house etc. (45,500, 6.2%); and
- slept rough (on street, in car, squatted etc.) (12,100*, 1.7%*).
C80, C81, C82
Loss of assets
Over half a million women left property or assets behind when they left the relationship with their most recent violent previous partner: this is seven out of ten women who experienced violence in a previous relationship.
C88
This isn’t adding up?
Women were asked about all the types of accommodation that they used after their separation, and could select all the types that applied to them. This is why the types of accommodation add up to more than 100%.
4.5.5 Reasons for last separation
The PSS asks women for the main reason for their most recent separation from a violent partner. In this question, the respondent is only able to give one answer, meaning that the total is 100%.
Regardless of whether the woman ultimately returned to her partner or not, about half of the women said that the main reason for leaving was their partner’s assaults, threat or abuse towards themselves or their children.
One in eight women who had permanently separated from a violent previous partner gave “better life for children” as their main reason for leaving (152,700, 12.9%). One in 20 women who had temporarily separated from their current partner gave this reason (4,600*, 5.2%*).
One in 14 women who had permanently separated from a violent previous partner said that their partner initiated the separation (and gave this as the main reason for separation) (85,900, 7.2%). One in nine women who had temporarily separated from their current partner gave this reason (9,900*, 11.2%*).
Tbl A24: C59, Tbl A25: C12, Tbl A24: C60, Tbl A25: C13, Tbl A24: C62, Tbl A25: C14,
The nature of cohabiting partner violence, including the practical realities of living with the perpetrator, make the impacts of this form of violence potentially more complex than the impacts of violence committed by people with a different type of relationship to the victim. The PSS highlights the high number of women who experience fear in their cohabiting violent relationships, while simultaneously noting the relatively low rate of contact with police. A large number of women do not want to leave their violent partners, but when they do, they often have several temporary separations prior to the final breakup.
In the following section we examine data related to women’s experiences of multiple victimisations. This analysis includes repeat victimisation in adulthood, as well as victimisation as both a child and an adult.
Section four: Women’s experience of multiple victimisation
Women may experience multiple violent incidents across their life span. This can happen in a number of ways, such as when a women experiences:
- violence both as a child and as an adult;
- different types of violence as an adult;
- the same type of violence perpetrated by different people; or
- multiple incidents of a single violence type (perpetrated by either one person or multiple people).
The PSS provides rich data on multiple victimisation, however it can be complex to distinguish between data sets. For this reason, we have included a description of the study population before each section of data.
Due to the increased complexity of the data, this section of the report is organised differently to the other three data sections. High level prevalence information has been repeated across this section to help the reader be clear where sub-populations are being drawn from.
Contents for this section
1 Multiple victimisation as an adult
1.1 Sexual and physical violence
1.2.1 Multiple incidents of sexual violence
1.2.2 Same or different perpetrator of multiple incidents
1.3.1 Multiple incidents of physical violence
1.3.2 Same or different perpetrator of multiple incidents
1.4.1 Multiple incidents of violence
1.4.2 Victim demographics for all women who had experienced multiple adult victimisations
1.4.2.2 State or territory of residence
2 Victimisation as both a child and adult
2.1.1 Sexual violence perpetrated against an adult
2.1.2 Sexual abuse perpetrated against a child
2.2.1 Physical violence perpetrated against an adult
2.2.2 Physical abuse perpetrated against a child
3 Multiple victimisation as a child
1 Multiple victimisation as an adult
1.1 Sexual and physical violence
The majority of women who had experienced sexual violence had also experienced physical violence.
1.1.1 Since the age of 15
Physical violence and sexual violence
Since the age of 15, 1,141,600 women had experienced both physical violence and sexual violence. This is:
- 38% of women who had experienced physical violence;
- 67.3% of women who had experienced sexual violence; and
- 13% of all women in Australia
Tbl A35: N18
When we narrow to instances of assault only, 944,200 women had experienced both sexual and physical assault. This is:
- 36.2% women who had experienced physical assault;
- 63.2% of women who had experienced sexual assault; and
- 10.8% of all women in Australia.
B10
1.1.2 In the last 12 months
Physical violence and sexual violence
In the 12 months prior to completing the survey, 38,300 women had experienced both physical violence and sexual violence. This is:
- 9.5% of women who had experienced physical violence in the last 12 months; and
- 37.4% of women who had experienced sexual violence in the last 12 months.
Tbl A35: N30 O30
When we narrow to instances of assault only, 29,100 women had experienced both sexual and physical assault. This is:
- 11% of women who had experienced physical assault in the last 12 months; and
- 33.1% of women who had experienced sexual assault in the last 12 months.
B22 C22
Graph AH : Women who experienced both sexual and physical violence as a number and proportion of all victims: By violence type
Data table for Graph AH:
| Violence type | Both sexual and physical violence | One type only |
|---|---|---|
| Experienced physical and sexual violence | 1,141,600 | – |
| Experienced physical violence | 38% | 62% |
| Experienced sexual violence | 67.3% | 32.7% |
Note: Data relates to incidents since the age of 15.
1.2 Sexual violence
Since the age of 15, close to 1 million women have experienced multiple incidents of sexual violence. The majority of women reported that the incidents were perpetrated by different men.
In this section, we are looking at the following scenario:
Women who have experienced more than one incident of sexual violence as an adult.
Please note: in this section, a woman who had experienced one incident of sexual assault and one incident of physical assault would not be counted as having experienced more than one incident.
This section is limited to male perpetrators.
1.2.1 Multiple incidents of sexual violence
944,000 women had experienced more than one incident of sexual violence by a male perpetrator since the age of 15.
Tbl A33: L31
This is:
- 56.1% of women who had experienced sexual violence; and
- 10.8% of all women in Australia;
M31
Warning – definition change ahead!
The data on the next page relates to sexual assault only (the data in Section 1.2.1 above relates to sexual violence – sexual assault and/or threat).
1.2.2 Same or different perpetrator of multiple incidents
The majority of women who experienced multiple incidents of sexual assault reported that the violence was perpetrated by different men (515,800).
Tbl A34: F31
Of women who had experienced multiple incidents of sexual assault by a male perpetrator (839,400):
- More than one third reported that these incidents were all perpetrated by the same man (323,600).
- Two thirds reported that the incidents were perpetrated by different men. This is:
- 515,800 women; and
- one in 17 women in Australia.
F32, F30, F31
Country of birth
A small amount of analysis was possible by demographic characteristics of the female victim.
There was no statistically significant difference in the rate of multiple incident sexual assault victimisation for women born in Australian (648,600, 56.2%) as compared to women born overseas (190,900, 57.8%).
Tbl A33:H11 H26
A percentage of whom?
The percentages in the paragraph above relate to the total number of women who had experienced sexual assault and were born in the relevant countries. Thus, they should read: 56.2% of women who were born in Australia and had experienced sexual assault reported that they had experienced more than one assault.
A small number of women have experienced a single scenario of violence that involved multiple perpetrators (e.g. a gang rape). This would be classified in the survey as multiple incidents by multiple persons.
1.3 Physical violence
1.7 million women have experienced multiple incidents of physical violence by a male perpetrator, with the majority of these women reporting that all incidents were perpetrated by the same man.
In this section, we are looking at the following scenario:
The data reported in this section relates to women who have experienced more than one incident of physical violence as an adult.
Please note: in this section, a woman who had experienced one incident of sexual assault and one incident of physical assault would not be counted as having experienced more than one incident.
This section is limited to male perpetrators.
1.3.1 Multiple incidents of physical violence
1,747,400 women had experienced more than one incident of physical violence by a male perpetrator since the age of 15.
Tbl A33: F31
This is:
- 63.5% of women who had experienced physical violence; and
- one in five women in Australia (20%).
G31
1.3.2 Same or different perpetrator of multiple incidents
The majority of women who had experienced multiple incidents of physical assault reported that the violence was perpetrated by the same man.
Of women who had experienced multiple incidents of physical assault by a male perpetrator (1,453,100):
- Two thirds reported that these incidents were all perpetrated by the same man. This is:
- 961,500 women; and
- One in nine women in Australia.
- One third reported that the incidents were perpetrated by different men (491,600).
Tbl A34:B32, B30, B31
By country of birth
There was no statistically significant difference in the rate of multiple incident physical assault victimisation for women born in Australia (1,107,200, 61.9%) as compared to women born overseas (345,900, 57.1%).
Tbl A33:B11, B26
Graph AI: Number of women who experienced multiple incidents of violence by a male perpetrator: By same or different perpetrator
Data table for Graph AI:
| Assault type | All same man | Different men |
|---|---|---|
| Physical assault | 961,500 | 491,600 |
| Sexual assault | 323,600 | 515,800 |
Note: Data relates to incidents since the age of 15.
1.4 All violence
Since the age of 15, one quarter of all women in Australia have experienced more than one incident of violence.
1.4.1 Multiple incidents of violence
In this section, we are looking at the following scenario:
Women who have experienced more than one incident of any type of violence as an adult.
Please note:
- This section is limited to male perpetrators.
- Women in this section may have experienced multiple incidents of sexual violence or physical violence or both.
Since the age of 15, almost 2.3 million women have experienced more than one incident of violence by a male perpetrator. This represents:
- two thirds of women who had experienced violence by a male perpetrator as an adult (67.8%); and
- one in four women in Australia (26%).
Tbl A33: N31 O31
1.4.2 Victim demographics for all women who had experienced multiple adult victimisations
Four out of five women who had experienced violence by a male perpetrator in the year prior to the survey reported having experienced more than one incident of violence. Women older than 35 years, with a disability and of lower socio-economic status reported an increased rate of repeat victimisation in the year prior to the survey.
In this section, we are looking at:
The demographic characteristics of women who have experienced more than one incident of violence as an adult.
Please note:
- This section is limited to male perpetrators.
- Women may have experienced their incidents of violence across violence types.
- In this section, a woman who had experienced one incident of sexual assault and one incident of physical threat would be counted as having experienced more than one incident of violence.
- Percentages in this section are a subset of the population of women who have experienced violence – they are not a subset of all women in Australia.
What is the national rate?
Of women in Australia who have experienced violence by a male perpetrator in the last 12 months, 81.1% had experienced more than one incident. This is 307,900 women.
Graph AJ : Women who had experienced violence by a male perpetrator in the last 12 months, proportion who experienced multiple incidents: By sociodemographic characteristics
Data table for Graph AJ:
| Sociodemographic characteristic | Percentage |
|---|---|
| National rate | ~81% |
| 45-54 years | ~95% |
| 35-44 years | ~91% |
| Not in workforce/unemployed | ~90.5% |
| With a disability | ~92.5% |
| Lowest SES quintile | ~92.5% |
| Second lowest SES quintile | ~89.5% |
1.4.2.1 Broad age groups
The rate of repeated victimisation in adulthood varied significantly with age. When compared to the national average, women aged 35-54 years were at increased risk of having experienced multiple incidents of violence by a male perpetrator in the year before the survey. (This difference does not reflect the relative age of the women, as the data is for a constant time period – namely the 12 months prior to the survey).
Tbl A32:E21, E22
Of women who had experienced violence, 95.1% of women aged 45-54 years, and 91.1% of women aged 35-44 years had experienced more than one incident in the 12 months prior to the survey.
E22 E21
The difference between the rates for women aged 35-44 years and 45-54 years and the national rate was statistically significant.
1.4.2.2 State or territory of residence
Rates of women reporting multiple incidents of violence by a male perpetrator during the 12 months prior to the survey varied significantly between jurisdictions.
In comparison to the national average, and as a proportion of all women who had experienced at least one incident of violence by a male perpetrator:
- NSW had a smaller proportion of women who had experienced multiple incidents of violence (70,500, 65.5%).
- Victoria had a higher proportion of women who had experienced multiple incidents of violence (90,300, 94.7%).
Tbl A32:E9, E10
1.4.2.3 Country of birth
When we compared women born in Australia and overseas, there was no statistically significant variation in the proportion of women who had experienced more than one incident of violence by a male perpetrator in the 12 months prior to the survey.
Tbl A32:E34-37
1.4.2.4 Labour force
In comparison to the national average, women who were unemployed or not in the workforce were more likely to experience multiple incidents of violence by a male perpetrator.
Of women who had experienced violence by a male perpetrator in the year prior to the survey:
- 76.7% of employed women had experienced more than one incident of violence.
- 90.5% of women who were unemployed or not in the workforce had experienced more than one incident of violence.
Tbl A32:E26 E27
Information on the definition of labour force is in Section 2: 2.4 Labour force participation.
1.4.2.5 Level of education
There was no statistically significant difference between women who have (78.4%) and have not (86.7%) completed a post-school qualification, when looking at women who experienced more than one incident of violence by a male perpetrator in the 12 month prior to the survey.
Tbl A32:E31, E30
1.4.2.6 Disability status
Of women with a disability who had experienced violence by a male perpetrator in the year prior to the survey, 92.2% had experienced more than one incident. This is statistically significantly higher than the national average.
Tbl A32:E54
Information on the definition of disability is in Section 2: 2.6: Disability status.
1.4.2.7 Socio-economic status
Compared to the national rate, women whose household incomes were in the bottom 40% were more likely to experience more than one incident of violence by a male perpetrator (92.4% for lowest quintile, 89.5% for second quintile).
Tbl A32:E40, E41
There was no statistically significant difference between the national rate and the socio economic quintiles when these were calculated using the IRSAD.15
E47 – E51
Information on the measures of SES status is in Section 2: 2.7 Socio-economic status.
2 Victimisation as both a child and adult
What is child abuse?
As part of the PSS, respondents are asked about their experiences of abuse when they were under the age of 15.
The ABS defines child abuse as the deliberate harm of a person under the age of 15. There are two types of child abuse defined for the survey:
- Physical abuse – “any deliberate physical injury (including bruises) inflicted upon a child (before the age of 15 years) by an adult. Discipline that accidentally resulted in an injury is excluded.”
- Sexual abuse -“an act by an adult involving a child (before the age of 15 years) in sexual activity beyond their understanding or contrary to currently accepted community standards.”
Glossary
2.1 Sexual violence
If a woman experienced childhood sexual abuse, she typically reported that she had experienced more than one incident of abuse. Approximately 650,000 women who experienced sexual violence by a male perpetrator as an adult also experienced some kind of violence by a male perpetrator when they were a child.
2.1.1 Sexual violence perpetrated against an adult
1,683,700 women reported that they had experienced sexual violence by a male perpetrator since the age of 15.
Tbl A30: F16
In the paragraph below, we are looking at the following scenario:
- Women who have experienced both:
- any type of abuse as a child; and
- sexual violence as an adult.
Please note: for both child abuse and adult violence, the data is limited to male perpetrators only.
This section includes all perpetrator types (strangers, family, cohabiting partners, co-workers etc).
Women who experienced sexual violence as an adult and child abuse
651,600 of women who had experienced sexual violence by a male perpetrator since the age of 15 also experienced child abuse by a male perpetrator. This is:
- 38.7% of women who had experienced adult sexual violence by a male perpetrator; and
- one in fourteen women in Australia (7.5%).
Tbl A30: B16 C16
Most of these women had experienced sexual assault (584,400, 89.7%), with a much smaller number having experienced sexual threat (161,500, 24.8%).
B14 B15
Some women will have experienced more than one form of sexual victimisation as an adult, meaning that the sub-types do not add up to the total for sexual violence (651,600).
2.1.2 Sexual abuse perpetrated against a child
1.1 million women reported they had experienced sexual abuse when they were a child.
Tbl A29: F16
In the following section, we are looking at this scenario:
- Women who had experienced both:
- sexual abuse as a child more than once; and
- any type of violence as an adult;
Please note:
- Information is disaggregated by adult violence type.
- Both male and female perpetrators are included.
- This section includes all perpetrator types (strangers, family, cohabiting partners, co-workers etc).
More than one incident of childhood sexual abuse
Seven out of ten women who experienced sexual abuse as a child reported that it happened more than once (70.4%).
Tbl A29: F18
Also experienced victimisation as an adult
Of women who experienced more than one incident of sexual abuse as a child (775,800):
- 317,700 also experienced sexual assault as an adult.
- 101,500 also experienced sexual threat as an adult.
- 438,900 also experienced physical assault as an adult.
- 213,000 also experienced physical threat as an adult.
F18, T18, Z18, B18, H18
Some women will have experienced more than one form of victimisation as an adult, meaning that the types of adult violence will not add up to 775,800.
2.2 Physical violence
Almost all victims of physical abuse as a child reported that they had experienced more than one incident of abuse. One in nine women in Australia have experienced both physical abuse as a child and physical violence as an adult, with both acts at the hands of a male perpetrator.
2.2.1 Physical violence perpetrated against an adult
2,753,500 women reported that they had experienced physical violence by a male perpetrator since the age of 15.
Tbl A30:F11
In the paragraph below, we are looking at the following scenario:
- Women who have experienced both:
- any type of abuse as a child; and
- physical violence as an adult.
Please note:
- For both child abuse and adult violence, data is limited to male perpetrators only.
- This section includes all perpetrator types (strangers, family, cohabiting partners, co-workers etc).
Women who experienced physical violence as an adult and as a child
970,300 women who had experienced physical violence by a male perpetrator since the age of 15 had also experienced child abuse by a male perpetrator. This is:
- 35.2% of women who had experienced adult physical violence by a male perpetrator.
One in nine women in Australia (11.1%).
Tbl A30: B11, C11
Most of these women experienced physical assault (876,800, 90.4%), with a significantly smaller number having experienced physical threat (362,100, 37.3%).
B9, B10
Some women will have experienced more than one form of physical victimisation as an adult, meaning that the sub-types of adult violence do not add up to the total for physical violence (970,300).
2.2.2 Physical abuse perpetrated against a child
938,100 women reported that they had experienced physical abuse as a child.
Tbl A29: F10
In the following section, we are looking at this scenario:
- Women who have experienced both:
- physical abuse as a child more than once; and
- any type of violence as an adult.
Please note:
- Information is disaggregated by adult violence type.
- Both male and female perpetrators included.
- This section includes all perpetrator types (strangers, family, cohabiting partners, co-workers etc).
More than one incident
Nine out of ten women who had experienced physical abuse when they were a child said that it had happened more than once (90.4%).
Tbl A29
Also experienced victimisation as an adult
Of the women who experienced more than one incident of physical abuse as a child (848,500):
- 328,400 also experienced sexual assault as an adult.
- 104,300 also experienced sexual threat as an adult.
- 541,900 also experienced physical assault as an adult.
- 241,300 also experienced physical threat as an adult.
Tbl A29: F12, T12, Z12, B12, H12
Some women will have experienced more than one form of victimisation as an adult, meaning that the types of adult violence will not add up to 848,500.
Figure L: Number of women who experienced child abuse, cohabiting partner violence or both over their lifetime
2.3 All violence
A third of women who had experienced child abuse reported that, as an adult, they had experienced violence by a cohabiting partner. Similarly, a third of victims of cohabiting partner violence reported that they had experienced abuse when they were a child.
In this section, we are looking at the following scenario:
- Women who reported that they had experienced any type of child abuse and, as an adult, had also experienced cohabiting partner violence.
Please note:
- All types of child abuse and all types of cohabiting partner violence were included in the analysis.
- Types of violence were not disaggregated.
- Male and female perpetrators of both child abuse and cohabiting partner violence are included.
Child abuse
1,668,400 women reported that they had experienced abuse as a child.
Tbl 31: F18
Cohabiting partner violence
1,479,900 women reported that, as an adult, they had experienced violence by either a current and/or former cohabiting partner.
Tbl 31: B21
Childhood abuse and partner violence
Across their lifetime, 540,800 women had experienced both cohabiting partner violence and abuse when they were a child. This is:
- 32.4% of all women who had experienced childhood abuse.
- 36.5% of all women who had experienced cohabiting partner violence.
- 6.2% of women in Australia.
B18, C18
The category of cohabiting partner includes both former and current partners who have lived with the survey respondent in a marriage or de facto relationship.
Childhood abuse but not partner violence
Across their lifetime, 1,127,600 women have experienced abuse when they were a child but not violence from a cohabiting partner. This is:
- 67.6% of all women who have experienced childhood abuse.
- 12.9% of women in Australia.
Tbl 31: D18, E18
Cohabiting partner violence but not childhood abuse
Across their lifetime, 939,100 women have experienced cohabiting partner violence but not abuse when they were a child. This is:
- 63.4% of all women who have experienced cohabiting partner violence.
- 10.8% of women in Australia.
B19
3 Multiple victimisation as a child
In this section, we are looking at the following scenario:
Women who reported that they had experienced multiple incidents of the same type of abuse as a child.
More women reported that they had experienced childhood sexual abuse (1,102,100) than childhood physical abuse (938,100).
Tbl A29: F16, F10
More than one incident
The majority of women who reported that they had experienced child abuse said that they had experienced more than one instance of abuse:
- 90.5% (848,500) of women reported having experienced more than one instance of physical abuse before the age of 15; and
- 70.4% (775,800) of women reported having experienced more than one instance of sexual abuse before the age of 15.
Tbl A29: F12, F18
Perpetrator of first incident
The most commonly reported perpetrator of the first incident of child abuse varied between incidents of physical and sexual abuse. 80.6% (756,300) of women reported that the perpetrator of their first incident of physical abuse was a parent. In comparison, 44.4% (489,400) of women reported that the perpetrator of their first incident of sexual abuse was a non-familial known person, and 13.8% (152,100) reported the perpetrator of their first incident of sexual abuse was by a parent.
Tbl A31:C9, E12, E9
Graph AK: Number of women who reported experiencing child abuse: By selected relationship to perpetrator of first incident and type of abuse
Data table for Graph AK:
| Relationship to perpetrator | Physical abuse of a child | Sexual abuse of a child |
|---|---|---|
| Non-familial known person | ~92,000 | ~489,400 |
| Relative or in-law | ~55,000 | ~304,100 |
| Parent | ~756,300 | ~152,100 |
In this section we described PSS data that demonstrated how violence disproportionately affects some women. Four out of ten women in Australia had experienced at least one violent incident in their lifetime: of these women, about a third had experienced separate incidents of both sexual and physical violence. In addition, most victims have experienced repeated incidents of violence, with 81.1% of women who had experienced violence by a male perpetrator in the last 12 months reporting that they had experienced more than one incident during that time period.
We now turn to our concluding section, where key themes from this report are identified.
Concluding remarks
For a summary of the data analysed in this project, please see the Executive Summary.
So much new knowledge
The ANROWS PSS analysis provides several hundred new statistical items related to violence against women. Almost all the data in this report is new – not only has this information not been publicly available before, but the data tables themselves have not been generated previously.
The ANROWS PSS report provides significantly more detail on the demographic characteristics of victims and perpetrators, incident characteristics and the impact of violence than has previously been available. This detail helps us to move beyond pre-conceived understandings of violence and identify unexpected patterns of victimisation.
ANROWS has reported data related to a definition of intimate partner that includes both cohabiting and non-cohabiting partners. This new definition more fully captures the nature of relationships within which women may experience intimate partner violence and helps demonstrate the full extent of violence against women.
This report provides a rich and nuanced understanding of violence by focusing on the relationships between data points. For instance:
- data on women’s engagement with the justice system was reported as a set of inter-related data points, so that the overall pattern of engagement was highlighted; and
- data based on seven definitions of multiple victimisation were explored in order to demonstrate the range of ways that women were repeatedly impacted by violence.
Such work helps to bring forward the complexities of lived experience and to highlight cross-group differences that may initially appear insignificant but which, over the course of a range of decision points, result in large differences in outcomes.
This report also provides substantial explanation of the conceptual structure of the PSS. By embedding discussions of definitions and data structure throughout the report, the reader is more easily able to understand what the statistics do (and do not) mean.
There’s no single way of knowing everything
The PSS is a complex tool for looking at a complex social problem. The ABS aims to provide a systematic approach to a lived experience that often does not have clear lines and boundaries.
The PSS is the most comprehensive quantitative dataset on interpersonal violence in Australia. It provides an incredible amount of detail about incidents of violence and their ongoing impact on women’s and men’s lives. It cannot, however, capture the full scope of the lived experience of violence. There are a number of reasons for this:
- It is very difficult to use quantitative research methods to get information about the quality of an experience. While the PSS is very good for counting things, it is less helpful in understanding the reasons why the pattern of numbers exists in the first place. This latter task is the terrain of qualitative research and is an area that the PSS cannot, and should not, be attending to.
- The PSS data is layered in a way that can make sub-population analysis difficult. Data becomes more fragile as more limitations are placed on it. Therefore, examination of sub-populations can be difficult because the estimates quickly become too unreliable for general use. Cross referencing multiple contextual factors can also be difficult for the same reason, so that while extensive detail is available about incidents of violence, the ability to build an understanding of how these factors interact can be more limited.
This is just the beginning
The ANROWS PSS report is a snapshot of the data available in the PSS. The report provides a summary of the data that was requested by ANROWS, with much of the detail needing to be put to one side in order to produce a report that was both understandable and of a reasonable length.
The data requested by ANROWS is now publicly available and is on the ANROWS website. If you are interested in further research using the PSS data, we encourage you to use these tables as a basis of your own analysis. We consider that the following are particularly worthy of further investigation:
- similarities and differences in the nature of violence experienced by cohabiting and non-cohabiting intimate partners;
- similarities and differences in the impact of violence for women with different demographic characteristics (including, possibly, the impact of multiple characteristics); and
- the nature and impact of the intersection of violence types, including the various forms of multiple victimisation that are captured by the PSS, as well as intimate partner sexual violence.
The PSS is currently a largely untapped resource – even the publicly available PSS data has yet to be fully explored and applied to the most obviously relevant research and policy contexts.
But what does it all mean?
The key statistical findings of this report are contained in the Executive Summary. However, there are also key theoretical findings that are worthy of note. These are:
- While there is often a type of experience that is (statistically) common, there is no universal experience that is common to all victims. Even “obvious” experiences, such as being afraid after an assault, are not experienced by everyone.
- Patterns of victimisation and the impacts of violence vary across demographics, with gender of the victim being the most pronounced variable.
- In order to understand quantitative data, we must work within the definitional and mathematical confines of the survey instrument.
Onward!
As of mid-2015, the ABS is in the midst of developing the 2016 PSS. It is an exciting time to be considering and engaging with this rich social data.
References
Council of Australian Governments. (2011). The National Plan to Reduce Violence against Women and their Children: Including the first three-year action plan. Canberra: FAHCSIA.
Grulich, A. E., de Visser, R. O., Badcock, P. B., Smith, A. M., Heywood, W., Richters, J., . . . Simpson, J. M. (2014). Homosexual experience and recent homosexual encounters: the Second Australian Study of Health and Relationships. Sexual Health, 11(5), 439-450.
Footnotes
- Although all participants are over 18 years, much of the survey asks them to report their experiences of violence since the age of 15. ↑
- Our Watch was founded under the First Action Plan of the National Plan to Reduce Violence against Women and their Children as Australia’s national organisation for preventing violence against women and their children. ↑
- Due to the hierarchy of incidents used in the PSS data collection (see the introduction of this report), this number represents women who have experienced an incident of physical threat that did not involve physical assault, sexual threat or sexual assault. ↑
- A known person includes cohabiting partner, boyfriend/girlfriend/date, father or mother, son or daughter, brother or sister, other relative or in-law, teacher, friend, acquaintance or neighbour, employer/boss/supervisor, co-worker/co-volunteer, counsellor/psychologist/psychiatrist, doctor, priest/minister/rabbi etc., prison officer and any other known persons. ↑
- A woman may have been sexually assaulted by both a boyfriend/date and a cohabiting partner. ↑
- Perpetrator’s drug and alcohol use is reported by the victim. ↑
- RSE for this estimate is not available as it uses data from multiple tables. ↑
- A known person includes cohabiting partner, boyfriend/girlfriend/date, father or mother, son or daughter, brother or sister, other relative or in-law, teacher, friend, acquaintance or neighbour, employer/boss/supervisor, co-worker/co-volunteer, counsellor/psychologist/psychiatrist, doctor, priest/minister/rabbi etc., prison officer and any other known persons. ↑
- Due to the hierarchy of incidents used in the PSS data collection (see the introduction of this report), this number represents women who have experienced an incident of physical threat that did not involve physical assault, sexual threat or sexual assault. ↑
- A woman may be victimised by both a cohabiting partner and a boyfriend/girlfriend/date. ↑
- Women could have experienced violence by both male and female partners. ↑
- Women could have experienced violence by multiple perpetrators. ↑
- All intimate partner violence in this age group is reported to have been from cohabiting partners. ↑
- These women may, or may not, also experience sexual violence. ↑
- Includes boyfriend or date, father, son, brother, other relative or in-law, teacher, friend, acquaintance or neighbour, employer/boss/supervisor, co-worker/co-volunteer, counsellor/psychologist/psychiatrist, doctor, priest/minister/rabbi etc., prison officer, ex-boyfriend and any other known persons. ↑