
RESEARCH REPORT The nature and extent of domestic and family violence exposure for children and young people with disability
Olivia Octoman
Australian Centre for Child Protection,
University of South Australia
Dr Martine Hawkes
Australian Centre for Child Protection,
University of South Australia
Fernando Lima
Australian Centre for Child Protection,
University of South Australia
Associate Professor Melissa O’Donnell
Australian Centre for Child Protection,
University of South Australia
Dr Carol Orr
School of Population and Global Health,
University of Western Australia
Professor Fiona Arney
Director, Arney Chong Consulting
Associate Professor Tim Moore
Australian Centre for Child Protection,
University of South Australia
Professor Sally Robinson
Disability and Community Inclusion,
College of Nursing and Health Sciences,
Flinders University
Professor Kylie Valentine
Social Policy Research Centre,
University of New South Wales
Dr Amy Marshall
Disability and Community Inclusion,
College of Nursing and Health Sciences,
Flinders University
Jala Burton
Disability and Community Inclusion,
College of Nursing and Health Sciences,
Flinders University
Professor Chris Brebner
Centre for Innovation in Learning and Teaching,
Flinders University
RESEARCH REPORT
ISSUE 16 | SEPTEMBER 2022
ANROWS acknowledgement
This material was produced with funding from the Australian Government and the Australian state and territory governments. Australia’s National Research Organisation for Women’s Safety (ANROWS) gratefully acknowledges the financial and other support it has received from these governments, without which this work would not have been possible. The findings and views reported in this paper are those of the authors and cannot be attributed to the Australian Government, or any Australian state or territory government.
Acknowledgement of Country
ANROWS acknowledges the Traditional Owners of the land across Australia on which we live and work. We pay our respects to Aboriginal and Torres Strait Islander Elders past, present and emerging. We value Aboriginal and Torres Strait Islander histories, cultures and knowledge. We are committed to standing and working with First Nations Peoples, honouring the truths set out in the Warawarni-gu Guma Statement.
Peer review process
The quality of ANROWS publications is ensured through a rigorous peer review process that is consistent with the principles of the Committee on Publication Ethics (COPE) Ethical Guidelines for Peer Review. This report has been assessed by at least two peer reviewers with relevant academic expertise.
© ANROWS 2022

With the exception of the ANROWS branding, content provided by third parties, and any material protected by a trademark, all material presented in this publication is licensed under a Creative Commons Attribution-NonCommercial 3.0 Australia (CC BY-NC 3.0 AU) licence.
The full licence terms are available at creativecommons.org/licenses/by-nc/3.0/au/legalcode
Published by
Australia’s National Research Organisation for Women’s Safety Limited (ANROWS)
PO Box Q389, Queen Victoria Building, NSW 1230 | www.anrows.org.au | Phone +61 2 8374 4000
ABN 67 162 349 171
ISBN:978-1-922645-48-7 (paperback)
ISBN: 978-1-922645-49-4 (PDF)
Please note that there is the potential for minor revisions of this report.
Please check the online version at www.anrows.org.au for any amendment.

This report addresses work covered in the ANROWS research project RP.20.06 “Connecting the dots: Understanding the DFV experiences of children and young people with disability within and across sectors”. Please consult the ANROWS website for more information on this project.
ANROWS research contributes to the six National Outcomes of the National Plan to Reduce Violence against Women and their Children 2010–2022. This research addresses National Outcome 4 – Services meet the needs of women and their children experiencing violence.
Suggested citation:
Octoman, O., Hawkes, M., Lima, F., O’Donnell, M., Orr, C., Arney, F., Moore, T., Robinson, S., valentine, k., Marshall, A., Burton, J., & Brebner, C. (2022). The nature and extent of domestic and family violence exposure for children and young people with disability (Research report, 16/2022). ANROWS.

Australian Centre for Child Protection
University of South Australia
GPO Box 2471
Adelaide SA 5001

Flinders University
Sturt Road
Bedford Park SA 5042

UNSW Sydney
High Street
Kensington NSW 2052
Author acknowledgement
The authors would like to thank the Linkage, Data Outputs and Research Data Services teams at the Western Australian Data Linkage Branch, in particular the data custodians of the Midwives Notification System, Hospital Morbidity Data System, Mental Health Information System, Western Australian Registry of Births, Deaths and Marriages, IDEA Database, Western Australia Register of Developmental Anomalies, Department of Communities – Child Protection and Family Support, and the Western Australia Police Force. We would also like to thank the people of Western Australia for the use of their de-identified administrative data. This paper does not necessarily reflect the views of the government departments involved in this research and any errors of omission or commission are the responsibility of the researchers.
We also would like to acknowledge and thank the Western Australian Aboriginal Health Ethics Committee.
The research team would also like to acknowledge the support of the data custodian for Phase 1B: the Department for Child Protection, South Australia.
Acknowledgement of lived experiences of violence
ANROWS acknowledges the lives and experiences of the women and children affected by domestic, family and sexual violence who are represented in this report. We recognise the individual stories of courage, hope and resilience that form the basis of ANROWS research.
ANROWS acknowledges that children and young people living in homes where domestic and family violence (DFV) is present are not simply “exposed” to DFV – they are experiencing it. There are no circumstances in which children and young people are exposed to DFV and are not also being impacted by this violence. Therefore, ANROWS will always default to using “experienced DFV” instead of “were exposed to DFV” or “witnessed DFV”. This language aligns with the National Plan to End Violence Against Women and Children (due for finalisation in 2022), which recognises that children experience DFV as victims in their own right, and also seeks to honour the voices of victims and survivors who have felt minimised, erased or unacknowledged as childhood survivors.
Please note that in this report, the authors have chosen to use the term “exposed to DFV”.
Caution: Some people may find parts of this content confronting or distressing. Recommended support services include 1800RESPECT (1800 737 732), Lifeline (13 11 14) and, for Aboriginal and Torres Strait Islander people, 13YARN (13 92 76).
Acronyms
Acronym
Definition
ABS
Australian Bureau of Statistics
ADHD
Attention deficit hyperactivity disorder
AIHW
Australian Institute of Health and Welfare
ASD
Autism spectrum disorder
CPFS
Department of Communities – Child Protection and Family Support
CWD
Children with disability
DFV
Domestic and family violence
HMDS
Hospital Morbidity Data System
ICD
International Classification of Diseases
IDEA
Intellectual Disability Exploring Answers
MHIS
Mental Health Information System
MNS
Midwives Notification System
NDIS
National Disability Insurance Scheme
WAPIMS
Western Australia Police Information Management System
WARDA
Western Australian Register of Developmental Anomalies
Executive summary
Background
Children (term used to be inclusive of young people) with disability are known to experience violence at rates significantly higher than their peers without disability (Jones et al., 2012; Maclean et al., 2017). However, little is known about either the prevalence and risk of harm for children with disability exposed to domestic and family violence (DFV) or about how to use this information to build more child-centred and responsive practice and policy (Hernon et al., 2015; Corr & Milagros Santos, 2017).
Children with disability enter multiple systems at times of DFV crisis. Unless these children enter through disability services, the services are unlikely to have disability front of mind due to a historical legacy of segregation, where children with disability were regarded as requiring “special provision” by specialist disability institutions and services (Fawcett, 2016). System-level responses to children with disability are typically delivered through the dominant paradigm operating in the system through which these children enter (e.g. DFV, disability, child protection, criminal justice, health, housing, youth crisis services, education; Flynn, 2020).
Previous research has found that disability services are regularly and notably absent from cross-sector collaborative responses to DFV (McDonald & Rosier, 2011), and a lack of understanding, resources, awareness of or education about people with disability has led to a lack of “disability literacy” among mainstream services (Fraser-Barbour et al., 2018). Alongside this, disability services lack expertise around violence. This presents challenges for both data capture and developing more effective responses to improve access and to support disability- and violence-informed practice.
Aim and objectives
The project that this report relates to, “Connecting the dots”, aimed to scope and map current data capture of children with disability exposed to DFV; identify gaps and limitations; map new intersections unique to this population; and bring this knowledge into dialogue with the priorities of children, families and practitioners in order to improve policy and practice. The project comprised three phases, and this report focuses on the first phase of our project, with a final report covering the second and third phases (Robinson et al., 2022). The three phases involved the following:
- analysing administrative datasets to identify the prevalence of exposure to DFV for children with disability and how administrative data can be used to determine the nature of DFV exposure for children with disability. This phase was split into two sections: Phase 1A, a quantitative analysis of population-level, state-linked datasets; and Phase 1B, a qualitative analysis of a random sample of families reported to child protection
- holding interviews with young people with disability, family members and service providers about their ideas, experiences and priorities for improving supports when children and young people with disability experience DFV
- bringing key stakeholders together to find out how policies and systems can be more responsive to young people’s priorities.
Phase 1A of the project utilised population-level, state-linked administrative data from Western Australia to examine the extent of children with disability’s exposure to DFV.
Phase 1B utilised child protection administrative data and case file information from South Australia to examine the nature and exposure to DFV for children with disability. The work in Phase 1B complemented the work of Phase 1A by providing nuance to the nature of violence that children with disability are exposed to and the circumstances surrounding the violence. Together, Phase 1A and 1B utilised systems data to capture the extent of exposure children with disability have to DFV across two Australian jurisdictions.
Methods
Phase 1A: Population-level, state-linked data
In Phase 1A of the project, data from a population-level cohort of children born in Western Australia from 1990 to 2009 was utilised to identify the disability status of the children. Phase 1A comprised two sections: a population-based linked administrative data study of all children born alive in Western Australia between 1990 and 2009, with children followed from birth until 2013 (birth cohort), to determine if they had a mother hospitalised for assault and/or if they were involved in child protection; and a linked population-based study using data of children born alive between 1987 and 2010, whose mother was identified by the Western Australia Police Information Management System (WAPIMS) as a victim of DFV between 2004 and 2008 (DFV cohort). Given the availability of the data, both data sources were utilised to attain the prevalence of children exposed to DFV. Child protection notifications and substantiation data can include both exposure to DFVand maltreatment but are limited in differentiating between them.
To determine children’s disability status, four sources of data were used: the Hospital Morbidity Data System (HMDS); the Mental Health Information System (MHIS); the Western Australian Register of Developmental Anomalies (WARDA); and the Intellectual Disability Exploring Answers (IDEA) database (Petterson et al., 2005). Mothers’ histories of hospital discharges for assault-related injuries were ascertained through the International Classification of Diseases (ICD) codes. Data from the Department of Communities – Child Protection and Family Support (CPFS) provided information on children’s histories of child protection involvement in Western Australia. Socio-economic status was determined by the Index of Relative Social Disadvantage 2006 (Australian Bureau of Statistics, 2008b). Five levels of disadvantage were assigned to census collection districts.
Phase 1B: Case file analysis
Phase 1B of the project used a case file analysis framework (Witte, 2020) to examine a random sample of children reported to child protection from a metropolitan region within the South Australian child protection jurisdiction over six months in 2016. A report is a concern reported to the statutory child protection department by any type of notifier alleging child abuse or neglect. This is the primary entry point for children into the child protection system and the intake report outlines the concerns regarding the child.
Following coding and agreement, a quantitative analysis of the extent of children with disability exposed to DFV was conducted on the case reports. Information about the type of disability recorded for each child and family as well as the number of children with disability in the family were recorded and analysed. Themes relating to DFV and disability were categorised to represent those identified from the data. These themes are presented and contain deidentified illustrative or cumulative case studies using case study methodology designed to anonymise the data while presenting as true a picture as possible.
Results/findings
Phase 1A: Linked data
There were 524,534 children identified in the birth cohort. Through the utilisation of linked data, the study found that 16 per cent (n=83,768) of these children were identified as having disability. A higher proportion of the Aboriginal and Torres Strait Islander children in the birth cohort identified as having disability at 22 per cent, compared to non-Aboriginal and Torres Strait Islander children at 15 per cent. There were also sex differences, with males having a higher prevalence of disability (18%) than females (13%).
Hospital DFV data
The study determined there were 22,368 children in the birth cohort who had a mother hospitalised for assault in Western Australia. between March 1989 and June 2013. Overall, this results in a population prevalence of 4 per cent, with children with disability exposed at double the prevalence at 8 per cent. Of children whose mothers were hospitalised for assault, 29 per cent were children with disability. There was variation across disability groups in children whose mothers were hospitalised for assault. Overall, Aboriginal and Torres Strait Islander children were more likely than non-Aboriginal and Torres Strait Islander children to have a mother hospitalised for assault (26% compared to 3%), which was higher again for Aboriginal and Torres Strait Islander children with disability (36%). Children living in socio-economically disadvantaged areas were more likely to have mothers hospitalised for assault. Sixty-one per cent of children whose mothers werehospitalised for DFV were born in the most socio-economically disadvantaged areas (1st and 2nd quintiles). This proportion was slightly higher for children with disability exposed to maternal assault hospitalisation, at 63 per cent. Finally, children of mothers hospitalised for assault were more likely to be from outer regional or remote areas (34%) compared to the overall population (17%) and this was slightly higher among children with disability (36%).
Children with disability in the birth cohort were more likely to be reported to child protection than those without disability, which is consistent with previous research (Jones et al., 2012; Maclean et al., 2017). Within the group with disability, proportions of child protection involvement were more than double the population levels:
- The proportion of children with disability who had at least one maltreatment allegation was 11 per cent (compared to 5.5% for the population).
- Five and a half per cent had at least one substantiated maltreatment allegation (compared to 2.4% for the population).
- Four per cent were placed in out-of-home care at least once (compared to 1.7% for the population).
The proportion of children with disability who were involved with a maltreatment allegation was 32 per cent; those with a substantiated maltreatment allegation numbered 36 per cent; and, similarly, out-of-home care placement was found in 36 per cent. Children with disability who were Aboriginal and Torres Strait Islander and/or from the most socio-economically disadvantaged areas were again over-represented in child protection involvement.
Police DFV data
There were 15,423 children identified in the DFV cohort – that is, children with a mother who was identified in the police data as having a male perpetrator charged for a violent offence against them and where a domestic relationship flag was present. Of these children, 30 per cent were children with disability. This is similar to the birth cohort, in which 29 per cent of the children whose mother was hospitalised for assault were children with disability.
There were also high levels of child protection involvement for those children whose mother was identified in the police data, with:
- 59 per cent of these children also having a child maltreatment allegation, which was higher for children with disability (66%)
- 30 per cent of these children having a substantiated allegation, which was higher for children with disability (36%)
- 17 per cent of these children having an out-of-home-care placement, which was higher for children with disability (22%).
Phase 1B: Case file analysis
Phase 1B analysed a sample of child protection intake reports relating to 280 families reported to child protection in South Australia between July and December 2016, representing approximately 1,063 children. Of these families, 62 (22%) were identified as including a child with disability who had a report to child protection (referred to as an “index child” in this report). This study found that 45 (73%) of these 62 family groups had exposure to DFV.
For each of the 62 families with an index child with disability, information about disability and DFV was coded from narrative details contained in the child protection intake reports, using the definition of the categories of disability defined by Phase 1A. These details were limited by the data on disability recorded in the intake reports. Of the 62 families with an index child with disability, developmental delay and autism spectrum disorder (ASD) were the most commonly identified disabilities.
DFV recorded for these families varied. For many families, the DFV was chronic. For some families, information about any links between DFV and disability was not visible in the intake reports. However, 21 (47%) of the 45 family groups experiencing DFV and including a child with disability were identified as containing one or more of the following themes relating to DFV and disability.
Theme 1: Children with disability experienced trauma as a result of DFV
For 17 families, reports contained some information about children with disability showing signs of trauma, describing them as being scared, distressed, anxious or having behaviour problems in response to the DFV that they had been exposed to.
Theme 2: The perpetrator of the DFV directed violence towards the children with disability
For seven of the family groups, the perpetrator of the DFV also perpetrated violence (physical abuse) toward the child with disability. In some of the family groups, these children against whom violence had been used were also reported to use violence themselves.
Theme 3: Violence negatively impacted service access for children with disability
Three family groups in this study experienced an impact on access to services because of the DFV in their families.
Theme 4: Intervention order breaches occurred
In two family groups, the reports contained details of breaches of no-contact intervention orders where the children with disability had contact with a parent/caregiver who was the defendant.
Theme 5: Disability of children presented added complexity to escaping DFV
For two family groups in this study, the disability of the children presented an added complexity to escaping DFV.
Conclusions
The first phase of this project was undertaken to examine the nature and extent of DFV exposure for children with disability. Utilising linked population-level data has enabled us to ascertain the prevalence of children with disability exposed to DFV. Our results show that children with disability have double the exposure to a mother hospitalised for assault compared to the general population. Children with disability are also far more likely than the general population to have child protection involvement and entry into out-of-home care. Concerningly, children with disability make up approximately 30 per cent of those children exposed to DFV as identified through the police and hospitalisation data. Children with disability also make up 32 per cent of children involved in child protection and 36 per cent of those who enter out-of-home care.
This project has also been able to describe what is known about the nature and extent of the exposure to DFV for children with disability reported to child protection. Through analysis of a sample of intake reports on 280 families, this study found that 62 families were identified as including an index child with disability. Forty-five of the 62 family groups had exposure to DFV. Overall, this study paints a picture of highly complex contexts of abuse and neglect, of which DFV is one feature. It also shows the complex needs of children with disability and their families and the obstacles in obtaining services and supports.
Recommendations/implications for policy and practice
This phase of the project provides evidence of the need to better identify the prevalence of DFV and disability in routine data collection, and specifies opportunities to make better use of administrative data to identify especially vulnerable groups/families in the population.
Given the over-representation of children with disability exposed to DFV, these findings show the substantial support and resources required for children with disability and their families in services and systems. Our results also highlight the over-representation of Aboriginal and Torres Strait Islander children with disability and the increased proportion of children with disability in regional and remote areas who are exposed to DFV. This provides evidence for the crucial need for service provision that is culturally appropriate for Aboriginal and Torres Strait Islander families and highlights that regional and remote areas need to have adequate access to services that meet their needs.
There is a need to consider in policy and practice how to better support children with disability and their parents/caregivers. Access to services and supports to ensure children with disability feel safe and supported is vital. Support for parents and caregivers of children with disability is also an important consideration. They need access to resources, services and support to enable appropriate and safe housing for their families, as well as mental health support to meet their families’ needs. Other implications for policy and practice found from this phase of the study are as follows:
- DFV is often one factor within a complex context of child abuse and neglect. This complexity presents a compounding picture of risk for children with disability. A disability, child protection and DFV service response that is both preventative and responsive to the multiple factors that families might live with and encounter is needed.
- It is important that exclusion or ineligibility from a service does not prevent families from receiving the support that they need. For example, if a disability service cannot work with a child until safety concerns are addressed, then alternative sources of this support are needed. Families with multiple support needs often require specialised support and time to build trust with staff, especially if child protection agencies are involved or families fear their involvement.
- The significance of first response services such as hospitals and police was evident. Ensuring these practitioners are well-skilled in meeting the needs of families and children with disability is essential, particularly given the high proportion of children with disability in families experiencing violence that use these services.
- The provision of suitable alternative accommodation for women with children with disability who are experiencing DFV is needed, as is ensuring improved knowledge and skills in addressing housing requirements for people with disability. There should be provision of appropriate services and support to ensure children can remain in the home when it is safe to do so.
- Workforce development is also important. Training and resources are needed across sectors to improve support for, and knowledge of, the additional needs of children with disability and their families. Consideration needs to be given to supports for children to address development and wellbeing, as well as parents who may require support to attend mental health and/or substance use services.
- Supports and responses for families with children with disability require flexibility in delivery to address ongoing needs, particularly in families with complex and chronic challenges, as well as the delivery of supports to respond to critical incidents. This requires addressing structural barriers to ensure comprehensive training, policies and referral protocols for DFV with knowledge of intervention, support or referral pathways that are tailored to individual circumstances and needs (Hudspeth et al., 2022). Moreover, therapeutic supports should be offered that are accessible, affordable and responsive to the experiences of children with disability who are exposed to DFV.
- Our finding that a substantial proportion of children with disability exposed to DFV have psychological and developmental support needs is important. Crisis and counselling support services need to be equipped to respond to the needs of children with disability in these families, and resourced to support them effectively.
- Almost two in three children with a mother hospitalised for assault were born in the most socio-economically disadvantaged areas (1st and 2nd quintiles) and outer regional or remote areas. This has implications for regional and remote resource needs and service provision to address DFV, particularly for families who have additional needs in relation to supporting children with disability.
Directions for future research
This study has provided a deeper insight into the exposure to DFV for children with disability. It lays the groundwork for the future research that is required into service provision and access for children with disability and the design of preventative and responsive services and supports. Importantly, children with disability and their families and Aboriginal and Torres Strait Islander families and communities need to have a voice in how these services can be tailored to meet their needs and greater research and prevention efforts need to be dedicated to reducing the risk of DFV exposure.
Introduction
Domestic and family violence (DFV) has been identified as a priority for the Australian Government since the development of the National Plan to Reduce Violence against Women and their Children 2010–2022 (Council of Australian Governments [COAG], 2011). Much of this work has been viewed through the lens of the impact of DFV on adults. Statistics indicate that one in six women have experienced violence by a partner, with women aged 25 to 34 years and 35 to 44 years being the highest proportion of those who have experienced partner violence in the last two years (Australian Bureau of Statistics [ABS], 2020). This coincides with the age group of women who are most likely to be pregnant and/or have young children in their care. For those women who experienced partner violence and had children in their care, 68 per cent reported that their children had seen or heard the violence (Australian Institute of Health andWelfare [AIHW], 2020a); however, this self-reported indicator could potentially underestimate the extent of children’s exposure to DFV.
DFV can be defined in many ways. This study uses the definition outlined in the National Plan: “acts of violence that occur between people who have, or have had, an intimate relationship” (COAG, 2011, p. 2). While there is no single definition, the central element of DFV is an ongoing pattern of behaviour aimed at controlling a partner through fear – for example, by using behaviour which is violent and threatening. In most cases, violent behaviour is part of a range of tactics used to exercise power and control over women and their children, and can be both criminal and non-criminal. Domestic violence includes physical, sexual, financial, emotional and psychological abuse (COAG, 2011, p. 2). Our study also uses the DFV definition of the AIHW (2020a), which includes children’s exposure to violence within their family, including abuse and maltreatment perpetrated by a family member. In this study, child protection data is captured under this definition.
Exposure to DFV is multidimensional and goes beyond a child observing or hearing violence (Holden, 2003). A child (term inclusive of young people) being exposed to DFV incorporates a range of experiences, including experiencing, witnessing or hearing violence first-hand; living with the aftermath of DFV, including witnessing injuries; being displaced from homes; having prenatal exposure to DFV; intervening in DFV (e.g. asking a parent to stop or defending a parent); and hearing about the DFV after it has occurred (Holden, 2003).
Over time, there has been increasing recognition that some groups are disproportionately impacted by DFV. The Fourth Action Plan of the National Plan to Reduce Violence against Women and their Children (hereafter, the Fourth Action Plan; Commonwealth of Australia, 2019) focuses on primary prevention and priority groups experiencing disproportionate levels of DFV, including Aboriginal and Torres Strait Islander women, and women and their children with diverse lived experiences, including disability. A principle of the Fourth Action Plan recognises the importance of child-focused responses, but there is little attention to children in the plan other than as the children of women who experience violence. The National Plan for Protecting Australia’s Children 2021-2031 (Commonwealth of Australia, Department of Social Services, 2021) has recently been released, and includeschildren with disability as a priority group, recognising the increased risk of harm they face. This is particularly important for children with disability, who are known to experience violence at rates significantly higher than their peers without disability (Jones et al., 2012; Maclean et al., 2017). In 2019, the Royal Commission into Violence, Abuse, Neglect and Exploitation of People with Disability was established. The Royal Commission and the Fourth Action Plan have both discussed the need for data to improve our understanding of the extent of DFV exposure and to monitor prevalence over time. The Disability Royal Commission has also highlighted that there is no nationally consistent data on violence and neglect experienced by people with disability including important groups such as children with disability and First Nations children with disability (Commonwealth of Australia, 2020). Little is known about either the prevalence and risk of harm for children withdisability exposed to DFV or how to use this information to build more child-centred and responsive practice and policy (Corr & Milagros Santos, 2017; Hernon et al., 2015).
The Fourth Action Plan also recognises the importance of Aboriginal and Torres Strait Islander women and children who are identified as a priority group (Commonwealth of Australia, 2019). The impacts of colonisation, dispossession and intergenerational trauma are recognised as important factors in the increased risk of violence. Australia’s “Closing the Gap” target to reduce all forms of family violence and abuse against Aboriginal and Torres Strait Island women and children will hopefully support culturally driven strategies (Commonwealth of Australia, Department of Prime Minister and Cabinet, 2021a). Determining the prevalence of Aboriginal and Torres Strait Islander children with disability who are exposed to DFV is needed evidence to inform Closing the Gap strategies and ensure the diversity of children is recognised.
Children with disability enter multiple systems at times of DFV crisis. These systems might be DFV, disability, child protection, criminal justice, health, housing, youth crisis or education-focused in their remit. Aside from disability services, these services are unlikely to have disability front of mind, due to a historical legacy of segregation where children with disability were regarded as requiring “special provision” by specialist disability institutions and services (Fawcett, 2016). Though there have been significant investments and supports for referrals put in place recently (Department for Child Protection [South Australia], 2020; Department of Families, Fairness and Housing, 2020), system-level responses to children with disability are filtered through the dominant paradigm operating in the system through which they enter (Flynn, 2020).
Previous research has found that disability services are regularly and notably absent from cross-sector collaborative responses to DFV (McDonald & Rosier, 2011), and a lack of understanding, resources, awareness of or education about people with disability has led to a lack of “disability literacy” among mainstream services (Fraser-Barbour et al., 2018). Alongside this, disability services lack expertise around violence. This presents challenges for both data capture and developing more effective responses that can improve access and support disability- and violence-informed practice.
It is in this context that this study aims to scope and map current data capture of children with disability to determine prevalence of their exposure to DFV and the nature of the violence, to identify gaps and limitations, and to map new intersections unique to this population.
Structure of this report
This report presents findings from the first phase of the study, which aimed to identify how common exposure to DFV is for children with disability, and included the use of linked datasets to improve how we can identify children with disability in the data. Article 1 of the United Nations Convention on the Rights of the Child (1989) defines a child as a person who is under 18 years of age. Consistent with this definition, this report uses “child” to refer to both children and young people under 18 years of age. Two analyses are outlined in this report: Phase 1A, a quantitative analysis of population-level administrative linked datasets in Western Australia, and Phase 1B, a mixed-method analysis of a random sample of families reported to child protection in South Australia.
Phase 1A: Linked data analysis of DFV
Phase 1A of the project examines the prevalence of DFV exposure for children with disability by utilising population-level linked data from Western Australia.
Phase 1B: Case file analysis
Phase 1B utilises child protection administrative data and case file information to examine the nature of DFV that children with disability are exposed to, as reported to child protection.
While current national and state datasets indicate that children with disability who have experienced DFV are present in child protection, hospital, emergency department and police data, these datasets have not yet been connected to form a national picture of prevalence and risk or of opportunities to improve policy and practice across jurisdictions. It is also not possible through the unconnected data to form a complete picture of areas where limitations and gaps in the data exist. Through an assessment of a random sample of data generated relating to one South Australian metropolitan child protection jurisdiction, the study presented in Phase 1B provides an analysis that, in part, responds to these gaps.
Final report
The final report (Robinson et al., 2022) presents the findings of the second phase of the study – qualitative research with children with disability, family members and service providers about their ideas, experiences, and priorities for improving supports when families of children with disability experience DFV. Findings from the two phases of the project are brought together in the final report to inform the final phase of the research, which brings key stakeholders together to develop implications for how policies and systems can be more responsive to children’s priorities (Robinson et al., 2022).
The project is guided by families with disability, practitioners and policymakers, who have provided advice and feedback throughout on our approach and how to increase the impact of our findings.
Phase 1A:
Linked data – Methods
Defining disability
As a concept, disability is “complex, dynamic, multidimensional and contested” (WHO, 2011). There is no consensus on how disability is defined and it is up to each individual to determine how they view or identify their disability. However, there are models for conceptualising disability in children that inform the collection of data (Patel & Brown, 2017). Historically, the medical model, which is based on the diagnosis or condition that results in functional impairment, was utilised to define disability. The International Classification of Functioning aims to apply a broader social model that takes into account the social and environmental context of the disability, which may impact the functional ability of a person with a particular condition (Madden & Dimitropoulous, 2014).
In Australia we have a number of disability definitions as defined by legislation. The Disability Discrimination Act 1992 (Cth) defines disability as:
- total or partial loss of the person’s bodily or mental functions
- total or partial loss of a part of the body
- the presence in the body of organisms causing disease or illness
- the malfunction, malformation or disfigurement of a part of the person’s body
- a disorder or malfunction that results in the person learning differently from a person without the disorder or malfunction
- a disorder, illness or disease that affects a person’s thought processes, perception of reality, emotions or judgement or that results in disturbed behaviour.
However, Australia’s Commonwealth disability support program, the National Disability Insurance Scheme (NDIS,) has defined disability groups according to conditions that are likely to meet the disability requirements in s 24 of the NDIS Act 2013 (Cth) (National Disability Insurance Agency, 2021a), as well as permanent conditions for which functional capacity are variable (National Disability Insurance Agency, 2021b). The NDIS advises that further assessment may be required to determine whether an individual’s functional capacity meets the requirements of the access criteria.
The NDIS has a limited range of psychiatric conditions that may result in functional impairment which would be considered as a disability by other definitions, including those laid out in the Disability Discrimination Act 1992 (Cth).
Operationalising the definition of disability using administrative data
In keeping with the principles of inclusive research, we established a policy and practice advisory group and employed a co-researcher who was a young person with lived experience of disability at the outset of the project (Robinson et al., 2022). The advisory group was formed at the commencement of the project and met on a semi-regular basis, providing advice and input on the development and interpretation of data findings and their presentation. This group was also integral in providing guidance on operationalising disability in the context of the data.
The challenge for defining disabilities in the context of population-level administrative data is that the majority of health databases use the medical model to categorise disability utilising the International Classification of Diseases (ICD) codes. These databases do not readily capture the functional capacities of individuals or the role of socio-environmental factors that impact on a person with disability being able to participate in society (Iezzoni, 2002).
To construct disability categories for this research, we used the NDIS categories (outlined in Appendix A) and included additional categories of mental health disorders and chronic health conditions (cystic fibrosis, epilepsy, asthma, diabetes) that align with the Disability Discrimination Act 1992 (Cth). These additional categories were included following discussion with our advisory group and a review of the literature including AIHW’s reports on disability (2020a, 2020b). We determined that a high number of children would have coexisting conditions that include physical, neurological, sensory and psychiatric conditions and therefore it is important to capture both an understanding of the range of conditions in the dataset and the complexity of the cases. It was important to include chronic health conditions, as they could impact children’s health outcomes and functional capacity if unmanaged. The second tablein Appendix A lists the ICD’s codes for conditions, disorders and diagnoses.
To enable us to examine coexisting conditions across broad disability groups, we combined conditions into the following categories: physical conditions; intellectual and developmental conditions (as per the AIHW Meteor definition of intellectual/learning); mental health conditions; and chronic health conditions (see Table 1). The AIHW Meteor is Australia’s repository for national metadata standards for health, housing and community services. We have utilised their grouping of intellectual/learning conditions, which we have called “intellectual and developmental conditions”, encapsulating developmental delay, intellectual disability, specific learning disorders, attention deficit hyperactivity disorder (ADHD) and autism (AIHW, 2022).
Table 1: Broad disability groups
Category
Types of conditions
Physical conditions
Cerebral palsy
Other genetic conditions
Spinal cord or brain injury
Permanent blindness
Permanent bilateral deafness
Deaf blindness
Amputation or congenital absence of limbs
Additional groups – conditions resulting in physical impairment
Other birth defects (generic category)
Down syndrome
Intellectual and developmental conditions
Intellectual disability
Autism and developmental delay
ADHD
Pervasive and specific developmental disorders
Mental health conditions
Other diagnosed mental health disorders (except intellectual disability, autism and developmental delay, pervasive and specific developmental disorders)
Conduct disorder
Chronic health conditions
Cystic fibrosis
Epilepsy
Asthma
Diabetes
Data linkage
Western Australia has a long history of data linkage, which enables the research of complex issues across multiple datasets (Holman et al., 1999). The WA Data Linkage Branch within the WA Department of Health enables the linkage of data for the same person across multiple datasets using probabilistic matching. It also enables the genealogical linkage of mothers to their children (family connections) through the use of birth registrations and midwives’ notification data (Glasson et al., 2007).
In Phase 1A of the project, to determine children’s disability status, four sources of data were used:
- The Hospital Morbidity Data System (HMDS) contains information on all public and private hospital discharges, including up to 21 diagnostic codes using the ICD codes (ICD-9: 1990–June 1999; ICD-10: July 1999–2010).
This was available for all children in the cohort who had a hospitalisation between January 1990 and June 2013. - The Mental Health Information System (MHIS) contains information on all mental health-related public and private inpatient admissions and public outpatient contacts with ICD codes utilised for mental health diagnoses for all children in our cohort between January 1990 and June 2013.
- The WA Register of Developmental Anomalies (WARDA) contains information on structural or functional birth defects that are present before birth and diagnosed by age six. WARDA receives notifications of birth defects from the Midwives Notification System (MNS), the HMDS, and other services (e.g. genetic, pathology, and private practitioners). WARDA data was available for this study for all children in the cohort between 1990 and 2009.
- The Intellectual Disability Exploring Answers (IDEA) database (Petterson et al., 2015) provides Western Australian data on individuals with intellectual disability (ID) and/or autism, by using information provided by the Department of Communities for individuals of any age with ID who are provided with services, and by the Department of Education (individuals with ID receiving education support, predominantly aged 5 to 17 years). IDEA data was available for all children born between 1990 and 2010.
While children with disability are often grouped together in studies, there is great diversity in the conditions that children experience. Our study has therefore examined the extent of DFV exposure for children both within and across disability groups. Another important issue is that, given the disproportionate exposure of Aboriginal and Torres Strait Islander women and children to DFV (Commonwealth of Australia, 2019), it is imperative that this study also provides prevalence estimates of DFV exposure for Aboriginal and Torres Strait Islander children with disability to enable improved resourcing, planning and service provision. In this study we have provided separate sections for Aboriginal and Torres Strait Islander findings, but given the extent of analysis we have had to use some combined figures and tables with comparisons predominantly focused on comparisons of Aboriginal and Torres Strait Islander children with and without disability.While DFV can impact women from any socio-economic background and geographic area, rates of DFV are higher in low socio-economic areas and regional, rural and remote areas (AIHW, 2019; Campo & Tayton, 2015). The intersections of these factors are important to identify among children with disability who are already at higher risk of exposure. Our analysis provides prevalence estimates across these groups.
Study population
Two separate cohorts were selected in Phase 1A given the data availability: a birth cohort and a DFV cohort.
Birth cohort
The birth cohort was a population-level sample of children born from 1990 to 2009. This included all children born in Western Australia during this time period with identification of their disability status across multiple administrative datasets as described before. In the birth cohort analysis, children were identified from the Birth Registrations and the MNS, with the Mortality Database identifying children who had died during the follow-up period (up to 2013). The Birth Registrations and MNS data was used to identify children’s sex, month and year of birth, and Aboriginal and Torres Strait Islander status. In addition, neighbourhood-level socio-economic status was determined by the Socio-Economic Index of Area (SEIFA) 2006 (Index of Relative Social Disadvantage) from the ABS (2008b). Five levels of disadvantage were assigned to census collection districts (around 200 households), ranging from 1 (most disadvantaged) to 5 (least disadvantaged).Residential remoteness was determined in the MNS data by the Accessibility/Remoteness Index of Australia (ARIA) 2006 at collection district level (the second smallest geographical area in the Australian Standard Geographic Classification), with criteria ranging from major cities to very remote areas (ABS, 2018).
Children exposed to DFV were identified using two data sources: mother’s hospitalisation data, to determine children whose mothers were hospitalised for assault, and linked child protection data to identify children who were exposed to abuse and neglect. Mothers’ histories of hospital discharges for assault-related injuries were ascertained from the HMDS (1989 to 2013, year prior to birth and during follow-up period) through the ICD codes that have been utilised previously (Orr et al., 2021; Table 2). The Department of Communities – Child Protection and Family Support (CPFS) data (January 1990 to March 2013) was used to provide information on children’s history of maltreatment notifications from birth onward, including age of notification and type of maltreatment. Notifications consist of reports made to CPFS regarding alleged child abuse and neglect. A notification is substantiated by CPFS when, after investigation, there is reasonable cause tobelieve the child has been, is being or is likely to be abused, neglected or otherwise harmed. After a substantiated notification, children could be removed from their families and enter out-of-home care. Children involved in child protection are notified for maltreatment allegations due to concerns of physical, emotional and psychological abuse and neglect which can include exposure to family violence. Through including child protection data in this study, we can increase our understanding of the prevalence of DFV exposure among children with disability as well as the level of interaction they have with the child protection system.
Domestic and family violence cohort
In the second analysis (DFV cohort), the cohort included children born in Western Australia between 1987 and 2010. This cohort only included children whose mother was identified by the WA Police Information Management System (WAPIMS) as a victim of domestic and family violence between 2004 and 2008, where a male perpetrator was charged for the offence against the child’s mother and there was a domestic relationship flag. This cohort was utilised to investigate the prevalence of DFV identified through the WAPIMS, which was not available for the birth cohort. The DFV cohort data was obtained from a previous case-control study led by Dr Carol Orr that investigated outcomes for children exposed to DFV, with necessary ethics approvals (Orr et al., 2022). It should be noted that completeness of data was prioritised by using all available information on children identified by the WAPIMS, enabling a more comprehensive range of information for the analysis ofthis cohort. Additionally, given that WAPIMS data was only available for this cohort and not at population level (i.e. it was not available for the birth cohort), this dataset was used to acertain the number of children with disability born to mothers identified by the police as victims of DFV, as well as to investigate the overlap between police and hospitalisation data as two ways to identify DFV episodes using linked administrative datasets.
The identification of child disability status was the same as described before, using information across multiple administrative datasets. Children were identified as exposed to DFV from two sources: the WAPIMS and the HMDS (see Table 2). The WA Police-captured DFV included when a male perpetrator had been charged for the offence against the child’s mother. The criminal offences of interest were murder, attempted murder, physical assault, sexual assault, threatening behaviour, and misuse of weapons. The categories were derived using the Australian and New Zealand Standard Offence Classification subdivision level (ABS, 2011). The DFV-related hospital discharges were identified as in the previous data analysis in the HMDS data (1987–2016).
Table 2: Data sources and cohorts, Phase 1A
Phase 1A
Birth cohort
DFV cohort
Jurisdiction
WA
WA
Data source
Linked datasets
Linked datasets
Cohort
All children born in WA from 1990 to 2009
Children born in WA from 1987 to 2010 with a mother identified by police as a DFV victim between 2004 and 2008
Follow-up time
1990 to 2013
1987 to 2016
Disability data source
- Hospital Morbidity Data System (HMDS)
- Mental Health Information System (MHIS)
- WA Register of Developmental Anomalies
- Intellectual Disability Exploring Answers (IDEA) database
- Hospital Morbidity Data System (HMDS)
- Mental Health Information System (MHIS)
- WA Register of Developmental Anomalies
- Intellectual Disability Exploring Answers (IDEA) database
DFV data source
- HMDS (specific ICD codes) [a]
- Department of Communities – Child Protection and Family Support (CPFS) data
- WAPIMS
- HMDS (specific ICD codes) [a]
- Department of Communities – Child Protection and Family Support (CPFS) data
Note: a ICD codes as used in Orr et al. (2021).
Table 3: Data sources for exposure to DFV and child maltreatment, Phase 1A
Data source
Type of exposure
Police data
Mother identified as a victim of DFV in the WA Police Force Incident Management System, where a male perpetrator was charged for the offence and a domestic relationship flag was present. The criminal offences were murder, attempted murder, physical assault, sexual assault, threatening behaviour, and misuse of weapons. The categories were derived using the Australian and New Zealand Standard Offence Classification subdivision level (ABS Cat No. 1234.0)
Hospital morbidity data
DFV-related admission of mothers [a] identified through the International Classification of Diseases codes
Child maltreatment indicators
Data source
Type of exposure
Child protection data
Notifications of maltreatment, substantiated maltreatment notifications and periods of out-of-home care
Note: a ICD codes as used in used in Orr et al. (2021).
Ethics approval
Ethical approval was obtained from the WA Department of Health Human Research Ethics Committee, the WA Aboriginal Health Ethics Committee, and the University of Western Australia Human Research Ethics Committee. Departmental data custodians gave permission for this data to be utilised for analysis. The WA Aboriginal Health Ethics Committee gave feedback and approval for the publication of this report.
Phase 1A:
Linked data – Findings
Linked data analysis (birth cohort)
Children with disability
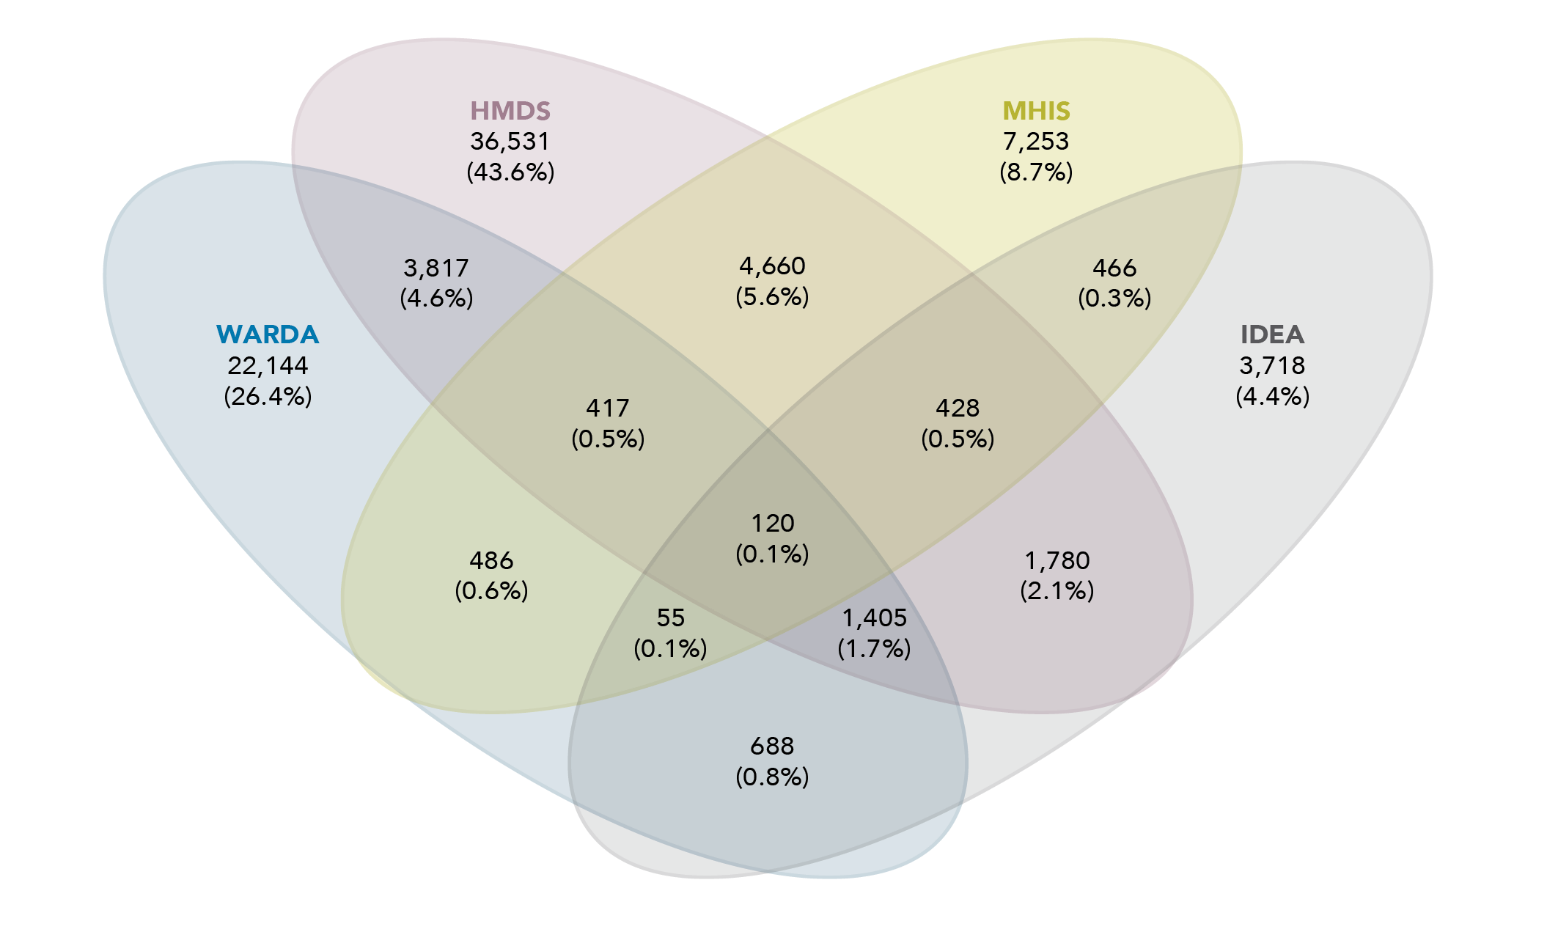
The first component of this research was determining the prevalence of children with disability, utilising population-level administrative data from Western Australia. Figure 1 shows the proportion of children identified as having a disability in each of the datasets used in this study. The interactions between groups represent the proportion of children who were identified in multiple datasets. The majority of children with disability were identified in a single dataset: 44 per cent were identified in the HMDS data only; 26 per cent in WARDA data only; 9 per cent in the MHDS data only; and 4 per cent in the IDEA data only. From those identified as having a disability in two or more datasets, the most prevalent interactions were for HMDS and MHIS (6% of children with disability), HMDS and IDEA (2%), and HMDS, IDEA and WARDA (2%). The use of multiple data sources to ascertain disability is important. While the HMDS and WARDA datasetscapture a large number of children with disability, datasets such as IDEA identify a smaller number of children but are important in ascertaining children with intellectual disability.
Figure 1: Dataset interactions for child disability identification
Data table for the figure above:
Dataset
Number of children and percentage
HMDS
36,531 (43.6%)
WARDA
22,144 (26.4%)
MHIS
7,253 (8.7%)
IDEA
3,718 (4.4%)
HMDS and WARDA
3,817 (4.6%)
HMDS and MHIS
4,660 (5.6%)
HMDS and IDEA
1,780 (2.1%)
WARDA and MHIS
486 (0.6%)
WARDA and IDEA
688 (0.8%)
MHIS and IDEA
466 (0.3%)
HMDS, WARDA and MHIS
417 (0.5%)
HMDS, MHIS and IDEA
428 (0.5%)
HMDS, WARDA and IDEA
1,405 (1.7%)
WARDA, MHIS and IDEA
55 (0.1%)
HMDS, WARDA, MHIS and IDEA
120 (0.1%)
There were 524,534 children identified in the birth cohort. This study found that 16 per cent (n=83,768) of these children were identified as having a disability (Table 4). It is difficult to compare this prevalence to other studies due to the differences in identification of disability; however, this is higher than the Australian prevalence found in the Survey of Disability, Ageing and Carers (SDAC), which collects information about people with disability, older people, and carers who assist people with disability (ABS, 2019a). In 2020, the SDAC estimated that 7.7 per cent of children aged 0 to 14 had some level of disability (AIHW, 2020a). Our disability categories were broader than the categories identified by the SDAC, with longer follow-up time, which may explain our larger prevalence. However, our prevalence was slightly less than the almost 19 per cent reported by the Nationally ConsistentCollection of Data on School Students with Disability, which identifies Australian students receiving a government-funded educational adjustment to address disability (Productivity Commission, 2019).
Aboriginal and Torres Strait Islander children in our birth cohort had a higher proportion identified as having a disability at 22 per cent, compared to non-Aboriginal and Torres Strait Islander children at 15 per cent. There were also sex differences, with males having a higher prevalence of disability (18%) than females (13%). Both the Aboriginal and Torres Strait Islander disparity and sex disparity in prevalence is consistent with the SDAC disparities (AIHW, 2020a). The disability groups found to have markedly higher prevalence for Aboriginal and Torres Strait Islander than non-Aboriginal and Torres Strait Islander children were diagnosed mental health disorders and asthma, which is consistent with previous research (AIHW, 2020b).
Of children identified in the data as having a disability (Table 4):
- Eleven per cent were Aboriginal and Torres Strait Islander children with disability, which is slightly higher than the proportion of Aboriginal and Torres Strait Islander children at a population level (8%).
- Children with disability were more likely to be socio-economically disadvantaged, with 46 per cent of children with disability living in the two most disadvantaged areas, compared to 41 per cent of children with no identified disability.
- There was a slightly higher proportion of children with disability living in outer regional and remote areas (19%) compared to those with no identified disability (16%).
Table 4: Demographic characteristics of children in cohort, overall and by disability status
Total
Number
Disability flag
No
N
Disability flag
No
%
Disability flag
Yes
N
Disability flag
Yes
%
N
440,766
84.03
83,768
15.97
Aboriginal and Torres Strait Islander status
Aboriginal and Torres Strait Islander status
Disability flag
No
N
Disability flag
No
%
Disability flag
Yes
N
Disability flag
Yes
%
Yes
31,001
7.03
8,955
10.70
No
409,688
92.97
74,762
89.30
Sex
Sex
Disability flag
No
N
Disability flag
No
%
Disability flag
Yes
N
Disability flag
Yes
%
Females
221,526
50.26
34,317
40.97
Males
219,223
49.74
49,444
59.03
Socio-Economic Index For Area
Socio-Economic Index For Area
Disability flag
No
N
Disability flag
No
%
Disability flag
Yes
N
Disability flag
Yes
%
1 (most disadvantaged)
92,992
21.18
20,508
24.58
2
88,500
20.16
17,659
21.17
3
91,440
20.82
16,926
20.29
4
78,499
17.88
13,540
16.23
5 (least disadvantaged)
87,662
19.96
14,800
17.74
Remoteness
Remoteness
Disability flag
No
N
Disability flag
No
%
Disability flag
Yes
N
Disability flag
Yes
%
Major cities
289,868
72.80
52,966
70.87
Inner regional
42,191
10.60
7,469
9.99
Outer regional
38,044
9.55
8,090
10.82
Remote
18,719
4.70
3,909
5.23
Very remote
9,360
2.35
2,302
3.08
Note: Aboriginal and Torres Strait Islander status, sex, SEIFA and remoteness subtotals do not sum to 100 per cent due to missing records.
Table 5 displays the number and percentage of children in the birth cohort identified as having disability broken down by disability type. Over the whole birth cohort, when analysing broader disability categories:
- 2 per cent of all children had an intellectual and/or developmental condition
- 4 per cent had a mental health condition
- 8 per cent had a physical condition
- 5 per cent had a chronic health condition (note that children might be identified as having multiple disability types; Figure 2).
For children with disability:
- more than half had a physical condition (52%)
- one third had a chronic health condition (33%)
- one quarter had a mental health condition (25%)
- 12 per cent had an intellectual and/or developmental condition.
Overall, the five most prevalent disability types were birth defects (6%), asthma (5%), diagnosed mental health disorders (4%), spinal cord or brain injury (2%) and intellectual disability (1%).
Table 5: Children with disability, type of disability, number and percentage, overall
Disability groups
Overall
N
Overall
%
Children with disability
83,768
15.97
Intellectual and developmental conditions
9,880
1.88
Intellectual disability
7,649
1.46
Autism and pervasive development disorders
2,555
0.49
ADHD
1,331
0.25
Mental health conditions
20,915
3.99
Conduct disorder
2,644
0.50
Diagnosed mental health disorders
19,835
3.78
Organic disorders
582
0.11
Substance-related disorders
4,759
0.91
Schizophrenia
4,604
0.88
Mood disorders
4,165
0.79
Anxiety
9,600
1.83
Personality disorders
1,002
0.19
Disorders of psychological development
5,406
1.03
Other mental health disorders
1,584
0.30
Physical conditions
43,264
8.25
Cerebral palsy
1,135
0.22
Other genetic conditions
523
0.10
Spinal cord or brain injury
9,231
1.76
Permanent blindness
245
0.05
Permanent bilateral hearing loss
1,512
0.29
Deaf blindness
1,706
0.33
Amputation or congenital absence of two limbs
275
0.05
Conditions resulting in physical impairment
4,282
0.82
Down syndrome
518
0.10
Birth defects [a]
29,861
5.69
Chronic health conditions
28,008
5.34
Cystic fibrosis
189
0.04
Epilepsy
2,562
0.49
Asthma
24,267
4.63
Diabetes
1,537
0.29
Note: a See breakdown of conditions included in birth defects in Appendix B.
Percentages do not add up to 100 given that children with coexisting conditions are included multiple times (i.e. once for each condition).
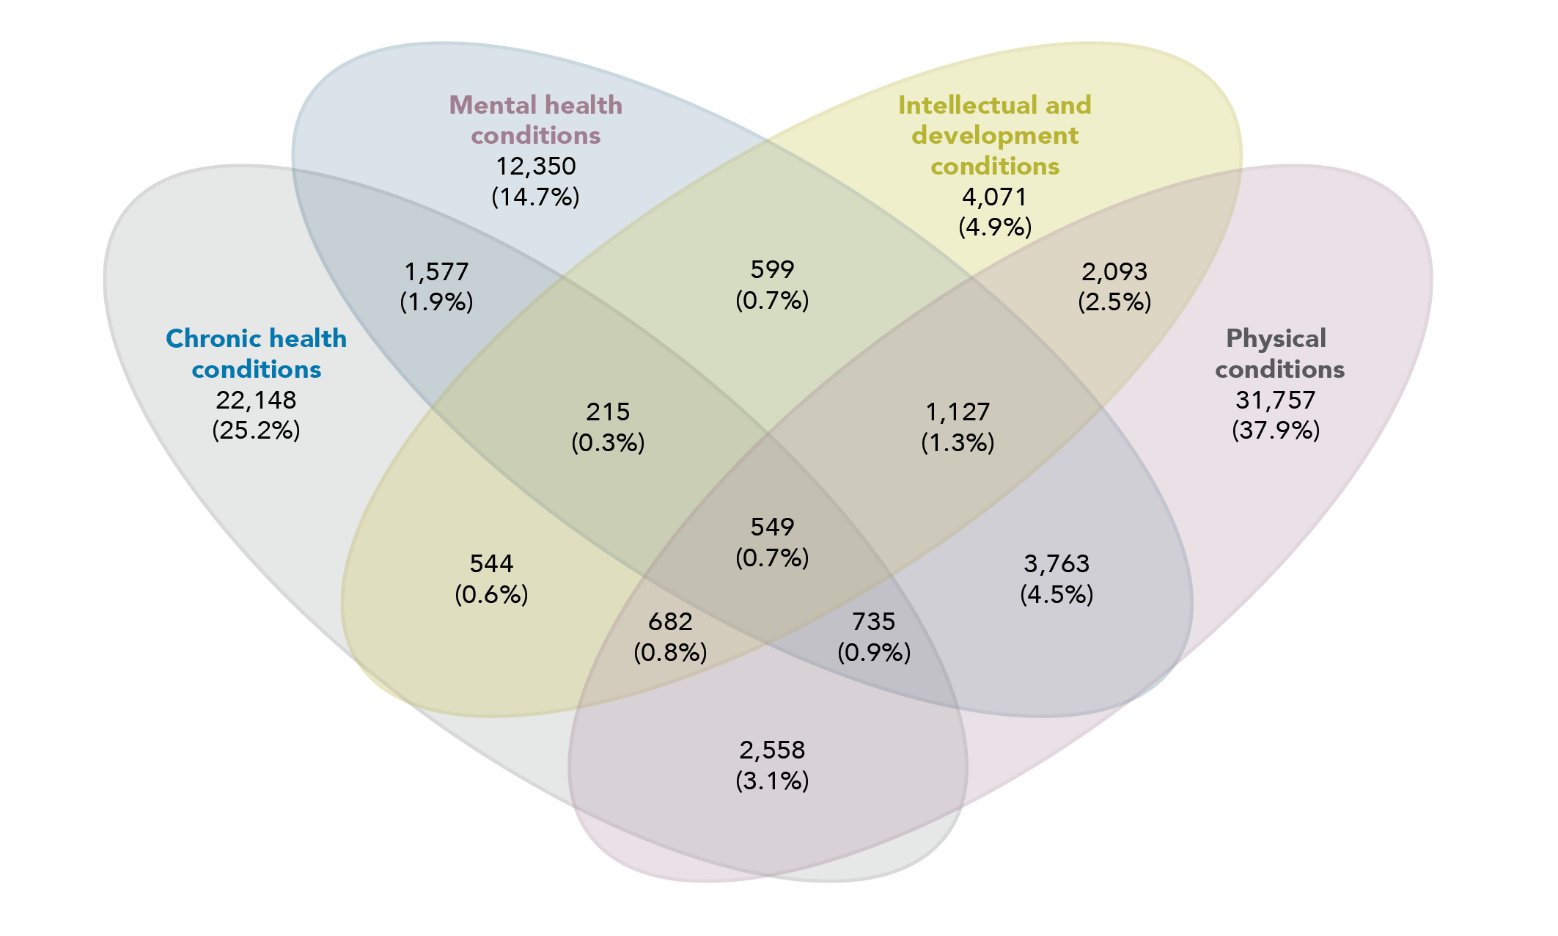
As mentioned before, some children in our birth cohort were identified as having more than one disability type. Figure 2 displays the broad disability groups and the coexisting conditions between these groups. Children with one condition represented 83 per cent of those with disability. Those having only physical disabilities represented 38 per cent of all children with disability, 25 per cent had only chronic health conditions, 15 per cent were found with only mental health conditions and 5 per cent had only intellectual and/or developmental conditions.
The most prevalent coexisting condition was found for those with mental health and physical conditions, at 4 per cent of children with disability, followed by chronic health and/or physical conditions (3%) and physical and intellectual and developmental conditions (2%). Only 549 (1%) children were identified as having all four broad groups of disability.
Figure 2: Broad disability groups and coexisting conditions
Data table for the figure above:
Dataset
Number of children and percentage
Chronic health conditions
22,148 (25.2%)
Mental health conditions
12,350 (14.7%)
Intellectual and development conditions
4,071 (4.9%)
Physical conditions
31,757 (37.9%)
Chronic health conditions and Mental health conditions
1,577 (1.9%)
Chronic health conditions and Intellectual development conditions
544 (0.6%)
Chronic health conditions and Physical conditions
2,558 (3.1%)
Mental health conditions and Intellectual and development conditions
599 (0.7%)
Mental health conditions and Physical conditions
3,763 (4.5%)
Intellectual and development conditions and Physical conditions
2,093 (2.5%)
Chronic health conditions, Mental health conditions and Intellectual and development conditions
215 (0.3%)
Chronic health conditions, Mental health conditions and Physical conditions
735 (0.9%)
Chronic health conditions, Intellectual and development conditions and Physical conditions
682 (0.8%)
Mental health conditions, Intellectual and development conditions and Physical conditions
1,127(1.3%)
Chronic health conditions, mental health conditions, Intellectual and development conditions and Physical conditions
549 (0.7%)
Note: Percentages are calculated over all children with disability.
Aboriginal and Torres Strait Islander children with disability
Of the 39,956 Aboriginal and Torres Strait Islander children born alive in Western Australia between 1990 and 2009, 22 per cent were identified as having a disability. This percentage was higher than the proportion identified for non-Aboriginal and Torres Strait Islander children at 15 per cent. Additionally, our analysis found that (Table 6):
- Aboriginal and Torres Strait Islander children with disability were more likely to be of high socio-economic disadvantage (72%) compared to those with no disability (69%).
- The proportion of Aboriginal and Torres Strait Islander children with disability living in outer regional and remote areas (52.5%) was slightly higher than the Aboriginal and Torres Strait Islander population with no disability (48.9%).
Table 6: Demographic characteristics of Aboriginal and Torres Strait Islander children, overall and by disability status
Total
Number
Disability flag for Aboriginal and Torres Strait Islander children
No
N
Disability flag for Aboriginal and Torres Strait Islander children
No
%
Disability flag for Aboriginal and Torres Strait Islander children
Yes
N
Disability flag for Aboriginal and Torres Strait Islander children
Yes
%
N
31,001
77.59
8,955
22.41
Sex
Sex
Disability flag for Aboriginal and Torres Strait Islander children
No
N
Disability flag for Aboriginal and Torres Strait Islander children
No
%
Disability flag for Aboriginal and Torres Strait Islander children
Yes
N
Disability flag for Aboriginal and Torres Strait Islander children
Yes
%
Female
15,806
50.99
3,826
42.72
Male
15,195
49.01
5,129
57.28
Socio-Economic Index For Area
Socio-Economic Index For Area
Disability flag for Aboriginal and Torres Strait Islander children
No
N
Disability flag for Aboriginal and Torres Strait Islander children
No
%
Disability flag for Aboriginal and Torres Strait Islander children
Yes
N
Disability flag for Aboriginal and Torres Strait Islander children
Yes
%
1 (high disadvantage)
15,330
49.72
4,717
52.88
2
6,043
19.60
1,709
19.16
3
4,831
15.67
1,275
14.29
4
3,396
11.01
874
9.80
5 (low disadvantage)
1,231
3.99
346
3.88
Remoteness ARIA 2006
Remoteness ARIA 2006
Disability flag for Aboriginal and Torres Strait Islander children
No
N
Disability flag for Aboriginal and Torres Strait Islander children
No
%
Disability flag for Aboriginal and Torres Strait Islander children
Yes
N
Disability flag for Aboriginal and Torres Strait Islander children
Yes
%
Major cities
11,082
42.79
2,933
40.47
Inner regional
2,149
8.30
512
7.06
Outer regional
4,318
16.67
1,252
17.28
Remote
4,169
16.10
1,212
16.72
Very remote
4,183
16.15
1,338
18.46
Note: SEIFA and remoteness count subtotals do not sum to 100 per cent of children due to missing records.
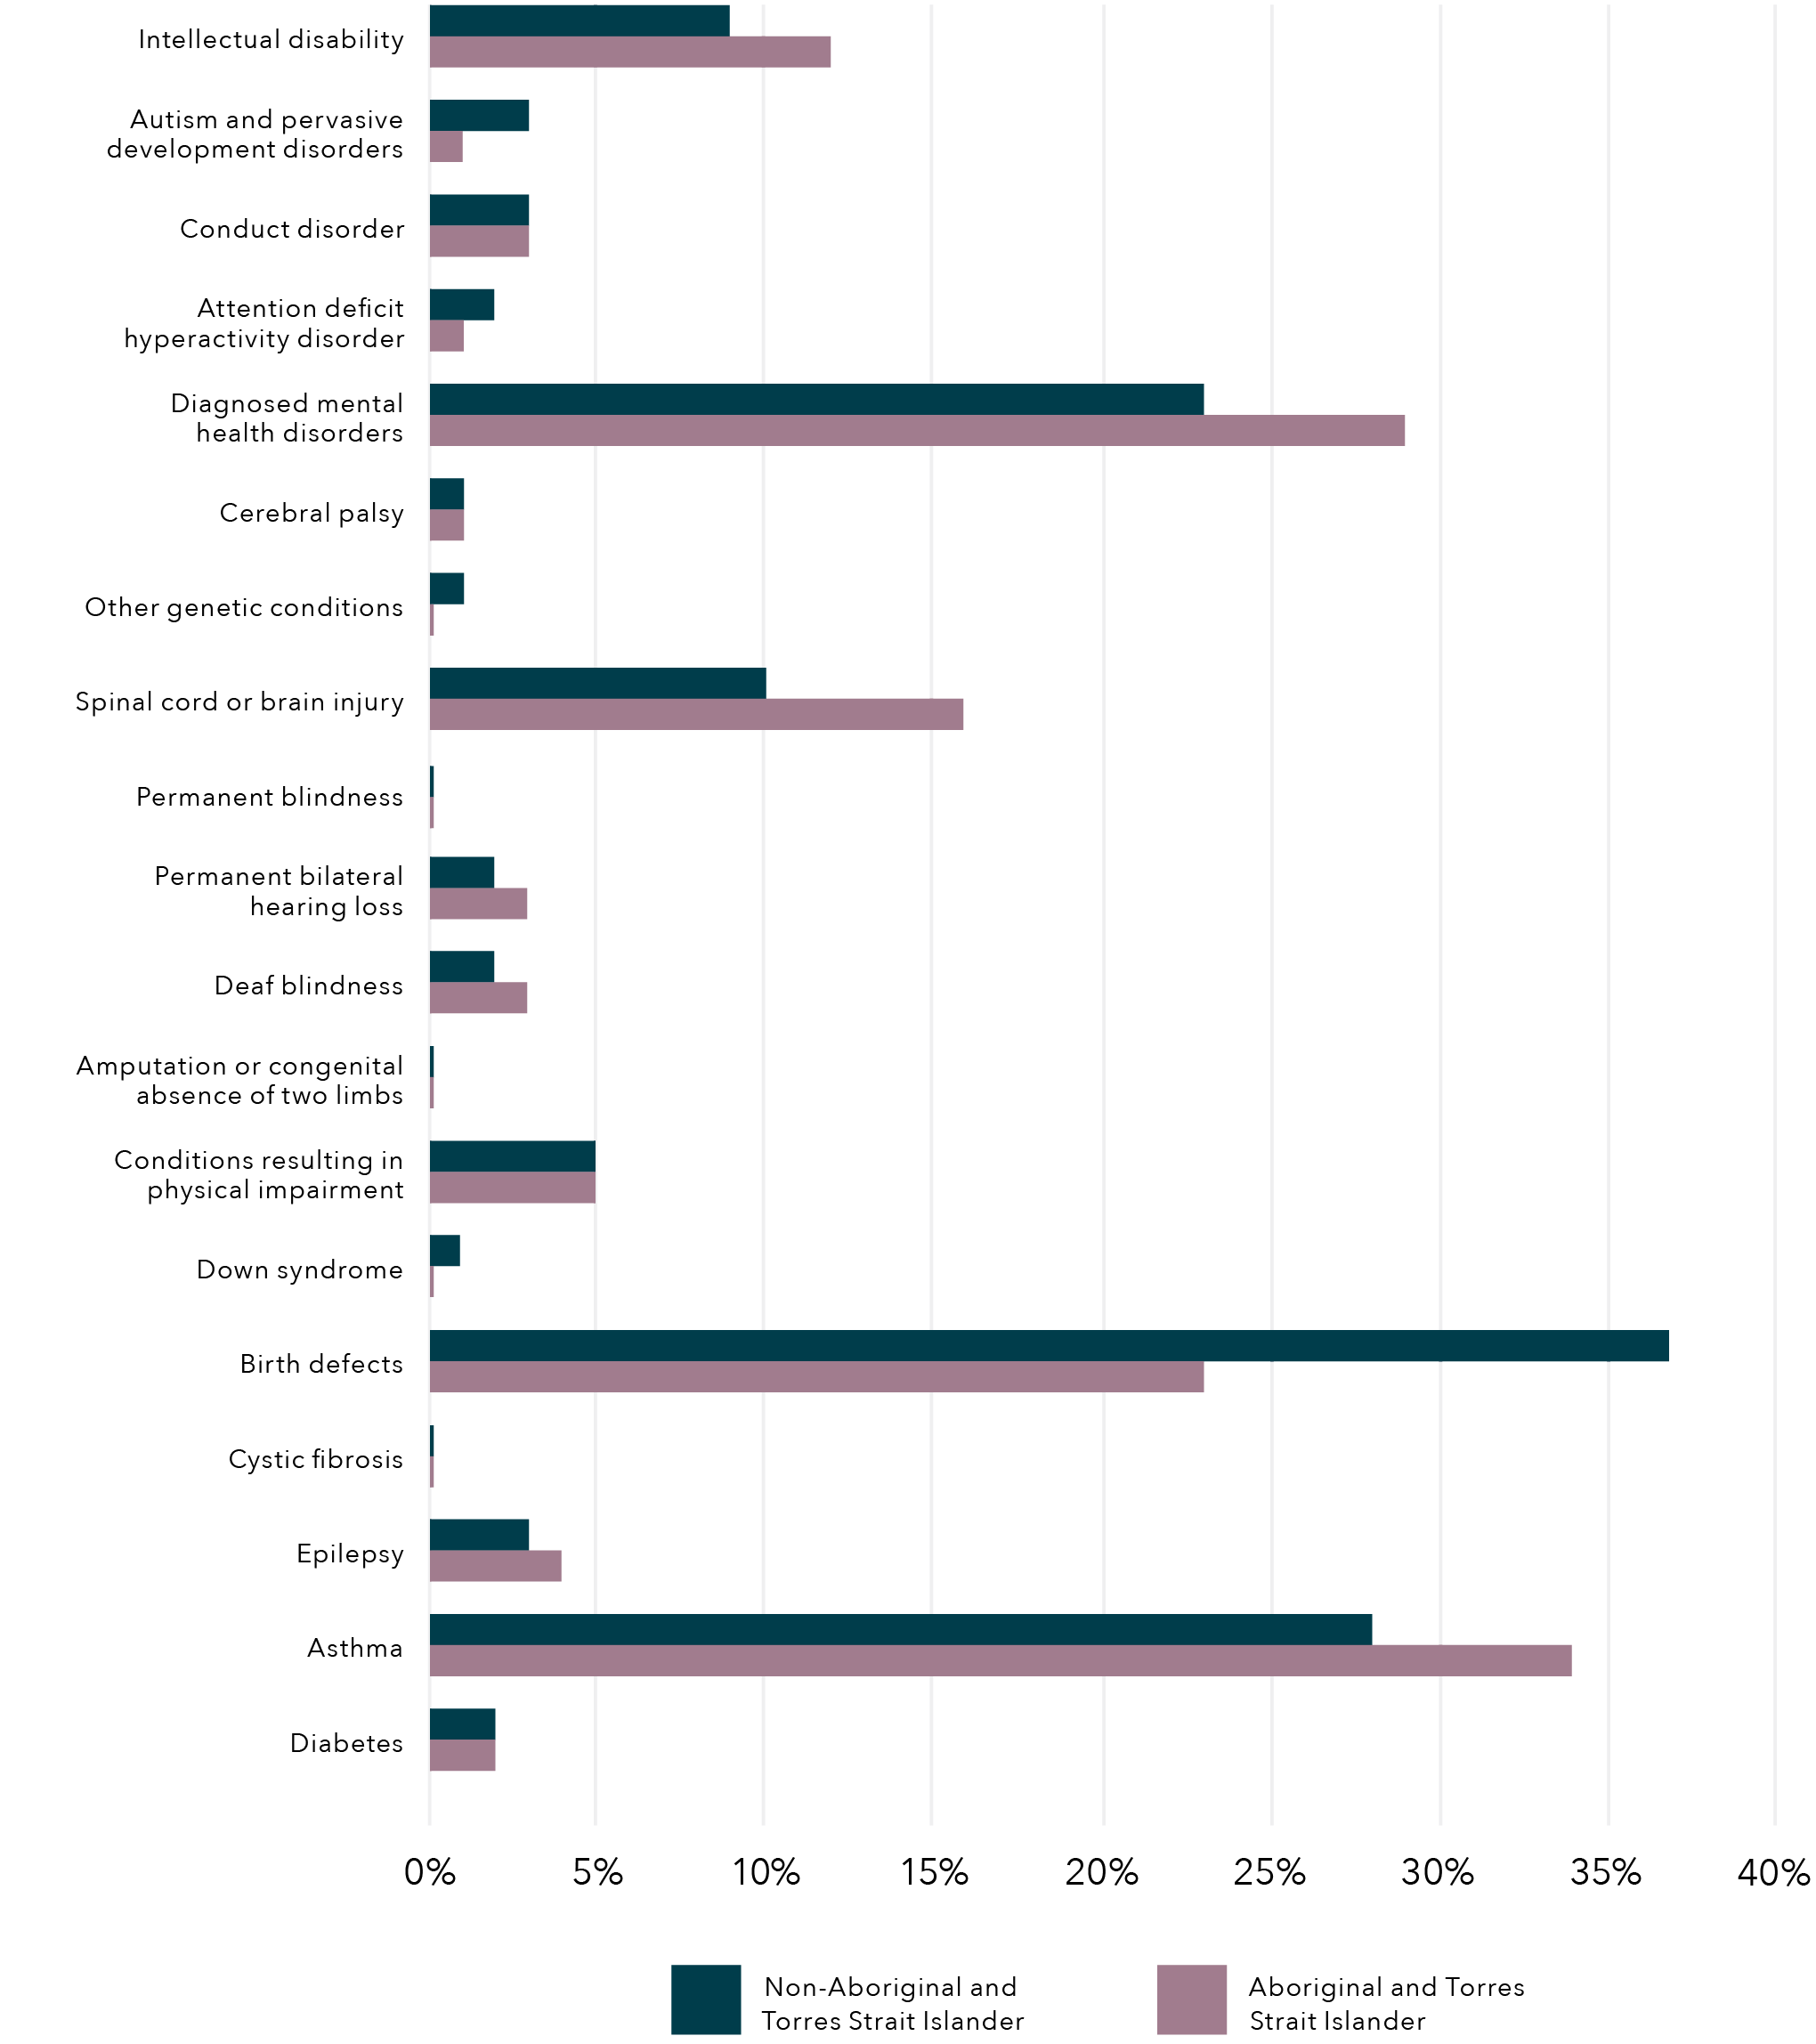
Diagnosed mental health disorders, asthma and birth defects were the three most prevalent disability types for both Aboriginal and Torres Strait Islander and non-Aboriginal and Torres Strait Islander children. Interestingly, when comparing disability types the highest differences in prevalence were also seen within those disability types (Figure 3):
- Diagnosed mental health disorders were found in 29 per cent of Aboriginal and Torres Strait Islander children with disability and 23 per cent of non-Aboriginal and Torres Strait Islander children with disability.
- Birth defects were present in 37 per cent of non-Aboriginal and Torres Strait Islander children with disability and 23 per cent of Aboriginal and Torres Strait Islander children with disability.
- Asthma was found in 34 per cent of Aboriginal and Torres Strait Islander children with disability and 28 per cent of non-Aboriginal and Torres Strait Islander children with disability.
Figure 3: Proportion of Aboriginal and Torres Strait Islander and non-Aboriginal and Torres Strait Islander children with disability
Data table for the figure above
Disability
Non-Aboriginal and Torres Strait Islander ( %)
Aboriginal and Torres Strait Islander (%)
Intellectual disability
8.96
11.97
Autism and pervasive development disorders
3.01
1.00
Conduct disorder
3.08
3.08
Attention deficit hyperactivity disorder
2.00
1.14
Diagnosed mental health disorders
23.08
29.03
Cerebral palsy
1.14
1.14
Other genetic conditions
1.14
0.28
Spinal cord or brain injury
10.10
15.92
Permanent blindness
0.22
0.22
Permanent bilateral hearing loss
1.98
3.00
Deaf blindness
2.03
3.00
Amputation or congenital absence of two limbs
0.22
0.22
Conditions resulting in physical impairment
5.00
5.00
Down syndrome
0.96
0.21
Birth defects
36.87
23.06
Cystic fibrosis
0.21
0.21
Epilepsy
3.05
4.01
Asthma
28.08
34.03
Diabetes
2.03
2.03
Note: Broader groups are not presented. Percentages are calculated over total number of children in the population. Children with coexisting conditions are included multiple times, once in each condition.
Exposure to DFV
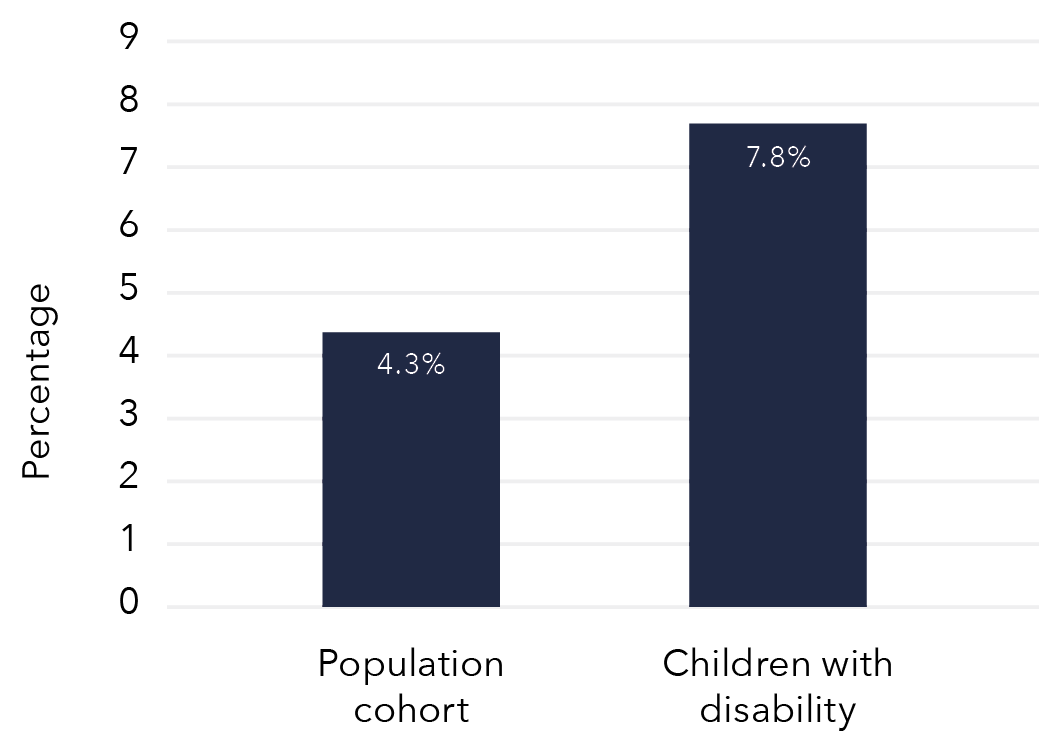
The second component of this study was determining the prevalence of children with disability who are exposed to DFV, utilising population-level administrative data from Western Australia. Using maternal hospitalisation for assault as an indicator of DFV, we found that there were 22,368 children (born 1990 to 2009) who had been exposed to DFV between March 1989 and June 2013.
Overall, these results represented a population prevalence of 4 per cent, with children with disability exposed at double the prevalence at 8 per cent (6526; Figure 4). This higher prevalence is consistent with previous research that has found children with disability have a higher risk of exposure to violence and child protection involvement compared to their non-disabled peers (Jones et al., 2012; Maclean et al., 2017).
Figure 4: Proportion of children who were exposed to DFV (mother hospitalised for assault) between March 1989 and June 2013, overall and for children with disability
Data table for the figure above
Population portion
Proportion of children
Population cohort
4.3%
Children with disability
7.8%
Of children exposed to DFV (mother hospitalised for assault), 29 per cent were children with disability. Within this group, physical health conditions were the most prevalent type of disability identified in 13 per cent of children exposed to DFV. The most prevalent physical conditions were birth defects and spinal cord or brain injuries, with 6 per cent and 4 per cent of children exposed to DFV respectively. Mental health conditions were identified in 12 per cent of children exposed to DFV, 10 per cent were identified as having a chronic health condition and 5 per cent were identified as having an intellectual and/or developmental condition.
Children with disability were more likely to be exposed to DFV (mother hospitalised for assault) than children without disability. However, not all disability groups had the same exposure to DFV. When looking at the disability groups for children exposed to DFV, we found (Figure 5):
- All conditions (except cystic fibrosis) showed higher exposure to DFV than the overall birth cohort.
- The highest proportion of children exposed to DFV was seen within the broad mental health conditions group, where over 13 per cent of children diagnosed with mental health disorders and/or conduct disorder were exposed.
- Almost 7 per cent of children with physical conditions were exposed to DFV, with children with conditions resulting from physical impairment reaching 12 per cent exposure.
- Similarly, within the broad intellectual and/or developmental conditions group, 12 per cent of children with intellectual disability and/or ADHD were exposed to DFV.
- Finally, children with epilepsy showed the relative highest exposure in the broad chronic health conditions groups, at 10 per cent.
Figure 5: Proportion of children exposed to DFV (mother hospitalised for assault), by disability type
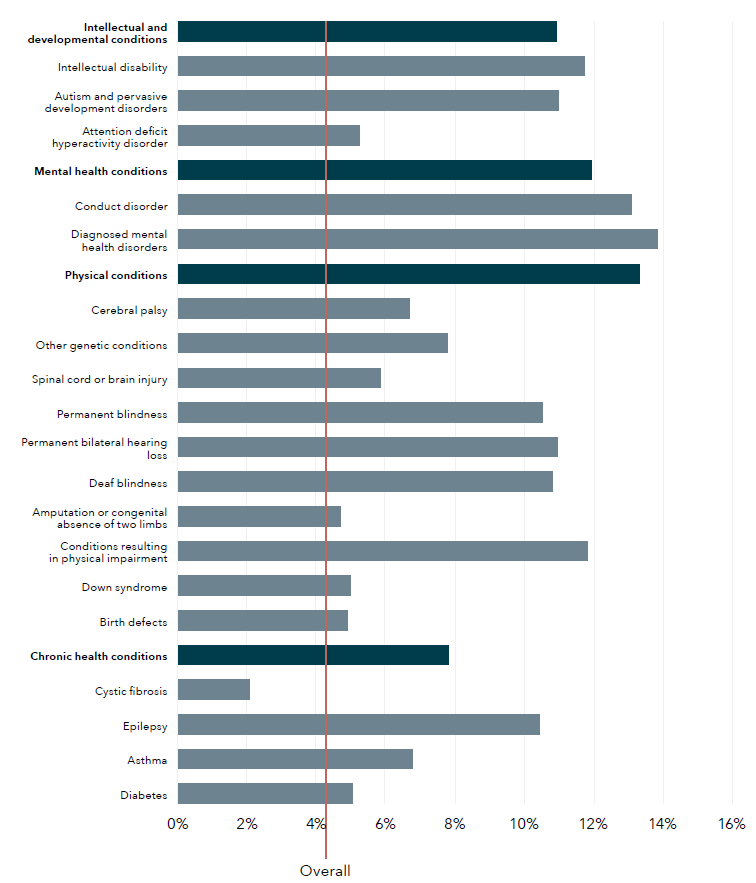
Data table for the figure above
Disability type
Proportion of children (%)
Intellectual and development conditions
10.94
Intellectual disability
11.75
Autism and pervasive development disorders
11.00
Attention deficit hyperactivity disorder
5.23
Mental health conditions
11.96
Conduct disorder
13.11
Diagnosed mental health disorders
13.84
Physical conditions
13.33
Cerebral palsy
6.69
Other genetic conditions
7.79
Spinal cord or brain injury
5.85
Permanent blindness
10.53
Permanent bilateral hearing loss
10.95
Deaf blindness
10.82
Amputation or congenital absence of two limbs
4.70
Conditions resulting in physical impairment
11.84
Down syndrome
4.99
Birth defects
4.90
Chronic health conditions
7.83
Cystic fibrosis
2.08
Epilepsy
10.44
Asthma
6.77
Diabetes
5.04
Overall
4.25
Note: Red line indicates overall population proportion. Percentages are calculated over total number of children with each disability type. Darker blue lines indicate the broad disability groups. Children with coexisting conditions are included multiple times, once in each condition.
Children living in socio-economically disadvantaged areas were more likely to be exposed to DFV (mother hospitalised for assault). Of children exposed to DFV, 61 per cent were from the two most socio-economically disadvantaged quintiles, which compares to 42 per cent of the overall population. This proportion was slightly higher for children with disability exposed to DFV (63%). Finally, children exposed to DFV were more likely to be from outer regional, remote or very remote areas (34%) compared to the overall cohort (17%). Exposure to DFV was slightly higher among children with disability who lived in outer regional, remote or very remote areas (36%) than children without disability who lived in outer regional, remote or very remote areas (33%).
Table 7: Demographic characteristics of children exposed to DFV (mother hospitalised for assault), overall and by disability status
Total
Demographic
Children with mothers hosp. for assault
N
Children with mothers hosp. for assault
%
Disability flag
No
N
Disability flag
No
%
Disability flag
Yes
N
Disability flag
Yes
%
N
22,368
15,842
70.82
6,526
29.18
Aboriginal and Torres Strait Islander status
Demographic
Children with mothers hosp. for assault
N
Children with mothers hosp. for assault
%
Disability flag
No
N
Disability flag
No
%
Disability flag
Yes
N
Disability flag
Yes
%
Yes
10,233
45.77
7,023
44.35
3,210
49.20
No
12,126
54.23
8,812
55.65
3,314
50.80
Sex
Demographic
Children with mothers hosp. for assault
N
Children with mothers hosp. for assault
%
Disability flag
No
N
Disability flag
No
%
Disability flag
Yes
N
Disability flag
Yes
%
Female
10,958
48.99
8,121
51.26
2,837
43.47
Male
11,410
51.01
7,721
48.74
3,689
56.53
SEIFA
Demographic
Children with mothers hosp. for assault
N
Children with mothers hosp. for assault
%
Disability flag
No
N
Disability flag
No
%
Disability flag
Yes
N
Disability flag
Yes
%
1 (most disadvantaged)
9,385
42.16
6,548
41.54
2,837
43.67
2
4,296
19.30
3,028
19.21
1,268
19.52
3
3,709
16.66
2,626
16.66
1,083
16.67
4
2,835
12.74
2,085
13.23
750
11.55
5 (least disadvantaged)
2,033
9.13
1,475
9.36
558
8.59
Remoteness
Demographic
Children with mothers hosp. for assault
N
Children with mothers hosp. for assault
%
Disability flag
No
N
Disability flag
No
%
Disability flag
Yes
N
Disability flag
Yes
%
Major cities
10,665
56.40
7,688
57.09
2,977
54.68
Inner regional
1,771
9.36
1,290
9.58
481
8.84
Outer regional
2,410
12.74
1,673
12.42
737
13.54
Remote
1,860
9.84
1,299
9.65
561
10.30
Very remote
2,205
11.66
1,517
11.26
688
12.64
Note: Aboriginal and Torres Strait Islander status, SEIFA and remoteness count subtotals do not sum to 100 per cent of children due to missing records.
Aboriginal and Torres Strait Islander children exposed to DFV
Aboriginal and Torres Strait Islander children were disproportionately exposed to DFV (mother hospitalised for assault) at 26 per cent, compared to only 3 per cent of non-Aboriginal and Torres Strait Islander children.
This proportion was even higher for Aboriginal and Torres Strait Islander children with disability, at 36 per cent. Aboriginal and Torres Strait Islander children made up 46 per cent of children with a mother hospitalised for assault, which was almost six times the proportion of Aboriginal and Torres Strait Islander children in the study birth cohort. Given that Aboriginal and Torres Strait Islander children make up 8 per cent of our cohort, this is a significant over-representation and is consistent with previous findings from survey data (ABS, 2019b). Furthermore, Aboriginal and Torres Strait Islander children with disability represented 49 per cent of children with disability exposed to DFV, with only 11 per cent of Aboriginal andTorres Strait Islander children with disability in the overall cohort.
Child protection contact
There were 29,071 (5.5%) children in the birth cohort with a maltreatment allegation between January 1990 and March 2013. A total of 12,638 children had a substantiated allegation, which represented 2.4 per cent of the study population, and 9,081 (1.7%) children had at least one out-of-home care placement during the study period. Overall, 30,493 (5.8%) children had contact with the child protection system (notifications, substantiations and/or out-of-home care placement). Note that there are 1,422 children who entered care but did not have a prior maltreatment allegation. We could not determine from the data the reason for care entry. Children can be placed in care without allegations for many reasons (e.g. children who were abandoned or homeless, children who came to child protection services from the juvenile justice system, or children who were siblings of other children notified). While the average age at first maltreatment allegation and/orsubstantiation was five years old, the average age at care placement was four years. However, 28 per cent, 31 per cent and 36 per cent of children were one years old or less when they had their first allegation, substantiation and/or care placement, respectively.
Children with disability were more likely to have contact with child protection, consistent with previous research (Jones et al., 2012; Maclean et al., 2017). Within the group with disability, proportions of child protection involvement were more than double the population levels (Figure 6).
- The proportion of children with disability who had at least one maltreatment allegation was 11 per cent.
- Five and a half per cent had at least one substantiated maltreatment allegation.
- Four per cent were placed in out-of-home care at least once.
The proportion of children with disability among those with a maltreatment allegation was 32 per cent. Similarly, within those with substantiated maltreatment as well as among those with a care placement, 36 per cent were identified as having a disability. This shows a significant over-representation of children with disability in contact with the child protection system, with only 16 per cent of children in the overall cohort identified as having a disability.
Figure 6: Child protection involvement for children in birth cohort and those with disability
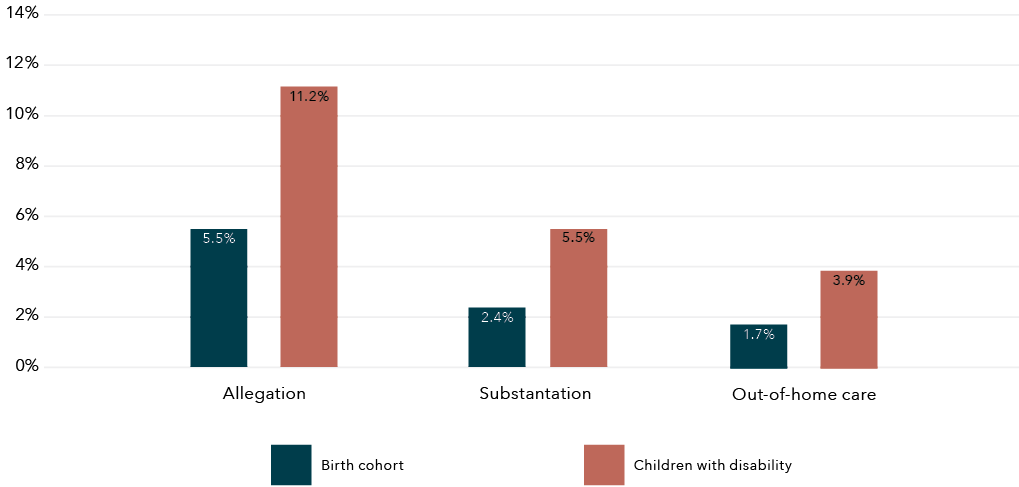
Data table for the figure above
Child protection involvement
Birth cohort
Children with disability
Allegation
5.5%
11.2%
Substantiation
2.4%
5.5%
Out-of-home care
1.7%
3.9%
Figure 7 displays the proportion of children with a maltreatment allegation by type of abuse at first contact with child protection for those identified as having or not having disability. Neglect and physical abuse at first allegation were slightly more prevalent among children with disability, at 31 per cent and 28 per cent respectively (test of proportions: 0.03[CI: 0.01–0.04; p=0.00] and 0.04[CI: 0.02–0.05; p=0.00], respectively). Sexual abuse did not show significant difference between children with and without disability (0.01[CI: 0.00–0.02; p=0.15]). Conversely, the proportion of those exposed to emotional, psychological and other types of maltreatment at first allegation was slightly more prevalent within those with no identified disability (0.03[CI: 0.02–0.03; p=0.00], 0.003[CI: 0.001–0.004; p=0.00] and 0.04[CI: 0.03–0.04; p=0.00], respectively).
Figure 7: Proportion of children’s type of abuse at first child protection contact (maltreatment allegation) for those with and without disability
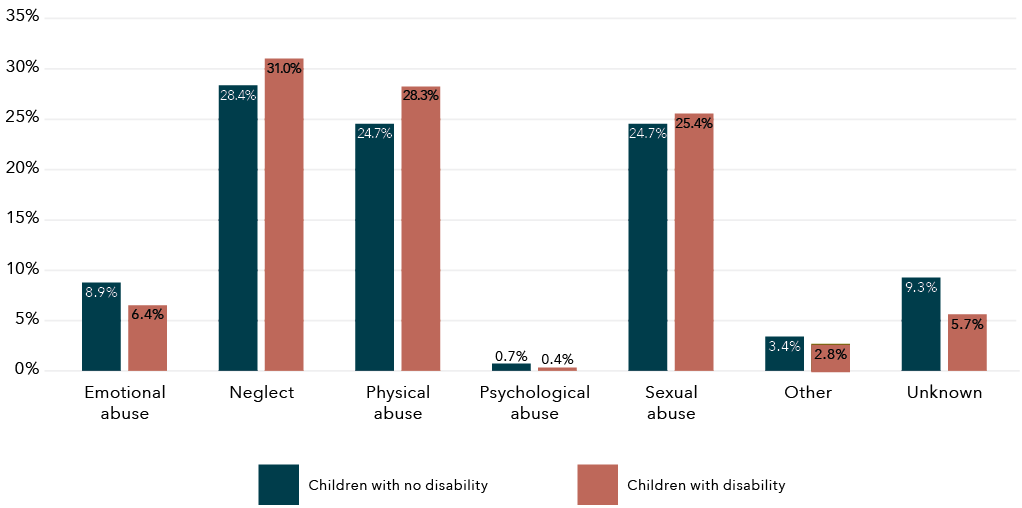
Data table for the figure above
Type of above
Children with no disability
Children with disability
Emotional abuse
8.9%
6.4%
Neglect
24.8%
31.0%
Physical abuse
24.7%
28.3%
Psychological abuse
0.7%
0.4%
Sexual abuse
24.7%
25.4%
Other
3.4%
2.8%
Unknown
9.3%
5.7%
Note: No information of type of abuse was available for children whose first contact with child protection was an out-of-home-care placement.
Child protection involvement was variable across children with different types of disability (Figure 8). Conduct disorder, ADHD, conditions resulting from physical impairment and intellectual disability showed the highest proportion of children with a maltreatment allegation, with 33 per cent, 31 per cent, 28 per cent and 22 per cent of children in these groups having at least one allegation of maltreatment during the follow-up period, respectively.
Figure 8: Proportion of children with at least one child maltreatment allegation, by type of disability
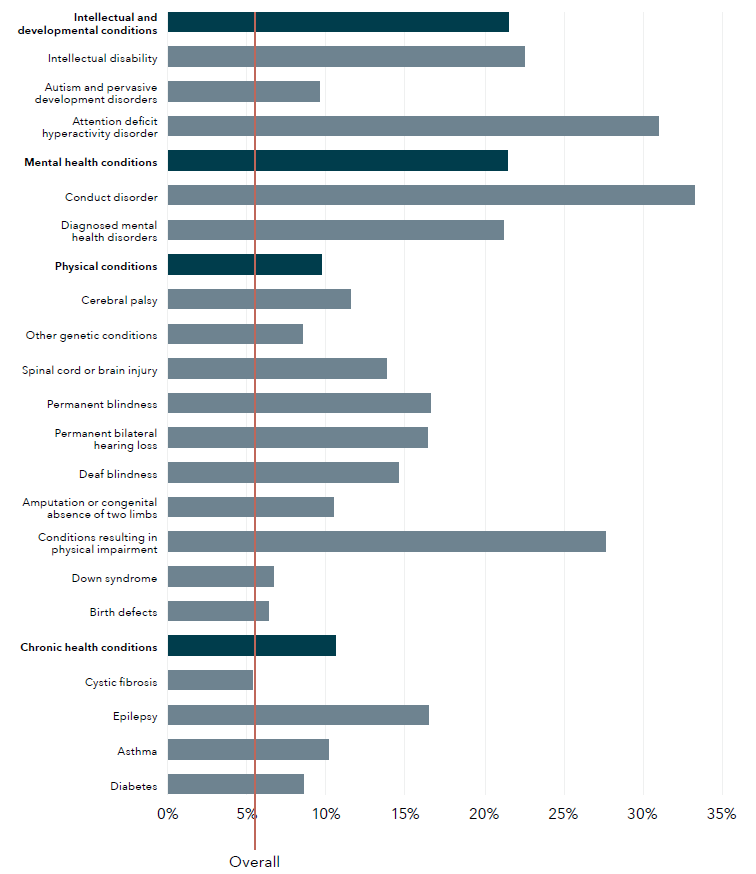
Data table for the figure above
Disability type
Proportion of children (%)
Intellectual and development conditions
21.54
Intellectual disability
22.55
Autism and pervasive development disorders
9.59
Attention deficit hyperactivity disorder
30.99
Mental health conditions
21.45
Conduct disorder
33.27
Diagnosed mental health disorders
21.23
Physical conditions
9.72
Cerebral palsy
11.51
Other genetic conditions
8.54
Spinal cord or brain injury
13.83
Permanent blindness
16.64
Permanent bilateral hearing loss
16.42
Deaf blindness
14.62
Amputation or congenital absence of two limbs
10.51
Conditions resulting in physical impairment
27.67
Down syndrome
6.70
Birth defects
6.39
Chronic health conditions
10.64
Cystic fibrosis
5.38
Epilepsy
16.50
Asthma
10.16
Diabetes
8.58
Overall
5.56
Note: Red line indicates overall population proportion. Percentages are calculated over total number of children with each disability type. Darker blue lines indicate the broad disability groups. Children with coexisting conditions are included multiple times, once in each condition.
In the overall cohort, 52 per cent of female children had contact with the child protection system – slightly more than male children (48%). However, for children with disability, there was a higher proportion of male (54%) than female (46%) children who had contact with child protection. This is driven by the higher percentage of male children with disability involved in child protection, for all levels of child protection involvement.
Table 8: Demographic characteristics of children by type of child protection involvement, by disability status
Total
Children with no disability
Demographic
Allegations
N
Allegations
%
Substantiations
N
Substantiations
%
OoHC [a]
N
OoHC [a]
%
N
19,651
4.46
8,031
1.82
5,803
1.32
Children with disability
Demographic
Allegations
N
Allegations
%
Substantiations
N
Substantiations
%
OoHC [a]
N
OoHC [a]
%
N
9,420
11.25
4,607
5.50
3,278
3.91
Sex
Children with no disability
Demographic
Allegations
N
Allegations
%
Substantiations
N
Substantiations
%
OoHC [a]
N
OoHC [a]
%
Female
10,781
54.88
4,455
55.49
3,090
53.26
Male
8,862
45.12
3,573
44.51
2,712
46.74
Children with disability
Demographic
Allegations
N
Allegations
%
Substantiations
N
Substantiations
%
OoHC [a]
N
OoHC [a]
%
Female
4,345
46.13
2,243
48.69
1,417
43.23
Male
5,074
53.87
2,364
51.31
1,861
56.77
Aboriginal and Torres Strait Islander status
Children with no disability
Demographic
Allegations
N
Allegations
%
Substantiations
N
Substantiations
%
OoHC [a]
N
OoHC [a]
%
Yes
6,279
31.97
2,948
36.73
2,432
41.94
No
13,359
68.03
5,078
63.27
3,367
58.06
Children with disability
Demographic
Allegations
N
Allegations
%
Substantiations
N
Substantiations
%
OoHC [a]
N
OoHC [a]
%
Yes
2,946
31.28
1,666
36.18
1,288
39.30
No
6,471
68.72
2,939
63.82
1,989
60.70
Socio-Economic Index for Area
Children with no disability
Demographic
Allegations
N
Allegations
%
Substantiations
N
Substantiations
%
OoHC [a]
N
OoHC [a]
%
1 (most disadvantaged)
6,701
34.24
2,822
35.31
2,059
35.68
2
4,614
23.57
1,842
23.05
1,369
23.73
3
3,876
19.80
1,620
20.27
1,162
20.14
4
2,749
14.04
1,069
13.38
725
12.56
1 (most disadvantaged)
6,701
34.24
2,822
35.31
2,059
35.68
Children with disability
Demographic
Allegations
N
Allegations
%
Substantiations
N
Substantiations
%
OoHC [a]
N
OoHC [a]
%
1 (most disadvantaged)
3,398
36.20
1,738
37.90
1,241
38.00
2
2,269
24.17
1,079
23.53
771
23.61
3
1,760
18.75
861
18.77
615
18.83
4
1,131
12.05
533
11.62
377
11.54
1 (most disadvantaged)
828
8.82
375
8.18
262
8.02
Remoteness
Children with no disability
Demographic
Allegations
N
Allegations
%
Substantiations
N
Substantiations
%
OoHC [a]
N
OoHC [a]
%
Major cities
10,762
62.29
4,397
62.90
3,214
64.01
Inner regional
2,190
12.68
862
12.33
592
11.79
Outer regional
2,086
12.07
737
10.54
566
11.27
Remote
1,306
7.56
546
7.81
380
7.57
Very remote
934
5.41
448
6.41
269
5.36
Children with disability
Demographic
Allegations
N
Allegations
%
Substantiations
N
Substantiations
%
OoHC [a]
N
OoHC [a]
%
Major cities
5,189
63.26
2,511
63.04
1,799
63.91
Inner regional
823
10.03
362
9.09
273
9.70
Outer regional
1,041
12.69
504
12.65
339
12.04
Remote
659
8.03
342
8.59
250
8.88
Very remote
491
5.99
264
6.63
154
5.47
Note: a OoHC refers to out-of-home care. Sex, Aborigial and Torres Strait Islander status, SEIFA and remoteness count subtotals do not sum to 100 per cent of children due to missing records.
Children who had contact with child protection were more likely to come from the most socio-economically disadvantaged areas. For all levels of child protection involvement, at least 35 per cent of children with disability were living in the most disadvantaged quintile as opposed to the least disadvantaged (8%). This compares to the overall cohort, where only 22 per cent of children live in the most disadvantaged quintile.
Aboriginal and Torres Strait Islander children: Child protection involvement
The over-representation of Aboriginal and Torres Strait Islander children with child protection contact was seen in this WA cohort. The Aboriginal and Torres Strait Islander children in the sample had 5.6 times higher prevalence of maltreatment allegations than non-Aboriginal and Torres Strait Islander children, 7 times higher prevalence of substantiated allegations and 8.4 times higher prevalence of placement in out-of-home care. This is consistent with the Aboriginal and Torres Strait Islander over-representation reported across jurisdictions in Australia in the national Child Protection Australia 2019–2020 publication (AIHW, 2021).
Aboriginal and Torres Strait Islander children with disability were also over-represented for each level of child protection involvement, with almost one third of all children with disability who had a maltreatment allegation being Aboriginal and Torres Strait Islander. The proportion of Aboriginal and Torres Strait Islander children with disability with child protection involvement was between 3.8 and 5.6 times the proportion found for non-Aboriginal and Torres Strait Islander children with disability. Similar over-representation of Aboriginal and Torres Strait Islander children was found among children with disability across all levels of child protection involvement.
Overlap between exposure to DFV and contact with the child protection system (birth cohort)
The majority of children who were exposed to DFV (identified by maternal hospitalisations for assault or child protection involvement) were identified by one data source only. Close to two thirds (62%) of children whose mothers were hospitalised for assault were only identified as exposed to DFV by hospitalisation records (2.6% of overall cohort). Similarly, 72 per cent of children involved with the child protection system were only identified as exposed to DFV by child protection data (4.2% of total cohort). Interestingly, these percentages were lower for children with disability at 53 per cent and 69 per cent, respectively.
There was a significant overlap between children identified as having a mother with an assault hospitalisation and those in contact with the child protection system. Overall, 38 per cent of children exposed to maternal assault hospitalisations were also in contact with child protection (allegation, substantiation and/or care placement); this proportion was 30 per cent of those in contact with child protection or 1.6 per cent of the birth cohort. This was higher for children with disability: 47 per cent of those with a mother hospitalised for assault were also in contact with child protection (31% of those in contact with child protection or 3.7% of the cohort with disability).
Table 9: Children who were involved in child protection and had a mother hospitalised for assault, by disability status
Maternal assault hospitalisation & child protection
Factor
Overall
N
Overall
%
No disability
N
No disability
%
Disability
N
Disability
%
Maternal assault hospitalisation (MAH)
22,368
4.26
15,842
3.59
6,526
7.79
Child protection contact, any (Any CP)
30,493
5.81
20,616
4.68
9,877
11.79
Interaction
Factor
Overall
N
Overall
%
No disability
N
No disability
%
Disability
N
Disability
%
MAH only
13,869
2.64
10,424
2.36
3,445
4.11
Allegation & MAH
8,038
1.53
5,124
1.16
2,914
3.48
Substantiations & MAH
4,505
0.86
2,722
0.62
1,783
2.13
OoHC [a] & MAH
3,836
0.73
2,368
0.54
1,468
1.75
Any CP & MAH
8,499
1.62
5,418
1.23
3,081
3.68
Any CP only
21,994
4.19
15,198
3.45
6,796
8.11
Note: a OoHC refers to out-of-home care.
Percentages are a proportion of the total number of children in birth cohort.
For children in the cohort whose mother was hospitalised for assault, 36 per cent had a maltreatment allegation (1.5% of cohort), 20 per cent had a substantiated allegation (0.9% of cohort) and 17 per cent were placed in out-of-home care in the follow-up period (0.7% of cohort). Among those with disability, this percentage was higher for allegations (44%), substantiated allegations (27%), and being placed in out-of-home care (22%), respectively.
Aboriginal and Torres Strait Islander children
The overlap between children identified as having a mother with an assault hospitalisation and those in contact with the child protection system was more pronounced for Aboriginal and Torres Strait Islander children. Of Aboriginal and Torres Strait Islander children identified as exposed to DFV by maternal assault hospitalisation, 47 per cent also had contact with child protection, compared to 30 per cent of non-Aboriginal and Torres Strait Islander children exposed to DFV. This overlap was higher among children with disability, with 54 per cent of Aboriginal and Torres Strait Islander children with disability exposed to DFV by maternal assault hospitalisations also having contact with child protection, compared to 40 per cent of non-Aboriginal and Torres Strait Islander children with disability exposed to DFV also having contact with child protection (Figure 9).
The percentage of children identified by only one data source was lower for Aboriginal and Torres Strait Islander children compared to non-Aboriginal and Torres Strait Islander children. Half (50%) of Aboriginal and Torres Strait Islander children identified by child protection were only identified by child protection data and 53 per cent of those exposed to maternal assault hospitalisations were only identified by hospitalisation records. This compares to 70 per cent of non-Aboriginal and Torres Strait Islander children with maternal assault hospitalisation only identified in hospitalisation records and 82 per cent of those in contact with child protection only being identified in this data source.
Figure 9: Proportion of Aboriginal and Torres Strait Islander children with and without overlapped DFV exposure and child protection involvement, overall cohort and by disability status
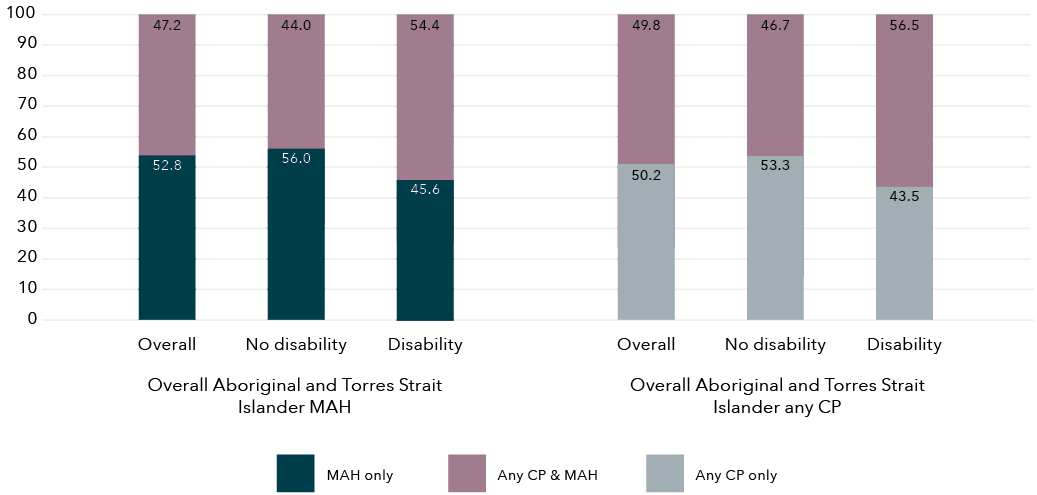
Data table for the figure above
Overall Aboriginal and Torres Strait Islander MAH
Disability status
MAH only (%)
Any CP & MAH (%)
Overall
52.8
47.2
No disability
56.0
44.0
Disability
45.6
54.4
Overall Aboriginal and Torres Strait Islander any CP
Disability status
Any CP only (%)
Any CP & MAH (%)
Overall
50.2
49.8
No disability
53.3
46.7
Disability
43.5
56.5
Note: MAH = maternal assault hospitalisation.
Any CP = any child protection involvement.
Aboriginal and Torres Strait Islander children were disproportionately over-represented among those exposed to maternal assault hospitalisation and involved with the child protection system. Aboriginal and Torres Strait Islander children represented 57 per cent of those exposed to maternal assault hospitalisation and with any child protection involvement, when non-Aboriginal and Torres Strait Islander children only represented 8 per cent of the cohort.
Linked data analysis (DFV cohort)
The second cohort analysis utilised data relating to children born alive in Western Australia between 1987 and 2010 and had a mother who experienced DFV, as identified through the WAPIMS (2004 to 2008). For this cohort, we were also able to determine whether the mother had a hospitalisation for assault through the HMDS data (1987 to 2016), and whether the children were involved in the child protection system (1990 to 2016). This cohort is not directly comparable to the previous birth cohort analysis as it only includes children identified through police data.
As shown in Table 10, there were 15,423 children with a mother identified in the police data where a male perpetrator was charged for a violent offence against them and a domestic relationship flag was present. Demographically, children exposed to DFV (mother in police data) were predominantly living in areas with the highest levels of socio-economic disadvantage (74%) and had a fairly even gender split, and Aboriginal and Torres Strait Islander children were over-represented at 54 per cent.
There were also high levels of child protection involvement for those children whose mother was identified in the police data with:
- 59 per cent of these children also having a child maltreatment allegation
- 30 per cent having a substantiated allegation
- 17 per cent having an out-of-home-care placement.
The proportion of children with maltreatment allegations and/or substantiated allegations was much lower than in the birth cohort, where 36 per cent had an allegation and 20 per cent had a substantiated allegation. However, children with a mother with an assault hospitalisation had a similar proportion of out-of-home-care placements to those identified in the police DFV data, at 17 per cent. Interestingly, only 24 per cent of children whose mother was identified as experiencing DFV in the police data were also identified as exposed to DFV using maternal hospitalisations for assault (Table 10). This proportion was slightly higher among children with disability, with 31 per cent of children whose mothers were identified by the police data as experiencing DFV also exposed to maternal assault hospitalisations.
For children in the DFV cohort, 30 per cent were children with disability (Table 10). The same definition of disability was used in the first and second analysis with a similar proportion (29%) of children with disability whose mother was hospitalised for assault.
Table 10: Children with and without disability with a mother identified in the police DFV dataset
Total
All children
N
All children
%
Disability flag
No
N
Disability flag
No
%
Disability flag
Yes
N
Disability flag
Yes
%
N
15,423
10,783
69.92
4,640
30.08
Aboriginal and Torres Strait Islander status
All children
N
All children
%
Disability flag
No
N
Disability flag
No
%
Disability flag
Yes
N
Disability flag
Yes
%
Yes
8,304
53.84
5,541
51.39
2,763
59.55
No
7,119
46.16
5,242
48.61
1,877
40.45
Sex
All children
N
All children
%
Disability flag
No
N
Disability flag
No
%
Disability flag
Yes
N
Disability flag
Yes
%
Female
7,552
48.97
5,510
51.10
2,042
44.01
Male
7,871
51.03
5,273
48.90
2,598
55.99
SEIFA
All children
N
All children
%
Disability flag
No
N
Disability flag
No
%
Disability flag
Yes
N
Disability flag
Yes
%
1 (most disadvantaged)
8,035
52.10
5,502
51.02
2,533
54.59
2
3,312
21.47
2,341
21.71
971
20.93
3
2,228
14.45
1,594
14.78
634
13.66
4
1,258
8.16
922
8.55
336
7.24
5 (least disadvantaged)
590
3.83
424
3.93
166
3.58
Remoteness
All children
N
All children
%
Disability flag
No
N
Disability flag
No
%
Disability flag
Yes
N
Disability flag
Yes
%
Major cities
7,188
46.61
5,061
46.93
2,127
45.84
Inner regional
1,567
10.16
1,151
10.67
416
8.97
Outer regional
2,264
14.68
1,628
15.10
636
13.71
Remote
1,778
11.53
1,214
11.26
564
12.16
Very remote
2,626
17.03
1,729
16.03
897
19.33
Child protection involvement
All children
N
All children
%
Disability flag
No
N
Disability flag
No
%
Disability flag
Yes
N
Disability flag
Yes
%
Any allegations
9,047
58.66
5,984
55.49
3,063
66.01
Any substantiations
4,582
29.71
2,899
26.88
1,683
36.27
Any care placement
2,581
16.73
1,570
14.56
1,011
21.79
Any contact
9,095
58.97
6,008
55.72
3,087
66.53
Mother domestic violence hospital admission from pregnancy to 6/2013
All children
N
All children
%
Disability flag
No
N
Disability flag
No
%
Disability flag
Yes
N
Disability flag
Yes
%
No
11,667
75.65
8,483
78.67
3,184
68.62
Yes
3,756
24.35
2,300
21.33
1,456
31.38
For children with disability whose mother was identified as experiencing DFV in the police data, 56 per cent were males and 60 per cent were Aboriginal and Torres Strait Islander children, both higher proportions compared to those with no disability. Similarly, children with disability in the DFV cohort showed a higher proportion of child protection involvement than those with no disability, with 66 per cent having an allegation, 36 per cent a substantiated allegation and 22 per cent a care placement.
As shown in Table 11, 35 per cent of children in the DFV cohort were not identified as having a maternal assault hospitalisation or child protection involvement. An additional 40 per cent of those in the DFV cohort were identified also as having child protection involvement but not a maternal assault hospitalisation. Conversely, 6 per cent had a maternal assault hospitalisation but no child protection involvement. Finally, of children in the DFV cohort, 18 per cent had contact with child protection and were exposed to a maternal assault hospitalisation (three-way interaction). All interactions between data sources identifying DFV were higher for children with disability, with 24 per cent of those with disability identified in the three datasets (police, hospitalisation records and child protection records).
Table 11: Children in the DFV cohort (police records) who were involved in child protection and had a mother hospitalised for assault, by disability status (two- and three-way interactions)
Overall
N
Overall
%
No disability
N
No disability
%
Disability
N
Disability %
Police only
5,352
34.70
4,124
38.25
1,228
26.47
MAH [a] & police
976
6.33
651
6.04
325
7.00
Any CP [b] & police
6,315
40.95
4,359
40.42
1,956
42.16
Allegation & MAH & police
2,755
17.86
1,636
15.17
1,119
24.12
Substantiations & MAH & police
1,641
10.64
936
8.68
705
15.19
OoHC [c] & MAH & police
1,074
6.96
621
5.76
453
9.76
Any CP & MAH & police
2,780
18.03
1,649
15.29
1,131
24.38
Notes: a MAH refers to maternal assault hospitalisation.
b Any CP refers to any child protection involvement.
c OoHC refers to out-of-home care.
Percentages are a proportion of the total number of children in the DFV cohort.
Figure 10 breaks down disability types for children in the DFV cohort.
- The largest proportion of disability identified in the children was in relation to mental health conditions, at 14 per cent.
- This was followed by conditions associated with physical disability, at 13 per cent.
- These physical disabilities were predominantly composed of birth defects (6%) and spinal cord or brain injuries (5%).
These results are similar to our previous findings in the first analysis, where the most prevalent disability types for children of mothers hospitalised for assault also were related to mental health conditions, at 12 per cent, and physical conditions at 13 per cent, with birth defect and spinal cord or brain injuries as the predominant types.
Figure 10: Children with disability in the DFV cohort, by type of disability and Aboriginal and Torres Strait Islander status
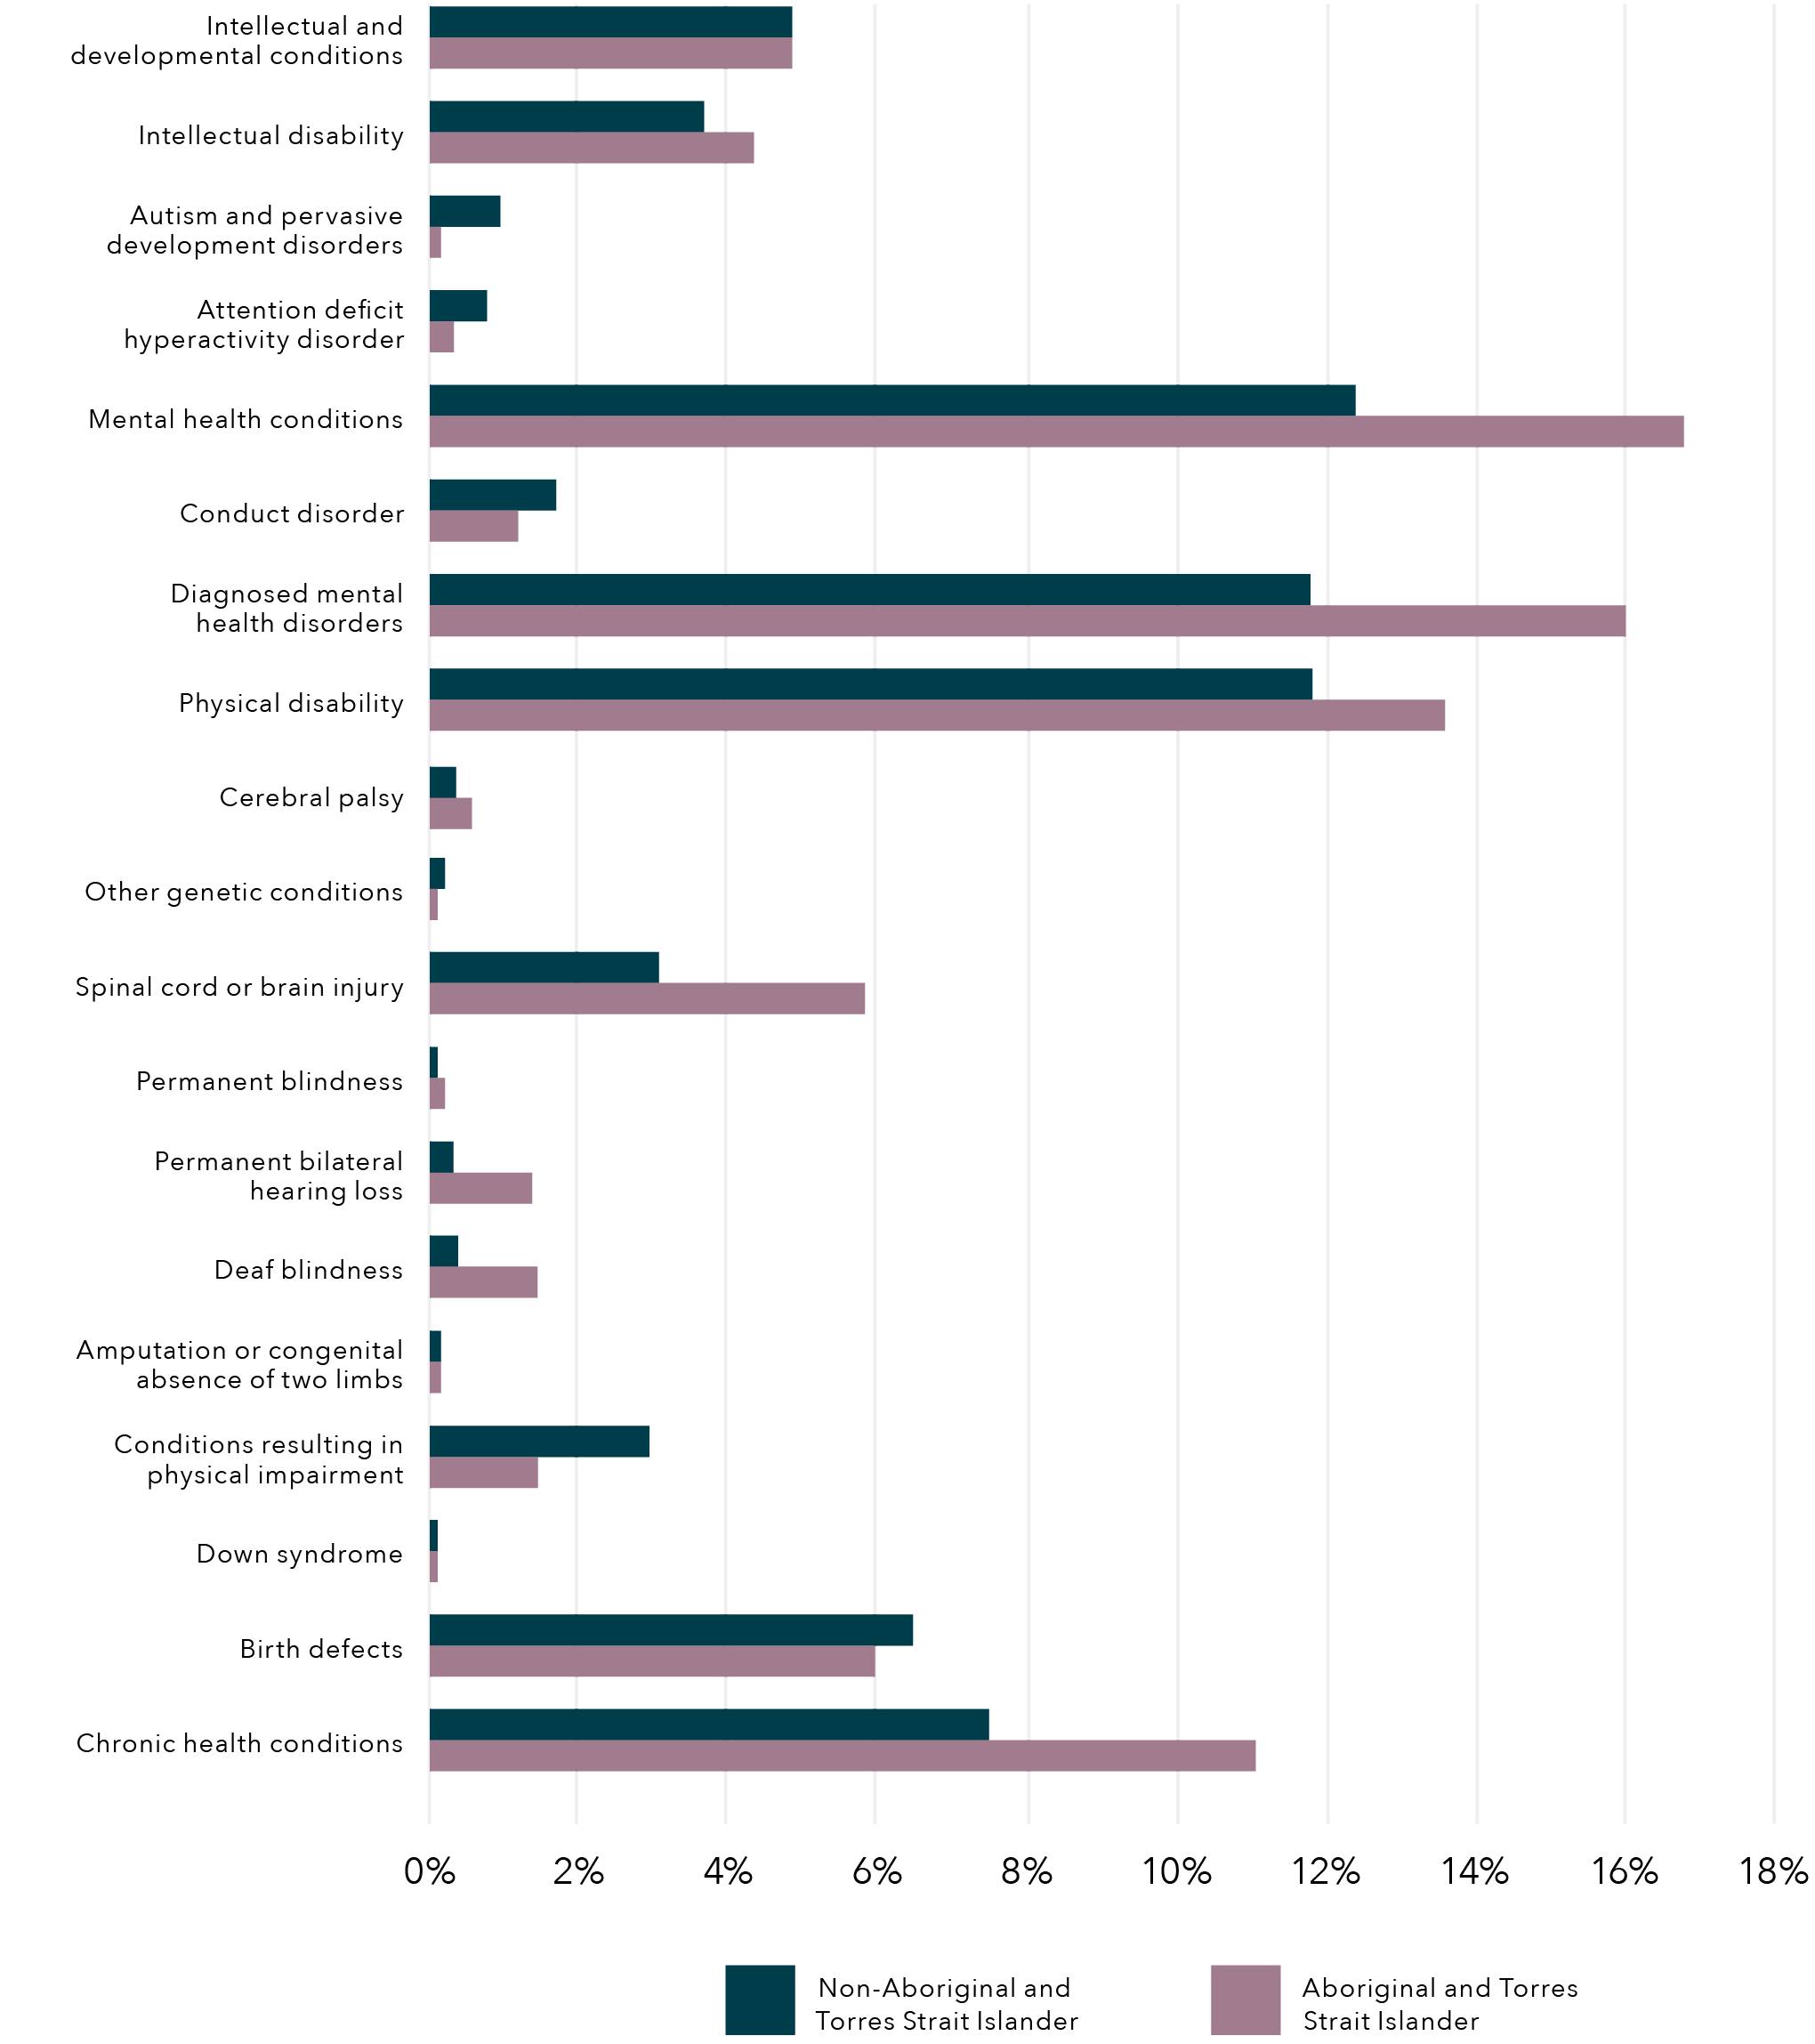
Note: Percentages are calculated in proportion to total number of children identified by police as exposed to DFV. Children with coexisting conditions are included multiple times, once in each condition.
Aboriginal and Torres Strait Islander children in the DFV cohort
One in three Aboriginal and Torres Strait Islander children identified as exposed to DFV in the police data were identified as having a disability, and this proportion was similar to the proportion of Aboriginal and Torres Strait Islander children exposed to maternal hospitalisation in the birth cohort analysis performed previously. Aboriginal and Torres Strait Islander children with disability represented almost 60 per cent of children in the DFV cohort, which was higher than the proportion of Aboriginal and Torres Strait Islander children exposed to DFV in the police data with no disability (53%).
When analysing Aboriginal and Torres Strait Islander children in the DFV cohort by type of disability, we found that:
- Mental health conditions were more prevalent for Aboriginal and Torres Strait Islander children (16%) compared to non-Aboriginal and Torres Strait Islander children (12%).
- Physical health conditions were slightly higher for Aboriginal and Torres Strait Islander children (14%) compared to non-Aboriginal and Torres Strait Islander children (12%).
- Finally, chronic health conditions were found in 11 per cent of Aboriginal and Torres Strait Islander children in the DFV cohort.
Phase 1A:
Linked data – Discussion
Birth cohort and DFV cohort analysis
Disability ascertainment
It is important when planning disability and related services that the needs of children are routinely determined to ensure planning and service provision meet the unique support requirements of children and their families. Therefore, the disability ascertainment that we were able to undertake through linking data in this project is an important contribution to knowledge, as it provides new information on the prevalence of disability. Population-level ascertainment of children with disability is important for the monitoring of support needs and the allocation of resources and services in our communities. By utilising a range of datasets, this study has been able to achieve relatively comprehensive ascertainment of conditions.
Our population-level data identified that 16 per cent of children in the birth cohort had disability based on the definition we have outlined in our methods. This level of disability is higher than the 7.7 per cent of children aged 0 to 14 years found in the SDAC but less than the 19 per cent reported by the Nationally Consistent Collection of Data on School Students with Disability (Productivity Commission, 2019). Differences may be due to the scope of disabilities captured by the survey versus administrative data and the age profiles of the children captured.
The majority of children in this study were identified using a single database, with HMDS identifying the largest proportion of children with disability (59%), followed by the WARDA (35%), the MHIS (16%) and the IDEA (10%). While the IDEA dataset ascertained a smaller number of children, importantly it did identify more than half the children in the cohort who had an intellectual disability. This highlights the importance of using multiple data sources to ascertain disability.
The majority of children we identified with disability had one identified condition (83%). For those who did have coexisting conditions, the most prevalent co-occurring conditions were:
- mental health and physical conditions (4.5%)
- chronic health and physical conditions (3.1%)
- physical and intellectual and developmental conditions (2.5%).
As we are not using self-report data, it is a challenge to understand the complexity of coexisting conditions utilising population-level data. The AIHW (2020) has reported high levels of coexisting conditions, including physical and mental health conditions, as well as double the prevalence of asthma in children with disability. A very small proportion (1%) of children in our cohort were identified as having all four broad groups of disability.
Exposure to domestic and family violence
Maternal hospitalisation for assault
By linking administrative data, we were able to identify that 4 per cent of all children in the birth cohort had a mother hospitalised for assault, and children with disability had double the prevalence at 8 per cent. This would be an underestimate of children’s exposure to DFV as it was limited to physical abuse. Importantly, of the children whose mother had a hospitalisation for assault, almost one in three were children with disability. While children with disability were over-represented in the prevalence of children with a mother hospitalised for assault, there was variability in exposure between disability conditions. The conditions with the greatest exposure to maternal assault hospitalisations were:
- mental health conditions (13%)
- intellectual and developmental conditions (11%)
- chronic conditions (8%)
- physical conditions (7%).
This is important because children with disability whose mothers are assaulted are at risk of experiencing trauma (McCloskey & Walker, 2000). The finding that a substantial proportion of these children have psychological and developmental support requirements is significant. Crisis and counselling support services need to be equipped to respond to the needs of children with disability in these families, and resourced to support them effectively.
The significant over-representation of Aboriginal and Torres Strait Islander children with disability whose mothers were hospitalised for assault is consistent with previous findings from survey data (ABS, 2019b). Gender-based violence is not consistent with traditional Aboriginal and Torres Strait Islander culture and the over-representation of DFV for Aboriginal and Torres Strait Islander children and mothers should be seen in the context of the impact of colonisation, dispossession and entrenched disadvantage (Our Watch, 2018; AIFS, 2019). This highlights the importance of Australia’s Closing the Gap target to reduce the rate of all forms of family violence and abuse against Aboriginal and Torres Strait Island women and children by at least 50 per cent by 2031 (Commonwealth of Australia, Department of Prime Minister and Cabinet, 2021a). The Closing the Gap Implementation Plan indicates a commitment bygovernments to build and strengthen structures to empower Aboriginal and Torres Strait Islander peoples. This includes building Aboriginal and Torres Strait Islander community-controlled sectors to deliver services and to share access to location-specific data and information to enable Aboriginal and Torres Strait Islander organisations and communities to obtain a comprehensive picture of what is happening in their communities to assist their decision-making (Commonwealth of Australia, Department of Prime Minister and Cabinet, 2021b). The Fourth Action Plan has prioritised the support of Aboriginal and Torres Strait Islander women who are disproportionately exposed to DFV, and highlighted the need for governments to enable community-led solutions and design of services. This requires comprehensive data to be provided across regions to ensure this information can be delivered to communities to enable community-driven strategies.
Almost two in three children with a mother hospitalised for assault were from the two most socio-economically disadvantaged quintiles and outer regional or remote areas. This has implications for regional and remote resource needs and service provision to address DFV and in regard to families that have additional needs in relation to supporting children with disability. While disability can impact on individuals from all socio-economic levels, there is well-established literature indicating a relationship between disability and socio-economic disadvantage (WHO, 2011). The intersection of poverty and ensuring accessible services for disability is therefore an imperative for policy and practice.
Child protection involvement
According to the current Western Australian Children and Community Services Act 2004, children in need of protection include those being exposed to family violence, which is categorised as emotional abuse. Child protection involvement is therefore another source of data for ascertaining children’s exposure to DFV and child maltreatment. The child protection data includes children who have been notified to child protection for all types of maltreatment, including emotional abuse, neglect, and physical, psychological and sexual abuse.
We found that within the birth cohort between January 1990 and March 2013:
- 5.5 per cent of children had a maltreatment allegation
- 2.4 per cent had a substantiated maltreatment
- 1.7 per cent had a placement in out-of-home care.
Children with disability had double the proportion of involvement in child protection. Among children with disability:
- 11 per cent had a child maltreatment allegation
- 5.5 per cent had a substantiated allegation
- almost 4 per cent had a placement in out-of-home care.
Overall, the type of maltreatment alleged in the first contact with child protection was similar between children with and without disability. The only difference was a slightly higher prevalence of neglect (31% vs. 28%) and physical abuse (28% vs. 25%) among children with disability compared to children with no disability. Like children with disability who have maternal assault hospitalisation, the proportion of children with maltreatment allegations varied by disability groups. Conduct disorder, ADHD, conditions resulting from physical impairment and intellectual disability showed the highest proportion of children with a maltreatment allegation.
Children with disability were significantly over-represented in the child protection system. Children with disability made up:
- 32 per cent of maltreatment allegations
- 36 per cent of those with substantiated maltreatment
- 36 per cent of placements into out-of-home care.
This is similar to the estimates of previous international studies (Dion et al., 2018; Sullivan & Knutson, 2000).
This has significant policy and practice implications for the resource and support needs of children with disability, in terms of both prevention and response to abuse and violence through the child protection system. This includes the children themselves who require comprehensive health and wellbeing plans, as well as children who are eligible for NDIS support. Support for families will also be required including those going through family preservation or reunification services to ensure additional needs of their children are able to be met. This may also include support for carers (either kinship or foster carers) to meet these needs and parenting skill- and capacity-building where needed. These findings have important implications for preventing child maltreatment and determining the causal pathways for children with disability and their increased risk of child protection involvement. Consideration should also be given to the fact that children withdisability often have greater service contact, which increases the surveillance of families with a child with disability and may also contribute to higher child protection involvement.
Children with maternal assault hospitalisation and child protection contact
Our study found that 38 per cent of children with a mother hospitalised for assault were in contact with the child protection system (1.6% of birth cohort), and this was higher for children with disability at 47 per cent (3.7% of children with disability in cohort). Research reviews have provided evidence that child abuse and DFV often co-occur, with studies citing around a 41 per cent co-occurrence of child abuse and DFV (Herrenkohl et al., 2008). Bragg (2003) also indicated that in 30 to 60 per cent of families where either DFV or child maltreatment is identified, it is likely that both forms of abuse exist. In our research it is difficult to elucidate whether the DFV exposure was considered the reason for the substantiated maltreatment. However, our research does highlight the important role of the hospital system in providing support to mothers who present for an assault hospitalisation and the role of social workers in partnering with mothers toaddress their safety, health and wellbeing needs. Connection to services and support prior to discharge is essential for mothers and their children to improve both their safety and wellbeing outcomes.
Linked police DFV and child protection data
The use of linked police DFV data is an important addition to ascertaining children’s exposure to DFV. Despite the different ascertainment of DFV between the two cohorts, we found similar proportions of children with disability in those children exposed to DFV, at approximately 30 per cent. Similarly, Aboriginal and Torres Strait Islander children were over-represented in both groups, which is consistent with previous research. However, Orr et al. (2022) did find that Aboriginal and Torres Strait Islander mothers were more likely to be identified in the hospital morbidity data (73%) than identified as victims in the police data (44%) (Orr et al., 2022) and surmised that Aboriginal and Torres Strait Islander mothers may be more reluctant to disclose to police (Orr et al., 2022). Hence it is important to investigate multiple data sources to ascertain DFV exposure for children and their families.
Of interest, we found that children whose mothers were identified as experiencing DFV in the police data had very high involvement with child protection. Two thirds (66%) of those identified as having disability in the police data had a child protection allegation, which was higher than children without an identified disability (55%). This compares to 45 per cent of children with disability from the birth cohort whose mother was hospitalised for assault also having a child protection allegation. Additionally, there were 10 per cent more child allegation substantiations for children in the DFV cohort compared to children whose mother had been hospitalised for assault in the birth cohort. Research has identified that reporting of DFV can result in unintended consequences, with the potential for inappropriate child protection reports and concern that adult victims rather than the perpetrators are being held accountable for child safety (Cross et al.,2012).
Importantly, for those children identified as having both a mother with an assault hospitalisation and identified in the police data, there was much greater involvement and intervention by child protection. For children with disability whose mother was identified in both:
- 77 per cent had an allegation
- 48 per cent had a substantiated allegation
- 31 per cent were placed in out-of-home care.
This may indicate greater exposure to and/or severity of DFV but more research is needed to determine the reason for this, including if it may be due to other co-occurring factors that may result in greater safety concerns for the children. In terms of practice and policy implications, the PATRICIA (Pathways and Research into Collaborative Inter-Agency practice) project has provided important findings and recommendations to improve collaborative work across the child protection and domestic violence interface (Humphreys & Healey, 2017). Included in these recommendations is the Safe & Together approach, which focuses on building alliances with mothers, supporting and validating children’s experiences and ensuring perpetrator accountability.
Strengths and limitations of population-level linked data
Population-level linked data is an important source of data to ascertain disability and exposure to DFV. It is more difficult from small samples and survey data to identify prevalence numbers across a range of geographical areas and subpopulations including those people with disability. This has been recognised by the Royal Commission into Violence, Abuse, Neglect and Exploitation of People with Disability, which has highlighted a major challenge that there is no nationally consistent data on neglect or exploitation experienced by people with disability, including important subgroups such as children with disability and First Nations children with disability (Commonwealth of Australia, 2020). While this research has provided an important source of data to enable an ascertainment of prevalence, a greater range of datasets needs to be utilised to enable full coverage both within and across jurisdictions. This would enable a national picture of theinteraction between disability and DFV experiences among children.
While the current data has its strengths, there are also limitations. As the datasets utilised are administrative, they do not contain all the information that enable a comprehensive examination of disability and DFV. As explained in the introduction regarding defining disability, there are a range of definitions that are utilised to understand this complex construct; however, these datasets predominantly rely upon medical definitions due to the data sources that utilise ICD codes, which are very narrow. Therefore, we cannot draw from children’s own disability identification, and whether they see themselves as having a disability, or the type of disability they identify with (and how). Our data is also limited by not being able to determine children’s level of functional impairment. While we can identify conditions and diagnoses, we cannot fully ascertain the impact of a condition on the individual child or young person. In addition, the data likelyonly captures children who experience severe symptoms of their conditions, such as chronic health conditions that would require hospitalisation (e.g. epilepsy and asthma).
In regard to DFV, it is important to establish prevalence using multiple data sources, including hospital morbidity, police and child protection data. However, this has limitations in that there are many mothers experiencing DFV who are not hospitalised for injuries or experience other types of violence besides physical abuse. In addition, many families who experience DFV will never contact police or come into contact with the child protection system. This likely limits the ascertainment of mothers in the hospital data to those who experience more severe physical DFV while reducing the ascertainment of those who suffer non-physical violence (Orr et al., 2022). A broader understanding of the experiences of women and mothers and the identification of children who are exposed to DFV is needed. Future research should also utilise a broader definition of DFV that captures a wider variety of relationships in family violence, particularly kinship networks forAboriginal and Torres Strait Islander peoples. There is also no detail in the datasets on the level, duration and extent of DFV exposure for children. This includes whether children directly witness the violence or are subject themselves to the violence, or the effects of the violence on them physically, emotionally or psychologically. This is where qualitative data is important to provide a more nuanced understanding of the level and impacts of exposure.
Another limitation is that we cannot examine the impact of current policy and practice on the prevalence of DFV exposure for children with disability due to the age of our datasets. Given the current Royal Commission into Violence, Abuse, Neglect and Exploitation of People with Disability and the ongoing implementation of recommendations and policy and practice efforts, it is imperative that rates of violence exposure, abuse and neglect are more routinely monitored for the effectiveness of these efforts. Additionally, given the data availability, there are varying lengths of time for children being in the study. The time children were followed depended on birth year and available records in data sources such as hospitalisations, mental health contacts, child protection and police. All information available was used, as described in the methods section, to ensure the greatest capture of disability conditions and DFV exposure to enable quantifying theextent of the issues. Future research should take this into account in assessing risk estimates.
In this research, while we have been able to ascertain the prevalence of children exposed to DFV, this does not provide further knowledge of why there is increased exposure for children with disability. Disability is not the cause of the violence. However, previous research has discussed the co-occurrence of other factors that may increase the risk of DFV exposure in children with disability (Sullivan & Knutson, 2000). This includes family-based risk factors, such as disadvantaged communities, parental factors (e.g. mental health issues) and substance use (Sullivan & Knutson, 2000). Some of these factors may also result in children being more likely to be at risk of having a disability such as fetal alcohol spectrum disorder or ADHD (Russell et al., 2016). It is also the case that exposure to DFV may result in a disability such as an assault that leads to a head or brain injury (Brain Injury Australia, 2018). Individual-level factors intersectwith systemic and structural disadvantage which disproportionately affects children with disability and their families, resulting in higher levels of poverty, greater barriers to education, discrimination and reduced access to necessary resources (Spencer et al., 2015).
Phase 1B:
Case file analysis – Methods
Data collection
Phase 1B of the “Connecting the dots” project uses a case file analytical framework (Witte, 2020) utilising a random sample of intake reports made to child protection from a metropolitan region within South Australia over a six-month period in 2016. This sample was obtained for an earlier study but is used again here with appropriate approvals from the data custodian and ethics committees (Octoman et al., 2022).
A report made to child protection is a concern reported to the statutory child protection department by any type of notifier alleging child abuse or neglect. This is the primary entry point for children into the child protection system and the intake report outlines the concerns regarding the child. Compared to the population-level administrative data that includes all children who are born in a state through Birth Registration and the MNS, the intake reports only concern children and families who come to the attention of the child protection system. As a result, this is a more limited sample of children and families who would be considered higher risk due to their contact with the child protection system.
The intake reports were created within a professional context to meet a range of professional and legal objectives and obligations. As such, they do not “provide a ‘transparent window on the world’” (Taylor, 2008, p. 26). They are not first-person or unbiased accounts of children’s experiences, of disabilities or of DFV. The reports are only one element of administrative data held by the department and do not constitute the entirety of the data held by a jurisdiction on the child or family concerned. However, reports made by notifiers can be utilised to form a picture of concerns raised about the abuse and neglect of children over the course of their childhood. Details about children’s exposure to DFV are reported to child protection from a range of notifiers, including police who attend such matters.
Data utilised in this study was collected as a part of a broader study (Arney et al., 2018; Octoman et al., 2021) which took a first principles approach to better understand the concerns being raised to the statutory child protection department about families. Data was collected and deidentified, with the names of all family members replaced with pseudonyms as a part of this broader study. Data included child protection administrative data, including fixed-field administrative data and intake reports extracted from the electronic case management system.
Unit-record fixed-field administrative data were extracted by the Department for Child Protection for all concerns reported to child protection for children in the families. The most recent intake report that occurred prior to the end of 2016 was identified and extracted from the electronic case management system for each child in the family known to child protection with a report on the electronic filing system. Reports were included in the analysis regardless of the outcome or response to the report, and therefore the data includes both reports that were screened “in” for child protection response and reports screened “out”. Intake reports include narrative detail about the current concern reported to child protection as well as a brief summary of previous concerns reported to the child protection department. All intake reports were deidentified prior to analysis.
Ethics approval
Ethical approval was obtained from the Aboriginal Health Research Ethics Committee and the University of South Australia Human Research Ethics Committee.
Sample
The broader research study utilised a 20 per cent random sample (n=324) of children reported to child protection in a metropolitan region of South Australia made between 1 July and 31 December 2016. Family groups were identified using sibling information extracted from the electronic management system. All biological or legally related siblings of the 324 children in the random sample were identified and formed 280 families.
In total, the sample represents approximately 1,063 children. Drawing on existing data preparation and coding from the broader study and initial familiarisation with the data, 62 of the 280 families were identified as having a child with disability who was reported to child protection between July and December 2016 (referred to as an “index CWD”; see Figure 11).
Figure 11: Flow diagram of sample inclusion
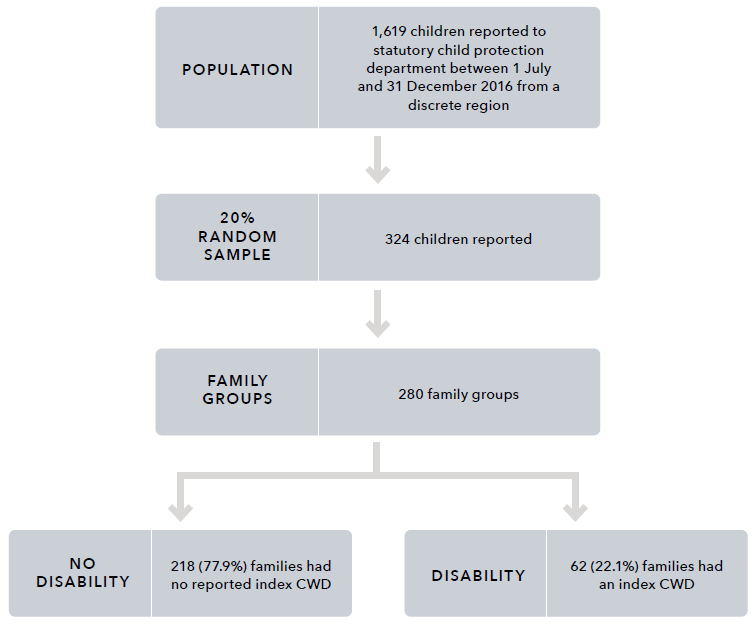
Text alternative for the figure above:
Population: 1,619 children reported to statutory child protection department between 1 July and 31 December 2016 from a discrete region.
- 20% random sample: 324 children reported
-
- Family groups: 280 family groups
-
- No disability: 218 (77.9%) families had no reported index CWD
- Disability: 62 (22.1%) families had an index CWD
Measures
For each of the 62 families with a child with disability, information about disability and DFV were coded from the narrative details contained in the intake reports. Definitions of the categories of disability and DFV utilised in the case file analysis are detailed below.
Disability categories for case file analysis
Following Phase 1A of this research, to construct disability categories we have used the NDIS categories (outlined in Appendix A) and additional categories of mental health disorders and chronic health conditions that align with the Disability Discrimination Act 1992 (Cth) – cystic fibrosis, epilepsy, asthma and diabetes. However, due to descriptive limitations in the data and the reliance on one data source, the distilled categories used by Phase 1B are necessarily broad in order to capture disability types. The disability categories used by the Phase 1B study are:
- ASD
- developmental delay
- intellectual disability
- physical disability
- speech and language delay
- chronic health conditions.
Definition of domestic and family violence used for case file analysis
This study uses the following definition of DFV, as outlined in the National Plan to Reduce Violence against Women and their Children 2010–2022:
acts of violence that occur between people who have, or have had, an intimate relationship. While there is no single definition, the central element of domestic violence is an ongoing pattern of behaviour aimed at controlling a partner through fear, for example, by using behaviour which is violent and threatening. In most cases, violent behaviour is part of a range of tactics to exercise power and control over women and their children, and can be both criminal and non-criminal. Domestic violence includes physical, sexual, emotional and psychological abuse. (COAG, 2011, p. 2)
In this study, any DFV was captured where there was specific mention of violence against a parent or caregiver of the child with disability. This includes DFV that was reported at the time of the report or that was included in the history of reporting to child protection. Detail about the presence of DFV and any exposure to DFV was coded from the narrative detail contained in the intake reports. Exposure to DFV is a multidimensional concept that incorporates a range of experiences, including witnessing or hearing violence first-hand; living with the aftermath of DFV, including witnessing injuries or being displaced from their homes; having prenatal exposure to DFV; intervening in the DFV (e.g. asking a parent to stop or defending a parent); and hearing about the DFV after it occurred (Holden, 2003).
Procedure
Utilising previous coding (Arney et al., 2018), families that included any child with a health condition or physical disability, or a learning delay or intellectual disability, were identified. Disability information for children was cross-checked with the fixed-field administrative data file that contains all reports for the family, and only families that had a child with disability who were known to child protection between July and December 2016 were included for further examination.
With reference to family genograms, the intake reports were coded utilising the qualitative data analysis program NVivo by two independent researchers. For each family, the nature of the disability and the nature of DFV recorded in the family intake reports were coded. Any specific mention in the intake reports about the interface between DFV and the disability was thematically coded.
Inter-rater reliability was then conducted for all cases by running a coding comparison query in NVivo, using coding stripes and a coding comparison query. Inter-rater reliability focused on whether there was agreement about the nature of the child’s disability, the number of children with disability in a family, the presence of DFV, and the presence of a theme relating to DFV and disability in the narrative of the intake report. The two researchers worked together to bring the codes into agreement.
Analysis
In its analysis, this study uses a case file analysis framework (Witte, 2020) to explore exposure of children with disability to DFV. Following coding and agreement, a quantitative analysis of the extent of children with disability exposed to DFV was conducted. Information about the type of disability recorded for each child and family, and the number of children with disability in the family, was recorded and analysed in SPSS v25. Families for whom there was a theme relating to DFV and disability were then categorised to represent themes identified from the data. These themes are presented and contain deidentified illustrative or cumulative case studies using case study methodology designed to anonymise the data while presenting as true a picture as possible.
Findings:
Phase 1B case file analysis
Extent of children with disability exposed to DFV
Of the 62 families that included an index child with disability that was reported to child protection between July and December 2016, 45 family groups also included DFV (see Figure 12). This represents 16.1 per cent of the total sample of family groups (n=280). The remaining 17 family groups included a child with disability where no DFV was recorded in the child protection intake reports.
Figure 12: Number of families where index children with disability were exposed to DFV
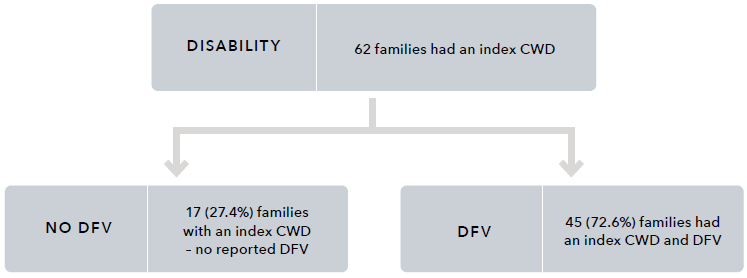
Text alternative for the figure above:
Disability: 62 families had an index CWD
- No DFV: 17 (27.4%) families with an index CWD – no reported DFV
- DFV: 45 (72.6%) families had an index CWD and DFV
Two hundred and eighteen families from the random sample of families (n=280) did not include an index child with disability. For these families (Figure 12), 73.9 per cent were exposed to DFV (see Table 12).
Table 12: The number and proportion of families with index CWD and no index CWD who have DFV recorded in the intake reports for the broader sample
Family
No DFV recorded in child protection intake reports
DFV recorded in the intake reports
Total
Index CWD
17 (27%)
45 (73%)
62 (100%)
No index CWD
57 (26%)
161 (74%)
218 (100%)
Total
74 (26%)
206 (74%)
280 (100%)
Nature of child disability
Across the 62 families, there were a total of 96 children with disability. This included 69 children with disability in the families, with at least one index child with disability and DFV (median = 1 child, range = 1–6), and 27 children with disability in the families with no DFV reported (median = 1 child, range = 1–3). Of the 96 index children with disability, 32.3 per cent (n=31) were identified to be living with more than one disability. The proportion of each type of disability identified for each family and for the child are detailed in Table 13.
For all children and families, developmental delay and ASD were the most commonly identified disabilities. For children reported to have a developmental delay (n=40, 41.7%), 12 (30%) were also recorded to have a speech and language delay. Speech and language delay was identified without mention of a developmental delay for a total of nine children.
In many cases, families had a number of children in the family with co-occurring disabilities. Of families with an index child with disability and DFV, 33.3 per cent had more than one child with disability, ranging between one and six children with disability in the family.
For index children with disability, 36.2 per cent of children exposed to DFV were identified to be living with more than one disability (median=1 disability, range=1–5), and for children with disability not recorded to have been exposed to DFV, 22 per cent were living with multiple disabilities (median=1, range=1–4).
Table 13: Proportion of family groups and index children with DFV, with no DFV, and total that included at least one child with any of the types of disability
Families
Autism spectrum disorder (ASD)
Families with DFV and index CWD
(n=45)
N
Families with DFV and index CWD
(n=45)
%
Families with an index CWD no DFV (n=17)
N
Families with an index CWD no DFV (n=17)
%
All families with an index CWD (n=62)
N
All families with an index CWD (n=62)
%
ASD
18
40.0
8
47.1
26
41.9
No recorded ASD
27
60.0
9
52.9
36
58.1
Chronic health condition
Families with DFV and index CWD
(n=45)
N
Families with DFV and index CWD
(n=45)
%
Families with an index CWD no DFV (n=17)
N
Families with an index CWD no DFV (n=17)
%
All families with an index CWD (n=62)
N
All families with an index CWD (n=62)
%
Chronic health condition
15
33.3
4
23.5
19
30.6
No recorded chronic health condition
30
66.7
13
76.5
43
69.4
Physical disability
Families with DFV and index CWD
(n=45)
N
Families with DFV and index CWD
(n=45)
%
Families with an index CWD no DFV (n=17)
N
Families with an index CWD no DFV (n=17)
%
All families with an index CWD (n=62)
N
All families with an index CWD (n=62)
%
Physical disability
7
15.6
0
0.0
7
11.3
No recorded physical disability
38
84.4
17
100.0
55
88.7
Intellectual disability
Families with DFV and index CWD
(n=45)
N
Families with DFV and index CWD
(n=45)
%
Families with an index CWD no DFV (n=17)
N
Families with an index CWD no DFV (n=17)
%
All families with an index CWD (n=62)
N
All families with an index CWD (n=62)
%
Intellectual disability
12
26.7
3
17.6
15
24.2
No recorded intellectual disability
33
73.3
14
82.4
47
75.8
Developmental delay
Families with DFV and index CWD
(n=45)
Families with an index CWD no DFV (n=17)
All families with an index CWD (n=62)
Index CWD exposed to DFV (n=69)
Index CWD no DFV (n=27)
Total index CWD (n=96)
Developmental delay
18
40.0
7
41.2
25
40.3
No recorded developmental delay
27
60.0
10
58.8
37
59.7
Speech and language delay
Families with DFV and index CWD
(n=45)
Families with an index CWD no DFV (n=17)
All families with an index CWD (n=62)
Index CWD exposed to DFV (n=69)
Index CWD no DFV (n=27)
Total index CWD (n=96)
Speech and language delay
13
28.9
4
23.5
17
27.4
No recorded speech or language delay
32
71.1
13
76.5
45
72.6
Index children
Autism spectrum disorder (ASD)
Index CWD exposed to DFV (n=62)
N
Index CWD exposed to DFV (n=62)
%
Index CWD no DFV (n=27)
N
Index CWD no DFV (n=27)
%
Total index CWD (n=96)
N
Total index CWD (n=96)
%
ASD
22
31.9
13
48.1
35
36.5
No recorded ASD
47
68.1
14
51.9
61
63.5
Chronic health condition
Index CWD exposed to DFV (n=62)
N
Index CWD exposed to DFV (n=62)
%
Index CWD no DFV (n=27)
N
Index CWD no DFV (n=27)
%
Total index CWD (n=96)
N
Total index CWD (n=96)
%
Chronic health condition
15
21.7
4
14.8
19
19.8
No recorded chronic health condition
54
78.3
23
85.2
77
80.2
Physical disability
Index CWD exposed to DFV (n=62)
N
Index CWD exposed to DFV (n=62)
%
Index CWD no DFV (n=27)
N
Index CWD no DFV (n=27)
%
Total index CWD (n=96)
N
Total index CWD (n=96)
%
Physical disability
8
11.6
0
0.0
8
8.3
No recorded physical disability
61
88.4
27
100.0
88
91.7
Intellectual disability
Index CWD exposed to DFV (n=62)
N
Index CWD exposed to DFV (n=62)
%
Index CWD no DFV (n=27)
N
Index CWD no DFV (n=27)
%
Total index CWD (n=96)
N
Total index CWD (n=96)
%
Intellectual disability
15
21.7
4
14.8
19
19.8
No recorded intellectual disability
54
78.3
23
85.2
77
80.2
Developmental delay
Index CWD exposed to DFV (n=62)
N
Index CWD exposed to DFV (n=62)
%
Index CWD no DFV (n=27)
N
Index CWD no DFV (n=27)
%
Total index CWD (n=96)
N
Total index CWD (n=96)
%
Developmental delay
31
44.9
9
33.3
40
41.7
No recorded developmental delay
38
55.1
18
66.7
56
58.3
Speech and language delay
Index CWD exposed to DFV (n=62)
N
Index CWD exposed to DFV (n=62)
%
Index CWD no DFV (n=27)
N
Index CWD no DFV (n=27)
%
Total index CWD (n=96)
N
Total index CWD (n=96)
%
Speech and language delay
15
21.7
6
22.2
21
21.9
No recorded speech or language delay
54
78.3
21
77.8
75
78.1
Nature of domestic and family violence
The 45 families with a child with disability who were reported to child protection in the region between July and December 2016 and also had DFV recorded make up 16.1 per cent of all 280 families, and 72.6 per cent of families with a child with disability. The information contained in the intake reports was varied in nature, and detail about DFV included a range of verbal, emotional and psychological abuse and physical violence.
The DFV recorded for these families was varied. For some families, there was limited information about the specific violence within the family. For example, reports contained detail about the presence of DFV between parents of the child with disability. For other families, reports highlighted that there were frequent DFV incidents in the household or concerns about the father’s violence towards the mother throughout the relationship.
For many families, the DFV was chronic. For one family in the sample, a summary of previous information reported to child protection documented 13 years of chronic DFV. Another family, who had previous reports about DFV occurring in 2014, also had a current report in 2016 about exposure to DFV. For other families, the violence was noted in the report as having occurred historically, with the violence either no longer being present or not reported to child protection during the study period. For example, one family’s report noted a child protection history for the family which included “DV [domestic violence] between the parents”, however there was no other mention of DFV in the reports.
Child protection reports included details about physical violence, including physical assault between intimate partners. The perpetrators of violence in the reports were usually the children’s fathers or stepfathers, or the mother’s partner. Examples from the intake reports included hitting, punching, choking, arm-twisting, and attacking with knives and bottles. There were reports of the physical injuries sustained by women perpetrated by their partners and the other effects of such violence, including mental health impacts and alcohol or drug use. Reports for these families also contained concerns about threats to harm or kill the other intimate partner, and details about verbal abuse, property damage and the presence and breaches of intervention orders.
Complexity of family context
The intake reports included detail of often complex experiences of DFV that intersected with other risk factors (e.g. use of alcohol and other drugs, unmanaged/unsupported mental health issues and criminal behaviour) and indicators of abuse and neglect of children, including emotional abuse and sexual abuse. While no detailed assessment of these factors was conducted as part of this study, the complex contexts of child abuse and neglect have been documented in other research conducted with this sample and other child protection samples (Arney et al., 2018; Meiksans, Arney et al., 2021; Meiksans, McDougall et al., 2021; Octoman et al., 2021). The complexity among families may be heightened by the intersection with disability, as is described below. Similarly, the complexity within families may also serve to increase the likelihood of disability – for example, experiences of abuse and neglect in childhood and contemporaneous exposure to domesticviolence have been identified as risk factors for alcohol consumption during pregnancy (Frankenberger et al., 2015; McQuire et al., 2020), which contributes to fetal alcohol spectrum disorders. While it was not possible to draw a causal relationship between DFV and disability in the sample described here, the relationship between disability and exposure to violence has been documented elsewhere (Litrownik et al., 2003; Sullivan & Knutson, 2000).
Further, the complexity within families may compound experiences of neglect (e.g. the association between chronic alcohol and other drug use and neglect, which may be greater among children with disability, who have higher needs). This created family environments in which children with disability experienced neglect, physical abuse, exposure to substance use and the impact of unsupported parental mental health problems.
In conjunction with DFV, multiple risk factors resulting in unsafe home environments or adverse outcomes for children with disability were common across the sample. For example, one child with chronic health issues, who lived with their mother and siblings, was exposed to risk factors and neglect, as well as to chronic DFV. The family home was reported to be unhygienic and unsafe, with pest infestation, decaying food and hazardous items accessible to the children. The mother also had substance use issues and custody disputes with the father of one of the children, and struggled to cope with financial instability. The report also included concerns that a child with chronic health issues had not been provided medication, impacting their health outcomes.
DFV was also reported to be precipitated by substance use. For example, in one family group, the mother reported using substances as a way of coping with the DFV she was experiencing. This resulted in a range of additional risk factors for the two children with ASD, developmental delays, and speech and language delays in the family group. These risk factors included maternal drug use during pregnancy; the mother feeling unable to care for the children, engage with DFV services, or prioritise the children’s safety; and the mother experiencing mental health issues associated with her drug use.
Domestic and family violence and disability
Twenty-one of the 45 family groups experiencing DFV and including a child with disability were identified as containing one or more examples of the themes relating to DFV and disability. The remaining 24 families that included a child with disability and DFV contained information recorded in the intake reports about the presence of DFV and the presence of a child with disability in the family, but did not contain any specific detail about the exposure of DFV for the child with disability. These links were categorised thematically. The thematic categories relating to DFV and disability are now described in turn.
Theme 1: Child with disability experienced trauma as a result of DFV (n=17)
For 17 families, reports contained some information about children with disability showing signs of trauma, described as being scared, distressed, anxious, or having behaviour problems, in response to DFV that they had been exposed to. While children being unfazed by DFV is also an indicator of concern, this was generally not captured in the intake reports.
For eight families, child protection reports contained descriptive detail about the child with disability being “scared” or feeling “unsafe” in response to DFV. For example, one family that included two children with ASD and their siblings were described as being scared after witnessing their father being assaulted by his male partner and threatening to kill himself. For another family, a child with chronic health issues witnessed their mother being violently assaulted by her partner. The child was concerned that their mother had died and was reported as shaken and pale. One family group specifically identified that the children were feeling unsafe in their environment. For example, in one family that included two children with developmental delays, intellectual disabilities, and speech and language delays, the children were reported as feeling unsafe in response to the DFV in their home environment.
For four families there were reports that children with disability were distressed in response to DFV. For example, in one family with two children with disability (including ASD, intellectual disability, developmental delay, and speech and language delay), the children witnessed their father verbally abusing their mother, and threatening to have the children placed in foster care. These threats were reported to be persistent and escalating, causing distress to the children. In another family group, a psychological assessment had been undertaken on a child with speech and language delay, which found the child to be acutely traumatised by the DFV in their family. A child with a speech and language delay was reported as feeling anxious in a family group where the DFV had become physical abuse of the child. In another family group, which included a child with ASD, the child was reported to be distressed and crying in an environment where the DFVhad also translated into physical abuse of the child.
For four families, reports contained information about children’s responses to their exposure to DFV, which included behavioural concerns or responses. For example, in one family with multiple children with disabilities, information about the children’s distress was described following a DFV incident in which the parents were arguing in front of the children, during which the mother threatened to cut her wrists with a knife and yelled comments at the children. During this incident, one of the children had packed their bags, wanting to leave home. In another family, a child with developmental delay was reported as being distressed after witnessing a verbal argument between their father and mother. In this family, concerns were documented in the report about the children’s exposure to DFV causing behavioural issues. In another family group, a child with ASD and a speech and language delay was living in an environment of chronic DFV. In thisfamily group, the children were reported to be locking themselves together in one room, occasionally leaving the room for food. The children were reported to be frightened of their father and were themselves displaying aggressive behaviours.
For one family group, the report explicitly detailed that the child had significant development delays experienced as a possible result of the highly violent environment in which they had lived for the first four years of their life. As a result of the limited contextual and historical information available, it was not possible to reveal further detail about this finding nor about the possibility that other children experienced disabilities as a result of DFV.
Theme 2: The perpetrator of the DFV also directed violence towards children with disability (n=7)
For seven of the family groups, the perpetrator of the DFV also perpetrated violence (physical abuse) toward the child with disability. In some family groups, these children were also reported to use violence themselves. Information on the violence used by children was not highly descriptive, though children were variously described as fighting with each other (within their sibling group) and being “very violent”.
Children with disability were both exposed to DFV and were the subject of violence themselves in these families. For example, a child with ASD and a speech and language delay was living in an environment of chronic DFV, in which the father had begun to hit the child when they made mistakes in their homework. In another family with a child with ASD, the child and their siblings would return with bruises after fortnightly access visits to a father who had been a perpetrator of DFV. The child with ASD reported that their father had punched and pushed them.
In one family group with two children with developmental delays, the children witnessed ongoing violence, including during custody handovers. Concerns were raised in the intake report about the father’s aggression and violence also being directed towards the children, potentially causing behavioural issues, with one of these children described as being very violent.
For at least two of these families, the disability precipitated the physical abuse. For one child with a chronic health condition, aggression and abuse were directed toward the child regarding the monitoring and management of their condition. The father in a second family had begun to direct his violence toward a child with ASD when the child wouldn’t stop crying, in an apparent attempt to control the child’s behaviour.
Theme 3: Violence negatively impacted service access for children with disability (n=3)
This study found that children with disability also experienced challenges in receiving support from services because of the DFV in their families. The reports identified that three family groups in this study experienced an impact on access to services. For example, worker safety issues were raised by notifiers as factors that could or were already impacting the provision of home-based support, including one disability service and one parenting support service. A child with disability in the third family group was deemed unable to be referred to a mental health service, despite concerns about self-harm and suicidal ideation, due to the presence of violence in the family.
Theme 4: Intervention order breaches occurred (n=2)
For two family groups in this study, the reports contained details of breaches of no-contact intervention orders where the child with disability had contact with a parent/caregiver that was the defendant. Breaches of intervention orders heightened the risk of exposure of children with disability to violent parents.
In one family group, in contravention of a no-contact intervention order, the parent/caregiver allowed the children to have contact with the other parent/caregiver due to mental health concerns and the lack of support in managing as a single parent of a child with ASD, intellectual disability and challenging behaviour. In the second family group, concerns related to a child with ASD and developmental delay catching public transport on their own to visit the other parent, against whom there was an intervention order in which the child was a protected person.
Theme 5: Disabilities of children presented added complexity to escaping DFV (n=2)
For two family groups in this study, the disabilities of the children presented an added complexity to escaping DFV.
In one family group, which included a child with ASD, the mother had to decline alternative housing due to its lack of suitability for the safety of her child and the children’s behaviour support needs (it was a double-storey property). The second family group were living in a house owned by the paternal grandparents, though the mother and father were separated. This presented complications for the DFV situation, as the father gained access to the home and continued to perpetrate violent behaviour toward the mother and children, despite him officially residing at a different address. The ongoing presence of violence in the home has resulted in this family being one that services will not visit due to worker safety issues. Both families were working with a disability service to gain suitable housing; however, the service with which the second family is working will not visit due to DFV.
Discussion: Phase 1B – Case file analysis
Children with disability are over-represented in the present sample of children and their families when compared to families with children with disability in the Australian population. As with Phase 1A, this higher prevalence is consistent with previous research that has found children with disability have a higher risk of exposure to violence and child protection involvement compared to their non-disabled peers (Jones et al., 2012; Maclean et al., 2017). The present study identified that of the 280 South Australian families known to child protection, 22 per cent included at least one index child with disability. Previous statistics highlight that in 2003, 13 per cent of families in Australia were identified as including a child with disability (ABS, 2008a). There is, however, limited information in the literature as to why this over-representation might occur.
The violence in the families in this study included verbal, emotional and psychological abuse, and physical violence. For many families, the violence was chronic. For other families, the violence was historical, with the violence no longer occurring due to the removal of a violent partner from the life of the family. For some families, the violence was occurring in the context of other complex risk factors (e.g. use of alcohol and other drugs, unmanaged/unsupported mental health issues and criminal behaviour) and indicators of abuse and neglect of children, including emotional abuse and sexual abuse. Consistent with other qualitative studies of child protection records, the information provided in the intake reports, particularly regarding historical violence, often lacked specific detail (Meiksans, McDougall et al., 2021).
Five themes relating to DFV and disability were identified in the narratives of the intake reports for 21 of the families included in this study. These included two themes related to the impact of violence on the children, including the traumatisation of children as a result of witnessing DFV and exposure of children with disability to violent parents through intervention order breaches. A further two themes described how children’s disability impacted access to needed services and support. Finally, one theme related to the presence of additional risk factors, including violence directed towards the children with disability (physical abuse).
The findings of this study are now discussed with regard to the exposure of children with disability to DFV; the complexity of the contexts of DFV in this sample; and the obstacles to services and supports for children with disability and their families. Limitations of the study are also discussed, together with directions for future research and implications and recommendations for policy and practice.
The exposure of children with disability to DFV
The findings of this study indicate that in families known to child protection, children with disability are exposed to family violence at similar levels as families that have not been recorded as including an index child with disability. Of the 62 families in this study that included children with disability, the majority (72.6%) were exposed to DFV. For the 218 families that did not include an index child with disability, 73.9 per cent were exposed to DFV.
Within the present child protection sample, families who include an index child with disability and families who are not recorded to include an index child with disability have similar proportions of violence. This exposure to DFV is similar to the presence of domestic violence identified for child protection samples in the broader sample and in previous research. The whole sample of 280 families known to child protection identified that almost three quarters of families had DFV recorded in their child protection reports (Arney et al., 2018). Another study of a sample of prenatal child protection reports from a single Australian jurisdiction in 2014 found that 70 per cent had reports to child protection in the prenatal period, which included concerns about current or previous intimate partner violence (Meiksans, McDougall et al., 2021). While children with disability are significantly more likely than children without disability to be exposed toviolence (Australian Institute of Health and Welfare, 2020; Jones et al., 2012; Robinson et al., 2020), the similar proportions described by the present child protection sample may be due to insufficient detail about children with disability within the intake reports.
The reports analysed in this study revealed a picture of families in which the children were described as being scared, distressed or anxious as a result of the DFV that they had witnessed. Children were variously reported to be acutely traumatised, displaying behavioural problems associated with DFV, unable to seek comfort from violent parents, visibly crying and distressed, and expressing fear of or worry about their parents. While not all children with disability are at increased risk from DFV, there are additional or prolonged risks for children with disability apparent in this study, making clear that both children and their parents are not well supported by services. For example, within the sample, children were exposed to violent parents in breach of intervention orders. In one family, this contact took place in order to manage both the child’s “behaviours” and the mental health of the protected parent.
In the present sample, the explicit link between chronic DFV exposure and developmental delay in early childhood was recorded by only one notifier for one family. Despite this, it is possible that for many children in this study, the timing, chronicity and severity of violence exposure, and exposure to other types of child abuse and neglect, was the cause of, or related to, at least some of the disabilities of the index children with disability. Previous research has reported that chronic exposure to, or experience of, DFV is associated with impaired cognitive functioning, behavioural problems, learning difficulties, trauma and poor mental wellbeing (Campo, 2015; Jaffe et al., 2012; Kerns et al., 2015; Margolin & Vickerman, 2011). The complexity within families identified in this study, and identified in previous research, also suggests that exposure to DFV often co-occurs with other types of risk or abuse and neglect within families (Bromfield etal., 2010; Meiksans, Arney et al., 2021). Without support, the impact of exposure to DFV and other risks can have a long-lasting effect on children.
There is a need for children’s disability and mental health services to collaborate and to understand the aetiology in the symptoms that children with disability display. Research highlights that some of the symptomatology may be related to experiences of trauma, including exposure to DFV (Kerns et al., 2015), which may exacerbate or mirror the symptoms of the disability. It should be ensured that therapeutic supports are offered that are accessible, affordable and responsive to the experiences of children with disability who are exposed to DFV.
The complexity of DFV contexts
In many families, home life was chaotic, with violence being one part of this picture. While 45 family groups in this study included DFV, other factors that negatively impacted the children with disability in the family were also present. Studies reporting on detrimental and long-lasting effects of DFV for children have highlighted that DFV tends to be experienced in families where other risk factors and indicators of abuse and neglect are also present (Moore et al., 2020). In the present study, these included parental substance use, physical abuse of the children, neglect (including medical neglect), other emotional abuse, sexual abuse, and mental health issues for both children and parents. Previous analysis of the sample of 280 families reported to child protection identified that three quarters of families had DFV identified in the intake reports, over half of families had alcohol or other drug use or mental health concerns identified, and over 40per cent had parental criminal behaviour identified (Arney et al., 2018). Research undertaken by Maclean and colleagues (2017) also identified that for children and young people with disability, socio-economic disadvantage, maternal mental health, teenage parents and substance use admissions were risk factors for maltreatment.
DFV is itself complex, and this complexity is compounded by its interaction with other adversities experienced by families. Disability, though not itself a risk factor, may be associated with an increased impact or risk for children with disability if support services and resources are not available to families, appropriate to their needs, or engaged with them. In conjunction with DFV, multiple risk factors resulting in dangerous home environments or adverse outcomes for children with disability were common across the sample.
Obstacles to services and supports for children with disability and their families
Children with disability who are experiencing DFV and are known to the child protection system are often in contact with multiple systems and support services. A constellation of service systems can come into play to support children in this situation, including child protection systems and DFV and disability services, including the NDIS and therapeutic or targeted services. However, some children in this study experienced barriers to accessing disability and DFV services and other support services. Two obstacles to accessing services were identified as especially important.
As previously described, immediate safety concerns relating to the DFV were an obstacle. For example, families experienced barriers to accessing services (a disability service and a parenting support service) because of worker safety issues. At the same time, one child could not access a mental health service due to the current violence in the family, which made the child ineligible for the service. While worker safety is a key concern in responding to critical incidents, lack of support compounds problems for children and families. One study highlights multidisciplinary teams as a possible way of managing safety without compromising needed service provision (Humphreys et al., 2020).
The second obstacle was the absence of suitable accommodation for women with children with disability experiencing DFV. Two women in the study were unable to escape DFV due to the difficulties of finding suitable accommodation that would meet the needs of their children. While both families were in the process of working with a disability service to gain suitable housing, previous studies have identified the lack of mainstream understanding of housing requirements for people with disability (Dyson et al., 2017; Thiara et al., 2011). Several studies have highlighted the barriers faced by women with disability in escaping DFV. These obstacles are further compounded when there are children with disability, ranging from inappropriate services or interventions to social constructions and understandings of disabilities (Nixon, 2009; Thiara et al., 2011; Women with Disabilities Australia, 2007).
Obstacles such as ongoing violence in the family and the lack of suitable accommodation fail to make use of existing policy and practice (particularly through the NDIS), and to support both children and families more proactively to respond to the gaps in parenting support for children with additional support needs, particularly in high-intensity areas such as behaviour support.
These findings broadly support the service recommendations of previous studies of both children with disability and women with disability and the obstacles to accessing services and supports, including DFV services and disability services (COAG, 2011; Robinson, Frawley et al., 2021). These studies suggest that services must be well-resourced, collaborative, wraparound supports with continuity of care if they are to provide disability support and to address child protection risk reduction and family violence (Corr & Milagros Santos, 2017; Dyson et al., 2017; MacLean et al., 2017; McDonald & Rosier, 2011; Robinson, valentine et al., 2021). A learning from this study is that, while appropriate services might be available, these supports should neither be impossible to deliver during critical incidents nor only be made available during such times. Instead, a service response that can be both preventative and responsive to the multiple factorsthat families might live with and encounter is needed.
Strengths and limitations of case file analysis
The challenge for defining disabilities in the context of the child protection intake reports is the limited or subjective information about disabilities contained therein. These reports don’t tend to capture information on the functional capacities of children with disability, whether they have received a diagnosis, how they would describe their disability, how they experience or are impacted by the disability they may have been born with or acquire, and indeed, whether the information provided is correct.
Therefore, due to the descriptive limitations in the data, the disability categories used in this study were necessarily broad in order to capture disability types about which limited information was provided. In addition, chronic health conditions that are not included in the NDIS categories were included, such as cystic fibrosis, epilepsy, asthma, and diabetes. This additional category was included following discussion with our advisory group and a review of the literature because, if these conditions are unmanaged, they would impact on individuals’ functional capacity. The disability categories used by the Phase 1B study were:
- ASD
- developmental delay
- intellectual disability
- physical disability
- speech and language delay
- chronic health conditions.
A key strength of the case file analysis is that it utilised narrative detail contained in child protection reports to understand the nature and extent of disability and DFV that children with disability in families known to the child protection system were exposed to. Child protection reports provide rich narrative information about the concerns reported to child protection from notifiers. This study used and synthesised the information provided across the life of the family for each child within the family to provide a narrative about child protection concerns, including DFV exposure, over childhood. While this provides a rich summary of information, the order of events could not always be established, and therefore the timing of the emergence of disability and DFV could not be specifically explored in this study.
A limitation of such administrative data is that it is collected as a part of the day-to-day operation of the child protection department to support service delivery and for recordkeeping purposes (Woollard, 2014). These datasets are not collected for research purposes and the nature of and existence of disability identified in the reports is largely reliant on the information known and reported by the notifier. The notifier may not be aware of any assessment or diagnostic information regarding children nor all details about the family context. Further, the study used only the most recent child protection reports for each family. While these reports contain very brief summaries of previous reports, it’s possible that for all 280 families in the sample, information about children’s disability or the extent and nature of DFV within the family is not contained in these more recent reports. Thus, a limitation of this study is that only informationcontained in the most recent report narratives could be coded; information about disability or domestic violence that is not contained in the reports is therefore unknown and could not be included in this study.
This study utilised a child protection-specific sample, where all families were known to the child protection system. Therefore, consideration of the findings needs to be interpreted based on this type of sample. Children and families included in this sample may have had varied involvement with child protection, including previous reports, investigations, or experiences in out-of-home care. It is possible that there may be more monitoring or surveillance for families known to child protection because of the other services involved in the family. Having more services involved may increase the reporting or information and concerns known to child protection; however, it does not invalidate these reports made to child protection. This sample also only included a small sample of families who represent a discrete metropolitan region of a single Australian jurisdiction.
A further limitation is that for some families, the direct exposure to DFV of children with disability was not clear in the intake reports. Some reports directly stated that the children witnessed incidents of violence or were exposed to the violence; however, not all cases had the details of the level of exposure for the index children with disability.
Directions for future research
The complexity of the pathways for children with disability and their exposure to DFV is difficult to elucidate and requires mixed-method research to provide a more comprehensive understanding to determine risk reduction and prevention strategies. Including the voices of children with disability and their families is key to ensuring this comprehensive understanding of how we can support families in the reduction and prevention of domestic violence but also the support that families require in the provision of safety and support interventions.
This research was conducted using a select sample of children and families in one jurisdiction. Future research should explore the utilility of technology to conduct population-level analysis, or alternatively utilise a consistent and regular collection and analysis for a larger sample of families to understand children with disability’s exposure to DFV. Given the high level of involvement of children with disability in child protection and the high level of DFV, there is a need to examine whether services have the resources and skills to meet the needs of children with disability and their families. Examination of multidisciplinary wraparound responses to ensure that the needs of the children with disability and the needs of their parents/caregivers and other family members are also met is required. The qualitative component of this program of research is essential to identify the barriers and enablers for access to services specifically for familieswith children with disability and to capture the experience of DFV for children with disability.
The research identified descriptive limitations in the data that restricted the understanding of the data in Phase 1B. While there is increasing recognition of the integral role quality recordkeeping plays in child safety and wellbeing (Eberhard, 2015; Evans et al., 2020; Ogle et al., 2022; Reed et al., 2018), the challenges of quality child-centred case recording among child protection practitioners, particularly concerning children with disability, remain opaque and require further research.
Additional implications and recommendations for policy and practice
This study provides evidence of the need to better identify the prevalence of DFV and disability in routine data collection and the opportunities to make better use of administrative data. It found an over-representation of families of children with disability within the child protection reports. This is consistent with previous research (Jones et al., 2012; Maclean et al., 2017). However, for those families reported to child protection, families with and without a child with disability had similar proportions of exposure to DFV.
There is a need to consider in policy and practice how to better support children with disability and their parents/caregivers, noting that any policy and practice changes necessarily include ongoing, accessible consultation with children with disability and their families and advocates, as well as ongoing evaluation. Within this study, children were identified as being scared or distressed in response to their exposure to violence. Some cases indicated that children were highly traumatised as a result of the violence they witnessed with concerns regarding the impact on their development, behaviour, cognition, and wellbeing. Access to services and supports to ensure children with disability feel safe and supported is vital. Support for parents and caregivers is also an important consideration. Parents and caregivers need access to resources, services and supports to enable appropriate and safe housing for families and mental health supports that meetthe needs of families with children with disability. Other specific implications for policy and practice are as follows:
- DFV is often one factor within a complex context of child abuse and neglect. This complexity presents a compounding picture of risk for children with disability. A disability, child protection and DFV service response that is both preventative and responsive to the multiple factors that families might live with and encounter is needed.
- It is important that exclusion or ineligibility from a service does not prevent families from receiving the support that they need. For example, if a disability service cannot work with a child until safety concerns are addressed, then alternative sources of this support are needed. Families with multiple support needs often require specialised support and time to build trust with staff, especially if child protection agencies are involved or families fear their involvement.
- The significance of first-response services such as hospitals and police was evident. Ensuring these practitioners are well-skilled in meeting the needs of families and children with disability is essential, particularly given the high proportion of children with disability in families experiencing violence that use these services.
- The provision of suitable alternative accommodation for women with children with disability who are experiencing DFV is needed, as is ensuring improved knowledge and skills in addressing housing requirements for people with disability. There should be provision of appropriate services and support to ensure children can remain in the home when it is safe to do so.
- Workforce development is also important. Training and resources are needed across sectors to improve support for, and knowledge of, the additional needs of children with disability and their families. Consideration needs to be given to supports for children to address development and wellbeing, as well as parents who may require support to attend mental health and/or substance use services.
- Supports and responses for families with children with disability require flexibility in delivery to address ongoing needs, particularly in families with complex and chronic challenges, as well as the delivery of supports to respond to critical incidents. This requires addressing structural barriers to ensure comprehensive training, policies and referral protocols for DFV with knowledge of intervention, support or referral pathways that are tailored to individual circumstances and needs (Hudspeth et al., 2022). Moreover, therapeutic supports should be offered that are accessible, affordable and responsive to the experiences of children with disability who are exposed to DFV.
- Our finding that a substantial proportion of children with disability exposed to DFV have psychological and developmental support needs is important. Crisis and counselling support services need to be equipped to respond to the needs of children with disability in these families, and resourced to support them effectively.
- Almost two in three children with a mother hospitalised for assault were born in the most socio-economically disadvantaged areas (1st and 2nd quintiles) and outer regional or remote areas. This has implications for regional and remote resource needs and service provision to address DFV, particularly for families that have additional needs in relation to supporting children with disability.
Conclusions from linked data and case file analysis
The first phase of this project was undertaken to examine the nature and extent of DFV that children with disability are exposed to. Utilising linked population-level data has enabled us to ascertain the prevalence of children with disability exposed to DFV in Western Australia. Children with disability have double the exposure to a mother hospitalised for assault compared to the general population of children. Children with disability are also far more likely than the population of children to have child protection involvement and entry into out-of-home care. Children with disability make up approximately 30 per cent of those children exposed to domestic violence, as identified through the police and hospitalisation data. Children with disability make up 32 per cent of children involved in child protection and 36 per cent who enter out-of-home care.
These findings show the substantial support and resources required for children with disability and their families in services and systems. Our results also highlight the over-representation of Aboriginal and Torres Strait Islander children with disability and the increased proportion of children with disability in regional and remote areas exposed to DFV. It also highlights the importance of the Close the Gap targets for a 50 per cent reduction in all forms of family violence and abuse against Aboriginal and Torres Strait Islander women and children and a 45 per cent reduction in the rate of Aboriginal and Torres Strait Islander children in out-of-home care by 2031 (Australian Government, 2021). This provides evidence for the crucial need for service provision that is culturally appropriate for Aboriginal and Torres Strait Islander families and that regional and remote areas have adequate access to services which meet their needs. Aboriginal andTorres Strait Islander-led research that addresses the evidence and monitoring for prevention and intervention strategies are essential directions for future research.
This project has also been able to describe what is known about the nature and extent of exposure to DFV for children with disability reported to child protection. Through analysis of a sample of the intake reports of 280 families in South Australia, 62 families were identified as including a child with disability reported to child protection between July and December 2016, and this study found that 45 of these family groups had exposure to DFV. This study has identified that children with disability are over-represented in the sample of children and their families compared to children with disability in the Australian population.
Overall, this study shows a picture of highly complex contexts of abuse and neglect, of which DFV is one feature, and the obstacles to services and supports experienced by children with disability and their families. This study has provided a deeper insight into the exposure to DFV for children with disability. It lays the groundwork for future research into service provision and access for children with disability and describes implications for policy and practice around the understanding of DFV and the design of preventative and responsive services and supports. Given the high proportion of families with a child with disability who would be accessing health services, it is also important to address structural barriers for health professionals and for health systems to have comprehensive training, policies and referral protocols for DFV with knowledge of intervention or referral pathways (Hudspeth et al., 2022). While our study has focused onadministrative data and case file reviews to understand the prevalence and nature of DFV in children with disability, our broader project also aims to capture the voices of children and families who experience DFV and the facilitators and barriers to service provision, which is covered in our final report (Robinson et al., 2022). Importantly, children with disability and their families need to have a voice in how these services can be tailored to meet their needs, and greater research and prevention efforts need to be dedicated to reducing the risk of DFV exposure.
References
Arney, F., Chong, A., Taylor, C., & Octoman, O. (2018, September 2–5). Identifying factors associated with families with repeat involvement with child protection [Conference presentation]. International Society for the Prevention of Child Abuse and Neglect (ISPCAN) 22nd International Congress on Child Abuse and Neglect, Prague, Czech Republic.
Australian Bureau of Statistics. (2008a). Australian social trends 2008. https://www.ausstats.abs.gov.au/ausstats/subscriber.nsf/0/DE5DE30C9CF6E5E3CA25748E00126A25/$File/
41020_2008.pdf
Australian Bureau of Statistics. (2008b). Socio-Economic Indexes for Areas (SEIFA) – Technical paper. ABS.
Australian Bureau of Statistics. (2011). Australian and New Zealand Standard Offence Classification (ANZSOC). https://www.abs.gov.au/AUSSTATS/abs@.nsf/Lookup/1234.0Main+Features12011?OpenDocument
Australian Bureau of Statistics. (2018). Australian Statistical Geography Standard (ASGS): Volume 5 – Remoteness structure, July 2016. https://www.abs.gov.au/ausstats/abs@.nsf/mf/1270.0.55.005
Australian Bureau of Statistics. (2019a). Disability, Ageing and Carers, Australia: Summary of findings. ABS. https://www.abs.gov.au/statistics/health/disability/disability-ageing-and-carers-australia-summary-findings/latest-release
Australian Bureau of Statistics. (2019b). National Aboriginal and Torres Strait Islander Social Survey, 2014–15. https://www.abs.gov.au/ausstats/abs@.nsf/Lookup/by%20Subject/4714.0~2014-15~Feature%20Article~Aboriginal%20and%20Torres%20Strait%20Islander%20women’s%20experiences%20of%20family%20and%20domestic%20violence%20(Feature%20Article)~10100
Australian Bureau of Statistics. (2020). Partner violence – In focus: Crime and justice statistics. https://www.abs.gov.au/statistics/people/crime-and-justice/focus-crime-and-justice-statistics/partner-violence-january-2020
Australian Institute of Family Studies. (2019). Child protection and Aboriginal and Torres Strait Islander children. AIFS.
Australian Institute of Health and Welfare. (2019). Family, domestic and sexual violence in Australia: Continuing the national story 2019 – In brief. Cat. no. FDV 4. https://www.aihw.gov.au/getmedia/b180312b-27de-4cd9-b43e-16109e52f3d4/aihw-fdv4-FDSV-in-Australia-2019_in-brief.pdf.aspx?inline=true
Australian Institute of Health and Welfare. (2020a). Australia’s children. https://www.aihw.gov.au/reports/children-youth/australias-children/contents/health/the-health-of-australias-children
Australian Institute of Health and Welfare. (2020b). People with disability in Australia. Cat. no. DIS 77. https://www.aihw.gov.au/getmedia/ee5ee3c2-152d-4b5f-9901-71d483b47f03/aihw-dis-72.pdf.aspx?inline=true
Australian Institute of Health and Welfare. (2021). Child Protection Australia 2019–2020. Cat. no. CWS 78. https://www.aihw.gov.au/getmedia/c3b0e267-bd63-4b91-9ea6-9fa4d14c688c/aihw-cws-78.pdf.aspx?inline=true
Australian Institute of Health and Welfare. (2022). METEOR: Metadata online registry – Disability group code N. https://meteor.aihw.gov.au/content/index.phtml/itemId/316280
Bragg, H. L. (2003). Child protection in families experiencing domestic violence. US Department of Health and Human Services.
Brain Injury Australia. (2018). The prevalence of acquired brain injury among victims and perpetrators of family violence. https://www.braininjuryaustralia.org.au/wp-content/uploads/BRAININJURYAUSTRALIAfamilyviolencebraininjuryFINAL.pdf
Bromfield, L., Lamont, A., Parker, R., & Horsfall, B. (2010). Parenting and child abuse and neglect in families with multiple and complex problems. Child Abuse Prevention, 33. Australian Institute of Family Studies. https://aifs.gov.au/sites/default/files/publication-documents/issues33_0.pdf
Campo, M. (2015). Children’s exposure to domestic and family violence: Key issues and responses. CFCA Paper 36. Australian Institute of Family Studies. https://aifs.gov.au/cfca/sites/default/files/publication-documents/cfca-36-children-exposure-fdv.pdf
Campo, M., & Tayton, S. (2015). Domestic and family violence in regional, rural and remote communities. Australian Institute of Family Studies. https://aifs.gov.au/cfca/sites/default/files/publication-documents/cfca-resource-dv-regional.pdf
Commonwealth of Australia. (2019). Fourth Action Plan of the National Plan to Reduce Violence against Women and their Children 2010–2022. Commonwealth of Australia. https://www.dss.gov.au/women-publications-articles-reducing-violence/fourth-action-plan
Commonwealth of Australia, Department of Prime Minister and Cabinet. (2021a). National Agreement on Closing the Gap. Commonwealth of Australia.
Commonwealth of Australia, Department of Prime Minister and Cabinet. (2021b). Closing the Gap: Commonwealth Implementation Plan. Commonwealth of Australia. https://www.niaa.gov.au/sites/default/files/publications/commonwealth-implementation-plan-130821.pdf
Commonwealth of Australia (Department of Social Services). (2021). Safe and Supported: The National Framework for Protecting Australia’s Children 2021–2031. Commonwealth of Australia. https://www.dss.gov.au/sites/default/files/documents/12_2021/dess5016-national-framework-protecting-childrenaccessible.pdf
Corr, C., & Milagros Santos, R. (2017). Abuse and young children with disabilities: A review of the literature. Journal of Early Intervention, 39(1), 3–17. https://doi.org/10.1177/1053815116677823
Council of Australian Governments. (2011). National Plan to Reduce Violence against Women and their Children 2010–2022. https://www.dss.gov.au/sites/default/files/documents/08_2014/national_plan1.pdf
Cross, T. P., Mathews, B., Tonmyr, L., Scott, D., & Ouimet, C. (2012). Child welfare policy and practice on children’s exposure to domestic violence. Child Abuse & Neglect, 36(3), 210–216.
Department for Child Protection (SA). (2020). Disability Access and Inclusion Plan 2020–2024. https://www.childprotection.sa.gov.au/department/about-us/disability-access-and-inclusion-plan
Department of Families, Fairness and Housing. (2020, May 11). National Disability Insurance Scheme (NDIS) – Child and family system interface. https://providers.dffh.vic.gov.au/ndis-child-and-family-system-interface-practice-guidelines
Dion, J., Paquette, G., Tremblay, K. N., Collin-Vézina, D., & Chabot, M. (2018). Child maltreatment among children with intellectual disability in the Canadian Incidence Study. American Journal on Intellectual and Developmental Disabilities, 123(2), 176–188.
Disability Discrimination Act 1992 (Cth).
Dyson, S., Frawley, P., & Robinson, S. (2017). “Whatever it takes”: Access for women with disabilities to domestic and family violence services (ANROWS Horizons 5/2017). ANROWS.
Eberhard, K. (2015). Unresolved issues: Recordkeeping recommendations arising from Australian commissions of inquiry into the welfare of children in out-of-home care, 1997–2012. Archives and Manuscripts, 43(1), 4–17.
Evans, J., Golding, F., O’Neill, C., & Tropea, R. (2020). “All I want to know is who I am”: Archival justice for Australian care leavers. In Archives, Recordkeeping, and Social Justice (pp. 105–126). Routledge.
Fawcett, B. (2016). Children and disability: Constructions, implications and change. International Social Work, 59(2), 224–234. https://doi.org/10.1177/0020872813515011
Flynn, S. (2020). Theorizing disability in child protection: Applying critical disablity studies to the elevated risk of abuse for disabled children. Disability and Society, 35(6), 949–971. https://doi.org/10.1080/09687599.2019.1669433
Frankenberger, D. J., Clements-Nolle, K., & Yang, W. (2015). The association between adverse childhood experiences and alcohol use during pregnancy in a representative sample of adult women. Women’s Health Issues, 25(6), 688–695.
Fraser-Barbour, E., Crocker, R., & Walker, R. (2018). Barriers and facilitators in supporting people with intellectual disabilty to report sexual violence: Perspectives of Australian disability and mainstream support providers. Journal of Adult Protection, 20(1), 5–16. https://doi.org/10.1108/JAP-08-2017-0031
Glasson, E. J., de Klerk, N. H., Bass, A. J., Rosman, D. L., & Palmer, C. D. J. (2007). Cohort profile: The Western Australian family connections genealogical project. International Journal of Epidemiology, 37(1), 30–35.
Hernon, J., Brandon, M., Cossar, J., & Shakespeare, T. (2015). Recognising and responding to the maltreatment of disabled children: A children’s rights approach. Social Work and Social Sciences Review, 17(3), 61–77. https://doi.org/10.1921/13003170306
Herrenkohl T., Sousa, C., Tajima, E., Herrenkohl, R., & Moylan, C. (2008). Intersection of child abuse and children’s exposure to domestic violence. Trauma, Violence and Abuse, 9(2), 84–99.
Holden, G. W. (2003). Children exposed to domestic violence and child abuse: Terminology and taxonomy. Clinical Child and Family Psychology Review, 6(3), 151–160.
Holman, C. D., Bass, A. J., Rouse, I. L., & Hobb, M. S. (1999). Population-based linkage of health records in Western Australia: Development of a health services research linked database. Australian New Zealand Journal of Public Health, 23(5), 453–59.
Hudspeth, N., Cameron, J., Baloch, S., Tarzia, L., & Hegarty, K. (2022). Health practitioners’ perceptions of structural barriers to the identification of intimate partner abuse: A qualitative meta-synthesis. BMC Health Services Research, 22(1), 96. https://doi.org/10.1186/s12913-022-07491-8
Humphreys, C., & Healey, L. (2017). PAThways and Research into Collaborative Inter-Agency practice: Collaborative work across the child protection and specialist domestic and family violence interface: Final report (ANROWS Horizons 03/2017). ANROWS.
Humphreys, C., Healey, L., & Heward‐Belle, S. (2020). Fathers who use domestic violence: Organisational capacity building and practice development. Child & Family Social Work, 25, 18–27.
Iezzoni. L. I. (2000). Using administrative data to study persons with disabilities. Milbank Q, 80(2), 347–379. https://doi.org/10.1111/1468-0009.t01-1-00007
Jaffe, P. G., Wolfe, D., & Campbell, M. (2012). Growing up with domestic violence: Assessment, intervention, and prevention strategies for children and adolescents. Hogrefe Publishing.
Jones, L., Bellis, M. A., Wood, S., Hughes, K., McCoy, E., Eckley, L., Bates, G., Mikton, C., Shakespeare, T., & Officer, A. L. (2012). Prevalence and risk of violence against children with disabilities: A systematic review and meta-analysis of observational studies. Lancet, 380(9845), 899–907. https://doi.org/10.1016/s0140-6736(12)60692-8
Kerns, C. M., Newschaffer, C. J., & Berkowitz, S. J. (2015). Traumatic childhood events and autism spectrum disorders. Journal of Autism and Developmental Disorders, 45, 3475–3486.
Litrownik, A. J., Newton, R., Hunter, W. M., English, D., & Everson, M. D. (2003). Exposure to family violence in young at-risk children: A longitudinal look at the effects of victimization and witnessed physical and psychological aggression. Journal of Family Violence, 18, 59–73. https://doi.org/10.1023/A:1021405515323
Maclean, M. J., Sims, S., Bower, C., Leonard, H., Stanley, F. J., & O’Donnell, M. (2017). Maltreatment risk among children with disabilities. Pediatrics, 139(4). https://doi.org/10.1542/peds.2016-1817
Madden, R., & Dimitropoulous, V. (2014). The International Classification of Functioning, Disability and Health ICF: What it is and what it can be used for. Interchange Journal of the Health Information Management Association of Australia, 4, 27–29.
Margolin, G., & Vickerman, K. (2011). Posttraumatic stress in children and adolescents exposed to family violence. Couple and Family Psychology, 1(S), 63–73.
McCloskey, L.A, & Walker, M. (2000). Postratumatic stress in children exposed to family violence and single-event trauma. Journal of the American Academy of Child and Aolescent Psychiatry, 39, 108–115.
McDonald, M., & Rosier, K. (2011). Interagency collaboration: Does collaboration benefit children and families? Exploring the evidence. Australian Family Relationships Clearinghouse. https://policywise.com/wp-content/uploads/2016/08/Pre-Reading-Inter-Agency-Collaboration-Briefing-Paper-21-Part-B.pdf
McQuire, C., Daniel, R., Hurt, L., Kemp, A., & Paranjothy, S. (2020). The causal web of foetal alcohol spectrum disorders: A review and causal diagram. European Child & Adolescent Psychiatry, 29(5), 575–594.
Meiksans, J., Arney, F., Flaherty, R., Octoman, O., Chong, A., Ward, F., & Taylor, C. (2021). Risk factors identified in prenatal child protection reports. Children and Youth Services Review, 122. https://doi.org/https://doi.org/10.1016/j.childyouth.2020.105905
Meiksans, J., McDougall, S., Arney, F., Flaherty, R., Chong, A., Ward, F., & Taylor, C. (2021). The nature of domestic and family violence reported to child protection prenatally. Children and Youth Services Review, 120. https://doi.org/10.1016/j.childyouth.2020.105685
Moore, T., Buchanan, F., Chung, D., Chong, A., Fernandes, C., Hawkes, M., Meiksans, J., Moulding, N., Martin, R.,
& Schulze, D. (2020). Fostering safety in families reunifying after violence: Findings from a participatory study with young people and families. Australian Centre for Child Protection, University of South Australia.
National Disability Insurance Agency. (2021a). NDIS Operating Guidelines. List A: Conditions that are likely to meet the disability requirements. https://www.ndis.gov.au/about-us/operational-guidelines/access-ndis-operational-guideline/list-conditions-which-are-likely-meet-disability-requirements-section-24-ndis-act
National Disability Insurance Agency. (2021b). NDIS Operating Guidelines. List B: Conditions that are likely to result in a permanent impairment. https://www.ndis.gov.au/about-us/operational-guidelines/access-ndis-operational-guideline/list-b-permanent-conditions-which-functional-capacity-are-variable-and-further-assessment-functional-capacity-generally-required
National Disability Insurance Scheme Act 2013 (Cth).
https://www.legislation.gov.au/Details/C2021C00540
Nixon, J. (2009). Domestic violence and women with disabilities: Locating the issue on the periphery of social movements. Disability & Society, 24(1), 77–89.
Octoman, O., Arney, F., Chong, A., O’Donnell, M., Meiksans, J., Hawkes, M., Ward, F., & Taylor, C. (2022). A rapid exploratory analysis of the extent of child protection involvement over the life of the family. Child Abuse Review: e2762.
Ogle, J., Vincent, S., & Hawkes, M. (2022). Authenticity, power and the case record: A textual analysis of the participation of children and young people in their child protection conference. Child & Family Social Work, 27(2), 278–286. https://doi.org/10.1111/cfs.12881
Orr, C., Fisher, C., Glauert, R., Preen, D., & O’Donnell, M. (2022). A demographic profile of mothers and their children who are victims of family and domestic violence: Using linked police and hospital admissions data. Journal of Interpersonal Violence, 37(1–2). https://journals.sagepub.com/doi/pdf/10.1177/0886260520916272
Orr, C., Preen, D., Fisher, C., Sims, S., & O’Donnell, M. (2021). Trends in hospital admissions for intimate partner violence in Australian mothers with children born from 1990 to 2009. Journal of Interpersonal Violence, 36
(15–16). https://doi.org/10.1177/0886260519832905
Our Watch. (2018). Changing the picture: A national resource to support the prevention of violence against Aboriginal and Torres Strait Islander women and their children. https://www.ourwatch.org.au
Patel, D. R., & Brown, K. A. (2017). An overview of the conceptual framework and definitions of disability. International Journal of Child Health and Human Development, 10(3), 247–252.
Petterson, B., Leonard, H., Bourke J., Sanders, R., Chalmers, R., Jacoby, P., & Bower, C. (2005). IDEA (Intellectual Disability Exploring Answers): A population-based database for intellectual disability in Western Australia. Annals of Human Biology, 32(2), 237–243. https://doi.org/10.1080/03014460500075035
Productivity Commission. (2019). Report on Government Services 2019, Part B, Chapter 4. Productivity Commission.
Reed, B., Oliver, G., Upward, F., & Evans, J. (2018). Multiple rights in records: The role of recordkeeping informatics. In Archival futures (pp. 99–116). Facet Publishing.
Robinson, S., Frawley, P., & Dyson, S. (2021). Access and accessibility in domestic and family violence services for women with disabilities: Widening the lens. Violence against Women, 27(6–7), 918–936.
Robinson, S., valentine, k., & Idle, J. (2021). Disability and family violence prevention: A case study on participation in evidence making. Evidence & Policy: A Journal of Research, Debate and Practice, 17(2), 315–333.
https://doi.org/10.1332/174426421X16143457505305
Robinson, S., valentine, k., Marshall, A., Burton, J., Moore, T., Brebner, C., & O’Donnell, M. (2022). Connecting the dots: Understanding the domestic and family violence experiences of children and young people with disability within and across sectors: Final report. ANROWS.
Robinson, S., valentine, k., Newton, B. J., Smyth, C., & Parmenter, N. (2020). Violence prevention and early intervention for mothers and children with disability: Building promising practice (Research report, 16/2020). ANROWS.
Royal Commission into Violence, Abuse, Neglect and Exploitation of People with Disability. (2020). Interim report. Commonwealth of Australia. https://disability.royalcommission.gov.au/system/files/2020-10/Interim%20Report.pdf
Russell, A. E., Ford, T., Williams, R., & Russell, G. (2016). The association between socioeconomic disadvantage and attention deficit/hyperactivity disorder (ADHD): A systematic review. Child Psychiatry and Human Development, 47(3), 440–458. doi: 10.1007/s10578-015-0578-3
Spencer, N. J., Blackburn, C. M., & Read, J. M. (2015). Disabling chronic conditions in childhood and socioeconomic disadvantage: A systematic review and meta-analyses of observational studies. BMJ Open, 5, e007062. https://doi.org/10.1136/bmjopen-2014-007062
Sullivan P., & Knutson, J. (2000). Maltreatment and disabilities: A population based epidemiological study. Child Abuse and Neglect, 24(10), 1257–1273. https://doi.org/10.1016/S0145-2134(00)00190-3
Taylor, C. (2008). Trafficking in facts: Writing practices in social work. Qualitative Social Work, 7(1), 25–42.
Thiara, R. K., Hague, G., & Mullender, A. (2011). Losing out on both counts: Disabled women and domestic violence. Disability & Society, 26(6), 757–771.
United Nations. (1989, November 20). United Nations Convention on the Rights of the Child. https://www.ohchr.org/en/instruments-mechanisms/instruments/convention-rights-child#:~:text=PART%20I-,Article%201,child%2C%20majority%20is%20attained%20earlier
Witte, S. (2020). Case file analyses in child protection research: Review of methodological challenges and development of a framework. Children and Youth Services Review, 108. https://doi.org/10.1016/j.childyouth.2019.104551
Women with Disabilities Australia. (2007). Forgotten sisters: A global review of violence against women with disabilities. WWDA.
Woollard, M. (2014). Administrative data: Problems and benefits: A perspective from the United Kingdom. In A. Duşa, D. Nelle, G. Stock, & G. G. Wagner (Eds.), Facing the future: European research infrastructures for the humanities and social sciences (pp. 49–60). SCIVERO.
World Health Organization. (2011). World report on disability. WHO. https://www.who.int/publications/i/item/9789241564182
Appendix A:
Disability categories
Table A1: Disability categories
Groups
Diagnosis
Databases
Intellectual disability [c]
Intellectual disability
IDEA, HMDS, MHIS
Autism and pervasive development disorders [c]
Autism (autistic disorder)
includes autistic disorders
pervasive developmental disorders
IDEA, HMDS, MHIS
Cerebral palsy [c]
Cerebral palsy
IDEA, HMDS, MHIS
Other genetic conditions [c]
Genetic conditions excluding Down syndrome
(as listed in Table A2)
IDEA, HMDS, MHIS
Spinal cord or brain injury [c]
Resulting in paraplegia, quadriplegia, hemiplegia where there is severe loss of strength and movement in the affected limbs of the body
HMDS, MHIS
Permanent blindness [c]
Permanent blindness
HMDS, MHIS
Permanent bilateral hearing loss [c]
Permanent hearing loss
HMDS, MHIS
Deaf blindness [c]
Permanent and severe to total impairment of visual function and hearing
HMDS, MHIS
Amputation or congenital absence of two limbs [c]
Amputations (T05)
Congenital absence of limb or part thereof
(Q71, Q72, Q73)
HMDS
Conditions resulting in physical impairment
Conditions for physical impairment (List B for NDIS)
HMDS, MHIS
Conduct disorder
Conduct disorder (F91)
HMDS, MHIS
ADHD
ADHD (F90.0)
HMDS, MHIS
Diagnosed mental health disorders (excluding specific groups)
Mental and behavioural disorder [a] (all other mental/behavioural disorders apart from autism, conduct disorder, attention deficit and intellectual disability)
HMDS, MHIS
Chronic health conditions
Cystic fibrosis (E84)
Epilepsy (G40)
Asthma (J45)
Diabetes (E10–E14)
HMDS, MHIS
Birth defects (generic category)
Birth defects (other congenital malformations contained in WARDA) [b]
WARDA, HMDS
Down syndrome
Down syndrome (Q90)
WARDA, HMDS, IDEA
Notes: a This includes organic disorders, disorders due to psychoactive substance use, schizophrenia-type disorders, mood disorders, behavioral syndromes, stress-related disorders, personality disorders, specific developmental disorders, behavioral and emotional disorders.
b See https://kemh.health.wa.gov.au/services/register_developmental_anomalies/diagnostic_codes_birth_defects.htm.
Also see Appendix B.
c NDIS Categories – List A: Conditions that are likely to meet the disability requirement. https://ourguidelines.ndis.gov.au/home/becoming-participant/applying-ndis/list-conditions-are-likely-meet-disability-requirements
Table A2: Disability categories including ICD-10 codes
NDIS category List A
Group
Databases
ICD-10 codes
1. Intellectual disability
Intellectual disability
IDEA
HMDS
MHIS
F70–F79
2. Autism and pervasive development disorders
Autism
(Autistic disorder)
List A – includes Autistic disorders
List B – pervasive developmental disorders (F84)
IDEA
WARDA
HMDS
MHIS
F84, F84.0, F84.1, F84.2, F84.5 (all of F84)
F84 Pervasive developmental disorders
F84.0 Childhood autism
F84.1 Atypical autism
F84.2 Rett syndrome
F84.3 Other childhood disintegrative disorder
F84.4 Overactive disorder associated with mental retardation and stereotyped movements
F84.5 Asperger syndrome
F84.8 Other pervasive developmental disorders
F84.9 Pervasive developmental disorder, unspecified
3. Cerebral palsy
Cerebral palsy
IDEA
WARDA
HMDS
MHIS
G80
4. Other genetic conditions (unlike NDIS category, Down syndrome has been excluded into separate category)
IDEA WARDA HMDS
MHIS
Other genetic conditions (excluding Down syndrome – separate group)
Angelman syndrome (Q87.85)
Coffin-Lowry syndrome in males (Q89.8)
Cornelia de Lange syndrome (Q87.12)
Cri du Chat syndrome (Q93.4)
Edwards syndrome (Trisomy 18 – full form) (Q91)
Epidermolysis bullosa (severe forms) (Q81)
Lesch-Nyhan syndrome (E79.1)
Leigh syndrome (G31.82)
G31.8–G31.9, G32.8: Congenital degenerative CNS disorder
Leukodystrophies:
Alexander disease (infantile and neonatal forms)
Canavan disease
Krabbe disease (gl oboid cell leukodystrophy)
Infantile form (E75.23)
Pelizaeus-Merzbacher disease (connatal form)
Lysosomal storage disorders resulting in severe intellectual and physical impairments:
Gaucher disease Types 2 and 3 (E75.22)
Niemann-Pick disease (Types A and C) (E75.24)
Pompe disease (E74.02)
Sandhoff disease (infantile form) (E75.01)
Schindler disease (Type 1)
Tay-Sachs disease (infantile form) (E75.02)
Mucopolysaccharidoses – the following forms:
MPS 1-H (Hurler syndrome) (E76.01 and E76.02)
MPS III (San Fillipo syndrome) (E76.22)
Osteogenesis Imperfecta (severe forms) (Q78.0)
Type II – with two or more fractures per year and significant deformities severely limiting ability to perform activities of daily living (E76.1)
Patau syndrome (Q91)
Rett syndrome (F84.2)
Spinal muscular atrophies of the following types: (G12)
Werdnig-Hoffmann disease (SMA Type 1 Infantile form)
Dubowitz disease (SMA Type II – Intermediate form)
X-linked spinal muscular atrophy
5. Spinal cord or brain injury
Resulting in paraplegia, quadriplegia, hemiplegia where there is severe loss of strength and movement in the affected limbs of the body
HMDS
MHIS
Paraplegia and tetraplegia (G82); hemiplegia
S14 Injury of nerves and spinal cord at neck level (check numbers with potential restriction to S14.0 concussion and oedema of cervical spinal chord)
S06 Intracranial injury
T06.0 Injuries of brain and cranial nerves with injuries of nerves and spinal cord at neck level
6. Permanent blindness
NDIS *in both eyes
HMDS
MHIS
H54 – Blindness
H54.4 Blindness in one eye
H54.0 Blindness both eyes
7. Permanent bilateral hearing loss
NDIS *in both ears
HMDS
MHIS
H90 Conductive and sensorineural hearing loss
H91 Other and unspecified hearing loss
8. Deaf blindness
Permanent and severe to total impairment of visual function and hearing
HMDS
MHIS
Have identified impairment in both 6 and 7
9. Amputation or congenital absence of two limbs
Amputations (T05)
Congenital absence of limb or part thereof (Q71, Q72, Q73)
T05 Traumatic amputations involving multiple body regions
T05.0 both hands
T05.1 one hand and other arm [any level]
T05.2 both arms [any level]
T05.3 both feet
T05.4 one foot and other leg [any level, except foot]
T05.5 both legs [any level]
T05.6 upper and lower limbs [any level]
T05.8 combinations of body regions
T05.9 multiple traumatic amputations, unspecified
Congenital absence of limbs
Q71 Reduction defects of upper limb
Q72 Reduction defects of lower limb
Q73 Reduction defects of unspecified limb
9a. Additional groups – Conditions resulting in physical impairment (List B)
List B for conditions for physical impairment
Epidermolysis bullosa (Q81)
Harlequin type icthyosis (Q80.4)
Juvenile arthritis/Stills disease (excluding monocyclic/self-limited adult-onset Stills disease) (M08, M09)
Rheumatoid arthritis (M06)
Diseases of myoneural junction and muscle (G70, G71) – which includes types of muscular dystrophy
9a. Additional groups – Conditions resulting in physical impairment (List B)
Conduct disorder (F91)
HMDS
MHIS
F91–F92
9a. Additional groups – Conditions resulting in physical impairment (List B)
ADHD (F90.0)
HMDS
MHIS
F90.0
Diagnosed mental health disorders (excluding specific groups)
Not included in NDIS but psychiatric disability is an interest group
Mental and behavioural disorder [a] (all other mental/behavioural disorders apart from autism, conduct disorder, attention deficit and intellectual disability)
HMDS
MHIS
F00–F69, F80–F99 (excluding F84.0, F84.1, F90–F92)
Chronic health conditions
Cystic fibrosis (E84)
Epilepsy (G40)
Asthma (J45)
Diabetes (E10–E14)
Coded separately and also included as a chronic health condition group
Other groups
NDIS category List A
Group
Databases
ICD-10 codes
Birth defects (generic category)
Birth defects (other congenital malformations)
WARDA [b] HMDS
Congenital malformations from WARDA
Down syndrome
Down syndrome (Q90)
Notes: a This includes organic disorders, disorders due to psychoactive substance use, schizophrenia-type disorders, mood disorders, behavioral syndromes, stress-related disorders, personality disorders, specific developmental disorders, behavioral and emotional disorders.
Appendix B:
Western Australian register of birth defects categories
Main diagnostic categories
Common individual defects within category
Nervous system defects
Neural tube defects
Anencephalus
Spina bifida
Encephalocoele
Microcephaly
Congenital hydrocephalus
Congenital deafness
Congenital anomalies of eye
Anophthalmia
Microphthalmia
Congenital cataract and lens anomalies
Congenital anomalies of ear, face and neck
Anotia, microtia
Branchial remnants
Cardiovascular defects
Transposition of great vessels
Tetralogy of fallot
Ventricular septal defect
Atrial septal defect
Hypoplastic left heart syndrome
Patent ductus arteriosus
Coarctation of aorta
Respiratory system defects
Choanal atresia
Gastro-intestinal defects
Cleft palate only
Cleft lip only
Cleft lip and palate
Tracheo-oesophageal fistula
Oesophageal atresia/stenosis
Pyloric stenosis
Stenosis/atresia small intestine
Stenosis/atresia anus
Hirschprung’s disease
Uro-genital defects
Undescended testis
Hypospadias
Renal agenesis or dysgenesis
Cystic kidney disease
Obstructive defects renal pelvis
Vesico-ureteric reflux
Other anomalies of ureter
Musculo-skeletal defects
Developmental dysplasia of hip
Polydactyly
Syndactyly
Reduction deformities
Upper and/or lower limbs
Craniosynostosis
Diaphragmatic hernia
Exomphalos
Gastroschisis
Congenital anomalies of integument
Birth marks, naevus
Chromosomal defects
Down syndrome
Trisomy 13
Trisomy 18
Turner syndrome
Other
Congenital hypothyroidism
Adrenogenital syndome
Disorders of amino acid
Transport and metabolism
Phenylketonuria
Disorders of carbohydrate
Transport and metabolism
Cystic fibrosis
G6PD deficiency
Thalassemias
Haemophilia
Muscular dystrophies and myopathies
Fetal alcohol spectrum disorder
Congenital rubella syndrome
Olivia Octoman
Australian Centre for Child Protection,
University of South Australia
Dr Martine Hawkes
Australian Centre for Child Protection,
University of South Australia
Fernando Lima
Australian Centre for Child Protection,
University of South Australia
Associate Professor Melissa O’Donnell
Australian Centre for Child Protection,
University of South Australia
Dr Carol Orr
School of Population and Global Health,
University of Western Australia
Professor Fiona Arney
Director, Arney Chong Consulting
Associate Professor Tim Moore
Australian Centre for Child Protection,
University of South Australia
Professor Sally Robinson
Disability and Community Inclusion,
College of Nursing and Health Sciences,
Flinders University
Professor Kylie Valentine
Social Policy Research Centre,
University of New South Wales
Dr Amy Marshall
Disability and Community Inclusion,
College of Nursing and Health Sciences,
Flinders University
Jala Burton
Disability and Community Inclusion,
College of Nursing and Health Sciences,
Flinders University
Professor Chris Brebner
Centre for Innovation in Learning and Teaching,
Flinders University
RESEARCH REPORT
ISSUE 16 | SEPTEMBER 2022
ANROWS acknowledgement
This material was produced with funding from the Australian Government and the Australian state and territory governments. Australia’s National Research Organisation for Women’s Safety (ANROWS) gratefully acknowledges the financial and other support it has received from these governments, without which this work would not have been possible. The findings and views reported in this paper are those of the authors and cannot be attributed to the Australian Government, or any Australian state or territory government.
Acknowledgement of Country
ANROWS acknowledges the Traditional Owners of the land across Australia on which we live and work. We pay our respects to Aboriginal and Torres Strait Islander Elders past, present and emerging. We value Aboriginal and Torres Strait Islander histories, cultures and knowledge. We are committed to standing and working with First Nations Peoples, honouring the truths set out in the Warawarni-gu Guma Statement.
Peer review process
The quality of ANROWS publications is ensured through a rigorous peer review process that is consistent with the principles of the Committee on Publication Ethics (COPE) Ethical Guidelines for Peer Review. This report has been assessed by at least two peer reviewers with relevant academic expertise.
© ANROWS 2022
![]()
With the exception of the ANROWS branding, content provided by third parties, and any material protected by a trademark, all material presented in this publication is licensed under a Creative Commons Attribution-NonCommercial 3.0 Australia (CC BY-NC 3.0 AU) licence.
The full licence terms are available at creativecommons.org/licenses/by-nc/3.0/au/legalcode
Published by
Australia’s National Research Organisation for Women’s Safety Limited (ANROWS)
PO Box Q389, Queen Victoria Building, NSW 1230 | www.anrows.org.au | Phone +61 2 8374 4000
ABN 67 162 349 171
ISBN:978-1-922645-48-7 (paperback)
ISBN: 978-1-922645-49-4 (PDF)
Please note that there is the potential for minor revisions of this report.
Please check the online version at www.anrows.org.au for any amendment.
This report addresses work covered in the ANROWS research project RP.20.06 “Connecting the dots: Understanding the DFV experiences of children and young people with disability within and across sectors”. Please consult the ANROWS website for more information on this project.
ANROWS research contributes to the six National Outcomes of the National Plan to Reduce Violence against Women and their Children 2010–2022. This research addresses National Outcome 4 – Services meet the needs of women and their children experiencing violence.
Suggested citation:
Octoman, O., Hawkes, M., Lima, F., O’Donnell, M., Orr, C., Arney, F., Moore, T., Robinson, S., valentine, k., Marshall, A., Burton, J., & Brebner, C. (2022). The nature and extent of domestic and family violence exposure for children and young people with disability (Research report, 16/2022). ANROWS.
Australian Centre for Child Protection
University of South Australia
GPO Box 2471
Adelaide SA 5001
Flinders University
Sturt Road
Bedford Park SA 5042
UNSW Sydney
High Street
Kensington NSW 2052
Author acknowledgement
The authors would like to thank the Linkage, Data Outputs and Research Data Services teams at the Western Australian Data Linkage Branch, in particular the data custodians of the Midwives Notification System, Hospital Morbidity Data System, Mental Health Information System, Western Australian Registry of Births, Deaths and Marriages, IDEA Database, Western Australia Register of Developmental Anomalies, Department of Communities – Child Protection and Family Support, and the Western Australia Police Force. We would also like to thank the people of Western Australia for the use of their de-identified administrative data. This paper does not necessarily reflect the views of the government departments involved in this research and any errors of omission or commission are the responsibility of the researchers.
We also would like to acknowledge and thank the Western Australian Aboriginal Health Ethics Committee.
The research team would also like to acknowledge the support of the data custodian for Phase 1B: the Department for Child Protection, South Australia.
Acknowledgement of lived experiences of violence
ANROWS acknowledges the lives and experiences of the women and children affected by domestic, family and sexual violence who are represented in this report. We recognise the individual stories of courage, hope and resilience that form the basis of ANROWS research.
ANROWS acknowledges that children and young people living in homes where domestic and family violence (DFV) is present are not simply “exposed” to DFV – they are experiencing it. There are no circumstances in which children and young people are exposed to DFV and are not also being impacted by this violence. Therefore, ANROWS will always default to using “experienced DFV” instead of “were exposed to DFV” or “witnessed DFV”. This language aligns with the National Plan to End Violence Against Women and Children (due for finalisation in 2022), which recognises that children experience DFV as victims in their own right, and also seeks to honour the voices of victims and survivors who have felt minimised, erased or unacknowledged as childhood survivors.
Please note that in this report, the authors have chosen to use the term “exposed to DFV”.
Caution: Some people may find parts of this content confronting or distressing. Recommended support services include 1800RESPECT (1800 737 732), Lifeline (13 11 14) and, for Aboriginal and Torres Strait Islander people, 13YARN (13 92 76).
Acronyms
| Acronym | Definition |
|---|---|
| ABS | Australian Bureau of Statistics |
| ADHD | Attention deficit hyperactivity disorder |
| AIHW | Australian Institute of Health and Welfare |
| ASD | Autism spectrum disorder |
| CPFS | Department of Communities – Child Protection and Family Support |
| CWD | Children with disability |
| DFV | Domestic and family violence |
| HMDS | Hospital Morbidity Data System |
| ICD | International Classification of Diseases |
| IDEA | Intellectual Disability Exploring Answers |
| MHIS | Mental Health Information System |
| MNS | Midwives Notification System |
| NDIS | National Disability Insurance Scheme |
| WAPIMS | Western Australia Police Information Management System |
| WARDA | Western Australian Register of Developmental Anomalies |
Executive summary
Background
Children (term used to be inclusive of young people) with disability are known to experience violence at rates significantly higher than their peers without disability (Jones et al., 2012; Maclean et al., 2017). However, little is known about either the prevalence and risk of harm for children with disability exposed to domestic and family violence (DFV) or about how to use this information to build more child-centred and responsive practice and policy (Hernon et al., 2015; Corr & Milagros Santos, 2017).
Children with disability enter multiple systems at times of DFV crisis. Unless these children enter through disability services, the services are unlikely to have disability front of mind due to a historical legacy of segregation, where children with disability were regarded as requiring “special provision” by specialist disability institutions and services (Fawcett, 2016). System-level responses to children with disability are typically delivered through the dominant paradigm operating in the system through which these children enter (e.g. DFV, disability, child protection, criminal justice, health, housing, youth crisis services, education; Flynn, 2020).
Previous research has found that disability services are regularly and notably absent from cross-sector collaborative responses to DFV (McDonald & Rosier, 2011), and a lack of understanding, resources, awareness of or education about people with disability has led to a lack of “disability literacy” among mainstream services (Fraser-Barbour et al., 2018). Alongside this, disability services lack expertise around violence. This presents challenges for both data capture and developing more effective responses to improve access and to support disability- and violence-informed practice.
Aim and objectives
The project that this report relates to, “Connecting the dots”, aimed to scope and map current data capture of children with disability exposed to DFV; identify gaps and limitations; map new intersections unique to this population; and bring this knowledge into dialogue with the priorities of children, families and practitioners in order to improve policy and practice. The project comprised three phases, and this report focuses on the first phase of our project, with a final report covering the second and third phases (Robinson et al., 2022). The three phases involved the following:
- analysing administrative datasets to identify the prevalence of exposure to DFV for children with disability and how administrative data can be used to determine the nature of DFV exposure for children with disability. This phase was split into two sections: Phase 1A, a quantitative analysis of population-level, state-linked datasets; and Phase 1B, a qualitative analysis of a random sample of families reported to child protection
- holding interviews with young people with disability, family members and service providers about their ideas, experiences and priorities for improving supports when children and young people with disability experience DFV
- bringing key stakeholders together to find out how policies and systems can be more responsive to young people’s priorities.
Phase 1A of the project utilised population-level, state-linked administrative data from Western Australia to examine the extent of children with disability’s exposure to DFV.
Phase 1B utilised child protection administrative data and case file information from South Australia to examine the nature and exposure to DFV for children with disability. The work in Phase 1B complemented the work of Phase 1A by providing nuance to the nature of violence that children with disability are exposed to and the circumstances surrounding the violence. Together, Phase 1A and 1B utilised systems data to capture the extent of exposure children with disability have to DFV across two Australian jurisdictions.
Methods
Phase 1A: Population-level, state-linked data
In Phase 1A of the project, data from a population-level cohort of children born in Western Australia from 1990 to 2009 was utilised to identify the disability status of the children. Phase 1A comprised two sections: a population-based linked administrative data study of all children born alive in Western Australia between 1990 and 2009, with children followed from birth until 2013 (birth cohort), to determine if they had a mother hospitalised for assault and/or if they were involved in child protection; and a linked population-based study using data of children born alive between 1987 and 2010, whose mother was identified by the Western Australia Police Information Management System (WAPIMS) as a victim of DFV between 2004 and 2008 (DFV cohort). Given the availability of the data, both data sources were utilised to attain the prevalence of children exposed to DFV. Child protection notifications and substantiation data can include both exposure to DFVand maltreatment but are limited in differentiating between them.
To determine children’s disability status, four sources of data were used: the Hospital Morbidity Data System (HMDS); the Mental Health Information System (MHIS); the Western Australian Register of Developmental Anomalies (WARDA); and the Intellectual Disability Exploring Answers (IDEA) database (Petterson et al., 2005). Mothers’ histories of hospital discharges for assault-related injuries were ascertained through the International Classification of Diseases (ICD) codes. Data from the Department of Communities – Child Protection and Family Support (CPFS) provided information on children’s histories of child protection involvement in Western Australia. Socio-economic status was determined by the Index of Relative Social Disadvantage 2006 (Australian Bureau of Statistics, 2008b). Five levels of disadvantage were assigned to census collection districts.
Phase 1B: Case file analysis
Phase 1B of the project used a case file analysis framework (Witte, 2020) to examine a random sample of children reported to child protection from a metropolitan region within the South Australian child protection jurisdiction over six months in 2016. A report is a concern reported to the statutory child protection department by any type of notifier alleging child abuse or neglect. This is the primary entry point for children into the child protection system and the intake report outlines the concerns regarding the child.
Following coding and agreement, a quantitative analysis of the extent of children with disability exposed to DFV was conducted on the case reports. Information about the type of disability recorded for each child and family as well as the number of children with disability in the family were recorded and analysed. Themes relating to DFV and disability were categorised to represent those identified from the data. These themes are presented and contain deidentified illustrative or cumulative case studies using case study methodology designed to anonymise the data while presenting as true a picture as possible.
Results/findings
Phase 1A: Linked data
There were 524,534 children identified in the birth cohort. Through the utilisation of linked data, the study found that 16 per cent (n=83,768) of these children were identified as having disability. A higher proportion of the Aboriginal and Torres Strait Islander children in the birth cohort identified as having disability at 22 per cent, compared to non-Aboriginal and Torres Strait Islander children at 15 per cent. There were also sex differences, with males having a higher prevalence of disability (18%) than females (13%).
Hospital DFV data
The study determined there were 22,368 children in the birth cohort who had a mother hospitalised for assault in Western Australia. between March 1989 and June 2013. Overall, this results in a population prevalence of 4 per cent, with children with disability exposed at double the prevalence at 8 per cent. Of children whose mothers were hospitalised for assault, 29 per cent were children with disability. There was variation across disability groups in children whose mothers were hospitalised for assault. Overall, Aboriginal and Torres Strait Islander children were more likely than non-Aboriginal and Torres Strait Islander children to have a mother hospitalised for assault (26% compared to 3%), which was higher again for Aboriginal and Torres Strait Islander children with disability (36%). Children living in socio-economically disadvantaged areas were more likely to have mothers hospitalised for assault. Sixty-one per cent of children whose mothers werehospitalised for DFV were born in the most socio-economically disadvantaged areas (1st and 2nd quintiles). This proportion was slightly higher for children with disability exposed to maternal assault hospitalisation, at 63 per cent. Finally, children of mothers hospitalised for assault were more likely to be from outer regional or remote areas (34%) compared to the overall population (17%) and this was slightly higher among children with disability (36%).
Children with disability in the birth cohort were more likely to be reported to child protection than those without disability, which is consistent with previous research (Jones et al., 2012; Maclean et al., 2017). Within the group with disability, proportions of child protection involvement were more than double the population levels:
- The proportion of children with disability who had at least one maltreatment allegation was 11 per cent (compared to 5.5% for the population).
- Five and a half per cent had at least one substantiated maltreatment allegation (compared to 2.4% for the population).
- Four per cent were placed in out-of-home care at least once (compared to 1.7% for the population).
The proportion of children with disability who were involved with a maltreatment allegation was 32 per cent; those with a substantiated maltreatment allegation numbered 36 per cent; and, similarly, out-of-home care placement was found in 36 per cent. Children with disability who were Aboriginal and Torres Strait Islander and/or from the most socio-economically disadvantaged areas were again over-represented in child protection involvement.
Police DFV data
There were 15,423 children identified in the DFV cohort – that is, children with a mother who was identified in the police data as having a male perpetrator charged for a violent offence against them and where a domestic relationship flag was present. Of these children, 30 per cent were children with disability. This is similar to the birth cohort, in which 29 per cent of the children whose mother was hospitalised for assault were children with disability.
There were also high levels of child protection involvement for those children whose mother was identified in the police data, with:
- 59 per cent of these children also having a child maltreatment allegation, which was higher for children with disability (66%)
- 30 per cent of these children having a substantiated allegation, which was higher for children with disability (36%)
- 17 per cent of these children having an out-of-home-care placement, which was higher for children with disability (22%).
Phase 1B: Case file analysis
Phase 1B analysed a sample of child protection intake reports relating to 280 families reported to child protection in South Australia between July and December 2016, representing approximately 1,063 children. Of these families, 62 (22%) were identified as including a child with disability who had a report to child protection (referred to as an “index child” in this report). This study found that 45 (73%) of these 62 family groups had exposure to DFV.
For each of the 62 families with an index child with disability, information about disability and DFV was coded from narrative details contained in the child protection intake reports, using the definition of the categories of disability defined by Phase 1A. These details were limited by the data on disability recorded in the intake reports. Of the 62 families with an index child with disability, developmental delay and autism spectrum disorder (ASD) were the most commonly identified disabilities.
DFV recorded for these families varied. For many families, the DFV was chronic. For some families, information about any links between DFV and disability was not visible in the intake reports. However, 21 (47%) of the 45 family groups experiencing DFV and including a child with disability were identified as containing one or more of the following themes relating to DFV and disability.
Theme 1: Children with disability experienced trauma as a result of DFV
For 17 families, reports contained some information about children with disability showing signs of trauma, describing them as being scared, distressed, anxious or having behaviour problems in response to the DFV that they had been exposed to.
Theme 2: The perpetrator of the DFV directed violence towards the children with disability
For seven of the family groups, the perpetrator of the DFV also perpetrated violence (physical abuse) toward the child with disability. In some of the family groups, these children against whom violence had been used were also reported to use violence themselves.
Theme 3: Violence negatively impacted service access for children with disability
Three family groups in this study experienced an impact on access to services because of the DFV in their families.
Theme 4: Intervention order breaches occurred
In two family groups, the reports contained details of breaches of no-contact intervention orders where the children with disability had contact with a parent/caregiver who was the defendant.
Theme 5: Disability of children presented added complexity to escaping DFV
For two family groups in this study, the disability of the children presented an added complexity to escaping DFV.
Conclusions
The first phase of this project was undertaken to examine the nature and extent of DFV exposure for children with disability. Utilising linked population-level data has enabled us to ascertain the prevalence of children with disability exposed to DFV. Our results show that children with disability have double the exposure to a mother hospitalised for assault compared to the general population. Children with disability are also far more likely than the general population to have child protection involvement and entry into out-of-home care. Concerningly, children with disability make up approximately 30 per cent of those children exposed to DFV as identified through the police and hospitalisation data. Children with disability also make up 32 per cent of children involved in child protection and 36 per cent of those who enter out-of-home care.
This project has also been able to describe what is known about the nature and extent of the exposure to DFV for children with disability reported to child protection. Through analysis of a sample of intake reports on 280 families, this study found that 62 families were identified as including an index child with disability. Forty-five of the 62 family groups had exposure to DFV. Overall, this study paints a picture of highly complex contexts of abuse and neglect, of which DFV is one feature. It also shows the complex needs of children with disability and their families and the obstacles in obtaining services and supports.
Recommendations/implications for policy and practice
This phase of the project provides evidence of the need to better identify the prevalence of DFV and disability in routine data collection, and specifies opportunities to make better use of administrative data to identify especially vulnerable groups/families in the population.
Given the over-representation of children with disability exposed to DFV, these findings show the substantial support and resources required for children with disability and their families in services and systems. Our results also highlight the over-representation of Aboriginal and Torres Strait Islander children with disability and the increased proportion of children with disability in regional and remote areas who are exposed to DFV. This provides evidence for the crucial need for service provision that is culturally appropriate for Aboriginal and Torres Strait Islander families and highlights that regional and remote areas need to have adequate access to services that meet their needs.
There is a need to consider in policy and practice how to better support children with disability and their parents/caregivers. Access to services and supports to ensure children with disability feel safe and supported is vital. Support for parents and caregivers of children with disability is also an important consideration. They need access to resources, services and support to enable appropriate and safe housing for their families, as well as mental health support to meet their families’ needs. Other implications for policy and practice found from this phase of the study are as follows:
- DFV is often one factor within a complex context of child abuse and neglect. This complexity presents a compounding picture of risk for children with disability. A disability, child protection and DFV service response that is both preventative and responsive to the multiple factors that families might live with and encounter is needed.
- It is important that exclusion or ineligibility from a service does not prevent families from receiving the support that they need. For example, if a disability service cannot work with a child until safety concerns are addressed, then alternative sources of this support are needed. Families with multiple support needs often require specialised support and time to build trust with staff, especially if child protection agencies are involved or families fear their involvement.
- The significance of first response services such as hospitals and police was evident. Ensuring these practitioners are well-skilled in meeting the needs of families and children with disability is essential, particularly given the high proportion of children with disability in families experiencing violence that use these services.
- The provision of suitable alternative accommodation for women with children with disability who are experiencing DFV is needed, as is ensuring improved knowledge and skills in addressing housing requirements for people with disability. There should be provision of appropriate services and support to ensure children can remain in the home when it is safe to do so.
- Workforce development is also important. Training and resources are needed across sectors to improve support for, and knowledge of, the additional needs of children with disability and their families. Consideration needs to be given to supports for children to address development and wellbeing, as well as parents who may require support to attend mental health and/or substance use services.
- Supports and responses for families with children with disability require flexibility in delivery to address ongoing needs, particularly in families with complex and chronic challenges, as well as the delivery of supports to respond to critical incidents. This requires addressing structural barriers to ensure comprehensive training, policies and referral protocols for DFV with knowledge of intervention, support or referral pathways that are tailored to individual circumstances and needs (Hudspeth et al., 2022). Moreover, therapeutic supports should be offered that are accessible, affordable and responsive to the experiences of children with disability who are exposed to DFV.
- Our finding that a substantial proportion of children with disability exposed to DFV have psychological and developmental support needs is important. Crisis and counselling support services need to be equipped to respond to the needs of children with disability in these families, and resourced to support them effectively.
- Almost two in three children with a mother hospitalised for assault were born in the most socio-economically disadvantaged areas (1st and 2nd quintiles) and outer regional or remote areas. This has implications for regional and remote resource needs and service provision to address DFV, particularly for families who have additional needs in relation to supporting children with disability.
Directions for future research
This study has provided a deeper insight into the exposure to DFV for children with disability. It lays the groundwork for the future research that is required into service provision and access for children with disability and the design of preventative and responsive services and supports. Importantly, children with disability and their families and Aboriginal and Torres Strait Islander families and communities need to have a voice in how these services can be tailored to meet their needs and greater research and prevention efforts need to be dedicated to reducing the risk of DFV exposure.
Introduction
Domestic and family violence (DFV) has been identified as a priority for the Australian Government since the development of the National Plan to Reduce Violence against Women and their Children 2010–2022 (Council of Australian Governments [COAG], 2011). Much of this work has been viewed through the lens of the impact of DFV on adults. Statistics indicate that one in six women have experienced violence by a partner, with women aged 25 to 34 years and 35 to 44 years being the highest proportion of those who have experienced partner violence in the last two years (Australian Bureau of Statistics [ABS], 2020). This coincides with the age group of women who are most likely to be pregnant and/or have young children in their care. For those women who experienced partner violence and had children in their care, 68 per cent reported that their children had seen or heard the violence (Australian Institute of Health andWelfare [AIHW], 2020a); however, this self-reported indicator could potentially underestimate the extent of children’s exposure to DFV.
DFV can be defined in many ways. This study uses the definition outlined in the National Plan: “acts of violence that occur between people who have, or have had, an intimate relationship” (COAG, 2011, p. 2). While there is no single definition, the central element of DFV is an ongoing pattern of behaviour aimed at controlling a partner through fear – for example, by using behaviour which is violent and threatening. In most cases, violent behaviour is part of a range of tactics used to exercise power and control over women and their children, and can be both criminal and non-criminal. Domestic violence includes physical, sexual, financial, emotional and psychological abuse (COAG, 2011, p. 2). Our study also uses the DFV definition of the AIHW (2020a), which includes children’s exposure to violence within their family, including abuse and maltreatment perpetrated by a family member. In this study, child protection data is captured under this definition.
Exposure to DFV is multidimensional and goes beyond a child observing or hearing violence (Holden, 2003). A child (term inclusive of young people) being exposed to DFV incorporates a range of experiences, including experiencing, witnessing or hearing violence first-hand; living with the aftermath of DFV, including witnessing injuries; being displaced from homes; having prenatal exposure to DFV; intervening in DFV (e.g. asking a parent to stop or defending a parent); and hearing about the DFV after it has occurred (Holden, 2003).
Over time, there has been increasing recognition that some groups are disproportionately impacted by DFV. The Fourth Action Plan of the National Plan to Reduce Violence against Women and their Children (hereafter, the Fourth Action Plan; Commonwealth of Australia, 2019) focuses on primary prevention and priority groups experiencing disproportionate levels of DFV, including Aboriginal and Torres Strait Islander women, and women and their children with diverse lived experiences, including disability. A principle of the Fourth Action Plan recognises the importance of child-focused responses, but there is little attention to children in the plan other than as the children of women who experience violence. The National Plan for Protecting Australia’s Children 2021-2031 (Commonwealth of Australia, Department of Social Services, 2021) has recently been released, and includeschildren with disability as a priority group, recognising the increased risk of harm they face. This is particularly important for children with disability, who are known to experience violence at rates significantly higher than their peers without disability (Jones et al., 2012; Maclean et al., 2017). In 2019, the Royal Commission into Violence, Abuse, Neglect and Exploitation of People with Disability was established. The Royal Commission and the Fourth Action Plan have both discussed the need for data to improve our understanding of the extent of DFV exposure and to monitor prevalence over time. The Disability Royal Commission has also highlighted that there is no nationally consistent data on violence and neglect experienced by people with disability including important groups such as children with disability and First Nations children with disability (Commonwealth of Australia, 2020). Little is known about either the prevalence and risk of harm for children withdisability exposed to DFV or how to use this information to build more child-centred and responsive practice and policy (Corr & Milagros Santos, 2017; Hernon et al., 2015).
The Fourth Action Plan also recognises the importance of Aboriginal and Torres Strait Islander women and children who are identified as a priority group (Commonwealth of Australia, 2019). The impacts of colonisation, dispossession and intergenerational trauma are recognised as important factors in the increased risk of violence. Australia’s “Closing the Gap” target to reduce all forms of family violence and abuse against Aboriginal and Torres Strait Island women and children will hopefully support culturally driven strategies (Commonwealth of Australia, Department of Prime Minister and Cabinet, 2021a). Determining the prevalence of Aboriginal and Torres Strait Islander children with disability who are exposed to DFV is needed evidence to inform Closing the Gap strategies and ensure the diversity of children is recognised.
Children with disability enter multiple systems at times of DFV crisis. These systems might be DFV, disability, child protection, criminal justice, health, housing, youth crisis or education-focused in their remit. Aside from disability services, these services are unlikely to have disability front of mind, due to a historical legacy of segregation where children with disability were regarded as requiring “special provision” by specialist disability institutions and services (Fawcett, 2016). Though there have been significant investments and supports for referrals put in place recently (Department for Child Protection [South Australia], 2020; Department of Families, Fairness and Housing, 2020), system-level responses to children with disability are filtered through the dominant paradigm operating in the system through which they enter (Flynn, 2020).
Previous research has found that disability services are regularly and notably absent from cross-sector collaborative responses to DFV (McDonald & Rosier, 2011), and a lack of understanding, resources, awareness of or education about people with disability has led to a lack of “disability literacy” among mainstream services (Fraser-Barbour et al., 2018). Alongside this, disability services lack expertise around violence. This presents challenges for both data capture and developing more effective responses that can improve access and support disability- and violence-informed practice.
It is in this context that this study aims to scope and map current data capture of children with disability to determine prevalence of their exposure to DFV and the nature of the violence, to identify gaps and limitations, and to map new intersections unique to this population.
Structure of this report
This report presents findings from the first phase of the study, which aimed to identify how common exposure to DFV is for children with disability, and included the use of linked datasets to improve how we can identify children with disability in the data. Article 1 of the United Nations Convention on the Rights of the Child (1989) defines a child as a person who is under 18 years of age. Consistent with this definition, this report uses “child” to refer to both children and young people under 18 years of age. Two analyses are outlined in this report: Phase 1A, a quantitative analysis of population-level administrative linked datasets in Western Australia, and Phase 1B, a mixed-method analysis of a random sample of families reported to child protection in South Australia.
Phase 1A: Linked data analysis of DFV
Phase 1A of the project examines the prevalence of DFV exposure for children with disability by utilising population-level linked data from Western Australia.
Phase 1B: Case file analysis
Phase 1B utilises child protection administrative data and case file information to examine the nature of DFV that children with disability are exposed to, as reported to child protection.
While current national and state datasets indicate that children with disability who have experienced DFV are present in child protection, hospital, emergency department and police data, these datasets have not yet been connected to form a national picture of prevalence and risk or of opportunities to improve policy and practice across jurisdictions. It is also not possible through the unconnected data to form a complete picture of areas where limitations and gaps in the data exist. Through an assessment of a random sample of data generated relating to one South Australian metropolitan child protection jurisdiction, the study presented in Phase 1B provides an analysis that, in part, responds to these gaps.
Final report
The final report (Robinson et al., 2022) presents the findings of the second phase of the study – qualitative research with children with disability, family members and service providers about their ideas, experiences, and priorities for improving supports when families of children with disability experience DFV. Findings from the two phases of the project are brought together in the final report to inform the final phase of the research, which brings key stakeholders together to develop implications for how policies and systems can be more responsive to children’s priorities (Robinson et al., 2022).
The project is guided by families with disability, practitioners and policymakers, who have provided advice and feedback throughout on our approach and how to increase the impact of our findings.
Phase 1A:
Linked data – Methods
Defining disability
As a concept, disability is “complex, dynamic, multidimensional and contested” (WHO, 2011). There is no consensus on how disability is defined and it is up to each individual to determine how they view or identify their disability. However, there are models for conceptualising disability in children that inform the collection of data (Patel & Brown, 2017). Historically, the medical model, which is based on the diagnosis or condition that results in functional impairment, was utilised to define disability. The International Classification of Functioning aims to apply a broader social model that takes into account the social and environmental context of the disability, which may impact the functional ability of a person with a particular condition (Madden & Dimitropoulous, 2014).
In Australia we have a number of disability definitions as defined by legislation. The Disability Discrimination Act 1992 (Cth) defines disability as:
- total or partial loss of the person’s bodily or mental functions
- total or partial loss of a part of the body
- the presence in the body of organisms causing disease or illness
- the malfunction, malformation or disfigurement of a part of the person’s body
- a disorder or malfunction that results in the person learning differently from a person without the disorder or malfunction
- a disorder, illness or disease that affects a person’s thought processes, perception of reality, emotions or judgement or that results in disturbed behaviour.
However, Australia’s Commonwealth disability support program, the National Disability Insurance Scheme (NDIS,) has defined disability groups according to conditions that are likely to meet the disability requirements in s 24 of the NDIS Act 2013 (Cth) (National Disability Insurance Agency, 2021a), as well as permanent conditions for which functional capacity are variable (National Disability Insurance Agency, 2021b). The NDIS advises that further assessment may be required to determine whether an individual’s functional capacity meets the requirements of the access criteria.
The NDIS has a limited range of psychiatric conditions that may result in functional impairment which would be considered as a disability by other definitions, including those laid out in the Disability Discrimination Act 1992 (Cth).
Operationalising the definition of disability using administrative data
In keeping with the principles of inclusive research, we established a policy and practice advisory group and employed a co-researcher who was a young person with lived experience of disability at the outset of the project (Robinson et al., 2022). The advisory group was formed at the commencement of the project and met on a semi-regular basis, providing advice and input on the development and interpretation of data findings and their presentation. This group was also integral in providing guidance on operationalising disability in the context of the data.
The challenge for defining disabilities in the context of population-level administrative data is that the majority of health databases use the medical model to categorise disability utilising the International Classification of Diseases (ICD) codes. These databases do not readily capture the functional capacities of individuals or the role of socio-environmental factors that impact on a person with disability being able to participate in society (Iezzoni, 2002).
To construct disability categories for this research, we used the NDIS categories (outlined in Appendix A) and included additional categories of mental health disorders and chronic health conditions (cystic fibrosis, epilepsy, asthma, diabetes) that align with the Disability Discrimination Act 1992 (Cth). These additional categories were included following discussion with our advisory group and a review of the literature including AIHW’s reports on disability (2020a, 2020b). We determined that a high number of children would have coexisting conditions that include physical, neurological, sensory and psychiatric conditions and therefore it is important to capture both an understanding of the range of conditions in the dataset and the complexity of the cases. It was important to include chronic health conditions, as they could impact children’s health outcomes and functional capacity if unmanaged. The second tablein Appendix A lists the ICD’s codes for conditions, disorders and diagnoses.
To enable us to examine coexisting conditions across broad disability groups, we combined conditions into the following categories: physical conditions; intellectual and developmental conditions (as per the AIHW Meteor definition of intellectual/learning); mental health conditions; and chronic health conditions (see Table 1). The AIHW Meteor is Australia’s repository for national metadata standards for health, housing and community services. We have utilised their grouping of intellectual/learning conditions, which we have called “intellectual and developmental conditions”, encapsulating developmental delay, intellectual disability, specific learning disorders, attention deficit hyperactivity disorder (ADHD) and autism (AIHW, 2022).
Table 1: Broad disability groups
| Category | Types of conditions |
|---|---|
| Physical conditions | Cerebral palsy Other genetic conditions Spinal cord or brain injury Permanent blindness Permanent bilateral deafness Deaf blindness Amputation or congenital absence of limbs Additional groups – conditions resulting in physical impairment Other birth defects (generic category) Down syndrome |
| Intellectual and developmental conditions | Intellectual disability Autism and developmental delay ADHD Pervasive and specific developmental disorders |
| Mental health conditions | Other diagnosed mental health disorders (except intellectual disability, autism and developmental delay, pervasive and specific developmental disorders) Conduct disorder |
| Chronic health conditions | Cystic fibrosis Epilepsy Asthma Diabetes |
Data linkage
Western Australia has a long history of data linkage, which enables the research of complex issues across multiple datasets (Holman et al., 1999). The WA Data Linkage Branch within the WA Department of Health enables the linkage of data for the same person across multiple datasets using probabilistic matching. It also enables the genealogical linkage of mothers to their children (family connections) through the use of birth registrations and midwives’ notification data (Glasson et al., 2007).
In Phase 1A of the project, to determine children’s disability status, four sources of data were used:
- The Hospital Morbidity Data System (HMDS) contains information on all public and private hospital discharges, including up to 21 diagnostic codes using the ICD codes (ICD-9: 1990–June 1999; ICD-10: July 1999–2010).
This was available for all children in the cohort who had a hospitalisation between January 1990 and June 2013. - The Mental Health Information System (MHIS) contains information on all mental health-related public and private inpatient admissions and public outpatient contacts with ICD codes utilised for mental health diagnoses for all children in our cohort between January 1990 and June 2013.
- The WA Register of Developmental Anomalies (WARDA) contains information on structural or functional birth defects that are present before birth and diagnosed by age six. WARDA receives notifications of birth defects from the Midwives Notification System (MNS), the HMDS, and other services (e.g. genetic, pathology, and private practitioners). WARDA data was available for this study for all children in the cohort between 1990 and 2009.
- The Intellectual Disability Exploring Answers (IDEA) database (Petterson et al., 2015) provides Western Australian data on individuals with intellectual disability (ID) and/or autism, by using information provided by the Department of Communities for individuals of any age with ID who are provided with services, and by the Department of Education (individuals with ID receiving education support, predominantly aged 5 to 17 years). IDEA data was available for all children born between 1990 and 2010.
While children with disability are often grouped together in studies, there is great diversity in the conditions that children experience. Our study has therefore examined the extent of DFV exposure for children both within and across disability groups. Another important issue is that, given the disproportionate exposure of Aboriginal and Torres Strait Islander women and children to DFV (Commonwealth of Australia, 2019), it is imperative that this study also provides prevalence estimates of DFV exposure for Aboriginal and Torres Strait Islander children with disability to enable improved resourcing, planning and service provision. In this study we have provided separate sections for Aboriginal and Torres Strait Islander findings, but given the extent of analysis we have had to use some combined figures and tables with comparisons predominantly focused on comparisons of Aboriginal and Torres Strait Islander children with and without disability.While DFV can impact women from any socio-economic background and geographic area, rates of DFV are higher in low socio-economic areas and regional, rural and remote areas (AIHW, 2019; Campo & Tayton, 2015). The intersections of these factors are important to identify among children with disability who are already at higher risk of exposure. Our analysis provides prevalence estimates across these groups.
Study population
Two separate cohorts were selected in Phase 1A given the data availability: a birth cohort and a DFV cohort.
Birth cohort
The birth cohort was a population-level sample of children born from 1990 to 2009. This included all children born in Western Australia during this time period with identification of their disability status across multiple administrative datasets as described before. In the birth cohort analysis, children were identified from the Birth Registrations and the MNS, with the Mortality Database identifying children who had died during the follow-up period (up to 2013). The Birth Registrations and MNS data was used to identify children’s sex, month and year of birth, and Aboriginal and Torres Strait Islander status. In addition, neighbourhood-level socio-economic status was determined by the Socio-Economic Index of Area (SEIFA) 2006 (Index of Relative Social Disadvantage) from the ABS (2008b). Five levels of disadvantage were assigned to census collection districts (around 200 households), ranging from 1 (most disadvantaged) to 5 (least disadvantaged).Residential remoteness was determined in the MNS data by the Accessibility/Remoteness Index of Australia (ARIA) 2006 at collection district level (the second smallest geographical area in the Australian Standard Geographic Classification), with criteria ranging from major cities to very remote areas (ABS, 2018).
Children exposed to DFV were identified using two data sources: mother’s hospitalisation data, to determine children whose mothers were hospitalised for assault, and linked child protection data to identify children who were exposed to abuse and neglect. Mothers’ histories of hospital discharges for assault-related injuries were ascertained from the HMDS (1989 to 2013, year prior to birth and during follow-up period) through the ICD codes that have been utilised previously (Orr et al., 2021; Table 2). The Department of Communities – Child Protection and Family Support (CPFS) data (January 1990 to March 2013) was used to provide information on children’s history of maltreatment notifications from birth onward, including age of notification and type of maltreatment. Notifications consist of reports made to CPFS regarding alleged child abuse and neglect. A notification is substantiated by CPFS when, after investigation, there is reasonable cause tobelieve the child has been, is being or is likely to be abused, neglected or otherwise harmed. After a substantiated notification, children could be removed from their families and enter out-of-home care. Children involved in child protection are notified for maltreatment allegations due to concerns of physical, emotional and psychological abuse and neglect which can include exposure to family violence. Through including child protection data in this study, we can increase our understanding of the prevalence of DFV exposure among children with disability as well as the level of interaction they have with the child protection system.
Domestic and family violence cohort
In the second analysis (DFV cohort), the cohort included children born in Western Australia between 1987 and 2010. This cohort only included children whose mother was identified by the WA Police Information Management System (WAPIMS) as a victim of domestic and family violence between 2004 and 2008, where a male perpetrator was charged for the offence against the child’s mother and there was a domestic relationship flag. This cohort was utilised to investigate the prevalence of DFV identified through the WAPIMS, which was not available for the birth cohort. The DFV cohort data was obtained from a previous case-control study led by Dr Carol Orr that investigated outcomes for children exposed to DFV, with necessary ethics approvals (Orr et al., 2022). It should be noted that completeness of data was prioritised by using all available information on children identified by the WAPIMS, enabling a more comprehensive range of information for the analysis ofthis cohort. Additionally, given that WAPIMS data was only available for this cohort and not at population level (i.e. it was not available for the birth cohort), this dataset was used to acertain the number of children with disability born to mothers identified by the police as victims of DFV, as well as to investigate the overlap between police and hospitalisation data as two ways to identify DFV episodes using linked administrative datasets.
The identification of child disability status was the same as described before, using information across multiple administrative datasets. Children were identified as exposed to DFV from two sources: the WAPIMS and the HMDS (see Table 2). The WA Police-captured DFV included when a male perpetrator had been charged for the offence against the child’s mother. The criminal offences of interest were murder, attempted murder, physical assault, sexual assault, threatening behaviour, and misuse of weapons. The categories were derived using the Australian and New Zealand Standard Offence Classification subdivision level (ABS, 2011). The DFV-related hospital discharges were identified as in the previous data analysis in the HMDS data (1987–2016).
Table 2: Data sources and cohorts, Phase 1A
| Phase 1A | Birth cohort | DFV cohort |
|---|---|---|
| Jurisdiction | WA | WA |
| Data source | Linked datasets | Linked datasets |
| Cohort | All children born in WA from 1990 to 2009 | Children born in WA from 1987 to 2010 with a mother identified by police as a DFV victim between 2004 and 2008 |
| Follow-up time | 1990 to 2013 | 1987 to 2016 |
| Disability data source |
|
|
| DFV data source |
|
|
Note: a ICD codes as used in Orr et al. (2021).
Table 3: Data sources for exposure to DFV and child maltreatment, Phase 1A
| Data source | Type of exposure |
|---|---|
| Police data | Mother identified as a victim of DFV in the WA Police Force Incident Management System, where a male perpetrator was charged for the offence and a domestic relationship flag was present. The criminal offences were murder, attempted murder, physical assault, sexual assault, threatening behaviour, and misuse of weapons. The categories were derived using the Australian and New Zealand Standard Offence Classification subdivision level (ABS Cat No. 1234.0) |
| Hospital morbidity data | DFV-related admission of mothers [a] identified through the International Classification of Diseases codes |
Child maltreatment indicators
| Data source | Type of exposure |
|---|---|
| Child protection data | Notifications of maltreatment, substantiated maltreatment notifications and periods of out-of-home care |
Note: a ICD codes as used in used in Orr et al. (2021).
Ethics approval
Ethical approval was obtained from the WA Department of Health Human Research Ethics Committee, the WA Aboriginal Health Ethics Committee, and the University of Western Australia Human Research Ethics Committee. Departmental data custodians gave permission for this data to be utilised for analysis. The WA Aboriginal Health Ethics Committee gave feedback and approval for the publication of this report.
Phase 1A:
Linked data – Findings
Linked data analysis (birth cohort)
Children with disability
The first component of this research was determining the prevalence of children with disability, utilising population-level administrative data from Western Australia. Figure 1 shows the proportion of children identified as having a disability in each of the datasets used in this study. The interactions between groups represent the proportion of children who were identified in multiple datasets. The majority of children with disability were identified in a single dataset: 44 per cent were identified in the HMDS data only; 26 per cent in WARDA data only; 9 per cent in the MHDS data only; and 4 per cent in the IDEA data only. From those identified as having a disability in two or more datasets, the most prevalent interactions were for HMDS and MHIS (6% of children with disability), HMDS and IDEA (2%), and HMDS, IDEA and WARDA (2%). The use of multiple data sources to ascertain disability is important. While the HMDS and WARDA datasetscapture a large number of children with disability, datasets such as IDEA identify a smaller number of children but are important in ascertaining children with intellectual disability.
Figure 1: Dataset interactions for child disability identification
Data table for the figure above:
| Dataset | Number of children and percentage |
|---|---|
| HMDS | 36,531 (43.6%) |
| WARDA | 22,144 (26.4%) |
| MHIS | 7,253 (8.7%) |
| IDEA | 3,718 (4.4%) |
| HMDS and WARDA | 3,817 (4.6%) |
| HMDS and MHIS | 4,660 (5.6%) |
| HMDS and IDEA | 1,780 (2.1%) |
| WARDA and MHIS | 486 (0.6%) |
| WARDA and IDEA | 688 (0.8%) |
| MHIS and IDEA | 466 (0.3%) |
| HMDS, WARDA and MHIS | 417 (0.5%) |
| HMDS, MHIS and IDEA | 428 (0.5%) |
| HMDS, WARDA and IDEA | 1,405 (1.7%) |
| WARDA, MHIS and IDEA | 55 (0.1%) |
| HMDS, WARDA, MHIS and IDEA | 120 (0.1%) |
There were 524,534 children identified in the birth cohort. This study found that 16 per cent (n=83,768) of these children were identified as having a disability (Table 4). It is difficult to compare this prevalence to other studies due to the differences in identification of disability; however, this is higher than the Australian prevalence found in the Survey of Disability, Ageing and Carers (SDAC), which collects information about people with disability, older people, and carers who assist people with disability (ABS, 2019a). In 2020, the SDAC estimated that 7.7 per cent of children aged 0 to 14 had some level of disability (AIHW, 2020a). Our disability categories were broader than the categories identified by the SDAC, with longer follow-up time, which may explain our larger prevalence. However, our prevalence was slightly less than the almost 19 per cent reported by the Nationally ConsistentCollection of Data on School Students with Disability, which identifies Australian students receiving a government-funded educational adjustment to address disability (Productivity Commission, 2019).
Aboriginal and Torres Strait Islander children in our birth cohort had a higher proportion identified as having a disability at 22 per cent, compared to non-Aboriginal and Torres Strait Islander children at 15 per cent. There were also sex differences, with males having a higher prevalence of disability (18%) than females (13%). Both the Aboriginal and Torres Strait Islander disparity and sex disparity in prevalence is consistent with the SDAC disparities (AIHW, 2020a). The disability groups found to have markedly higher prevalence for Aboriginal and Torres Strait Islander than non-Aboriginal and Torres Strait Islander children were diagnosed mental health disorders and asthma, which is consistent with previous research (AIHW, 2020b).
Of children identified in the data as having a disability (Table 4):
- Eleven per cent were Aboriginal and Torres Strait Islander children with disability, which is slightly higher than the proportion of Aboriginal and Torres Strait Islander children at a population level (8%).
- Children with disability were more likely to be socio-economically disadvantaged, with 46 per cent of children with disability living in the two most disadvantaged areas, compared to 41 per cent of children with no identified disability.
- There was a slightly higher proportion of children with disability living in outer regional and remote areas (19%) compared to those with no identified disability (16%).
Table 4: Demographic characteristics of children in cohort, overall and by disability status
Total
| Number | Disability flag No N | Disability flag No % | Disability flag Yes N | Disability flag Yes % |
|---|---|---|---|---|
| N | 440,766 | 84.03 | 83,768 | 15.97 |
Aboriginal and Torres Strait Islander status
| Aboriginal and Torres Strait Islander status | Disability flag No N | Disability flag No % | Disability flag Yes N | Disability flag Yes % |
|---|---|---|---|---|
| Yes | 31,001 | 7.03 | 8,955 | 10.70 |
| No | 409,688 | 92.97 | 74,762 | 89.30 |
Sex
| Sex | Disability flag No N | Disability flag No % | Disability flag Yes N | Disability flag Yes % |
|---|---|---|---|---|
| Females | 221,526 | 50.26 | 34,317 | 40.97 |
| Males | 219,223 | 49.74 | 49,444 | 59.03 |
Socio-Economic Index For Area
| Socio-Economic Index For Area | Disability flag No N | Disability flag No % | Disability flag Yes N | Disability flag Yes % |
|---|---|---|---|---|
| 1 (most disadvantaged) | 92,992 | 21.18 | 20,508 | 24.58 |
| 2 | 88,500 | 20.16 | 17,659 | 21.17 |
| 3 | 91,440 | 20.82 | 16,926 | 20.29 |
| 4 | 78,499 | 17.88 | 13,540 | 16.23 |
| 5 (least disadvantaged) | 87,662 | 19.96 | 14,800 | 17.74 |
Remoteness
| Remoteness | Disability flag No N | Disability flag No % | Disability flag Yes N | Disability flag Yes % |
|---|---|---|---|---|
| Major cities | 289,868 | 72.80 | 52,966 | 70.87 |
| Inner regional | 42,191 | 10.60 | 7,469 | 9.99 |
| Outer regional | 38,044 | 9.55 | 8,090 | 10.82 |
| Remote | 18,719 | 4.70 | 3,909 | 5.23 |
| Very remote | 9,360 | 2.35 | 2,302 | 3.08 |
Note: Aboriginal and Torres Strait Islander status, sex, SEIFA and remoteness subtotals do not sum to 100 per cent due to missing records.
Table 5 displays the number and percentage of children in the birth cohort identified as having disability broken down by disability type. Over the whole birth cohort, when analysing broader disability categories:
- 2 per cent of all children had an intellectual and/or developmental condition
- 4 per cent had a mental health condition
- 8 per cent had a physical condition
- 5 per cent had a chronic health condition (note that children might be identified as having multiple disability types; Figure 2).
For children with disability:
- more than half had a physical condition (52%)
- one third had a chronic health condition (33%)
- one quarter had a mental health condition (25%)
- 12 per cent had an intellectual and/or developmental condition.
Overall, the five most prevalent disability types were birth defects (6%), asthma (5%), diagnosed mental health disorders (4%), spinal cord or brain injury (2%) and intellectual disability (1%).
Table 5: Children with disability, type of disability, number and percentage, overall
| Disability groups | Overall N | Overall % |
|---|---|---|
| Children with disability | 83,768 | 15.97 |
| Intellectual and developmental conditions | 9,880 | 1.88 |
| Intellectual disability | 7,649 | 1.46 |
| Autism and pervasive development disorders | 2,555 | 0.49 |
| ADHD | 1,331 | 0.25 |
| Mental health conditions | 20,915 | 3.99 |
| Conduct disorder | 2,644 | 0.50 |
| Diagnosed mental health disorders | 19,835 | 3.78 |
| Organic disorders | 582 | 0.11 |
| Substance-related disorders | 4,759 | 0.91 |
| Schizophrenia | 4,604 | 0.88 |
| Mood disorders | 4,165 | 0.79 |
| Anxiety | 9,600 | 1.83 |
| Personality disorders | 1,002 | 0.19 |
| Disorders of psychological development | 5,406 | 1.03 |
| Other mental health disorders | 1,584 | 0.30 |
| Physical conditions | 43,264 | 8.25 |
| Cerebral palsy | 1,135 | 0.22 |
| Other genetic conditions | 523 | 0.10 |
| Spinal cord or brain injury | 9,231 | 1.76 |
| Permanent blindness | 245 | 0.05 |
| Permanent bilateral hearing loss | 1,512 | 0.29 |
| Deaf blindness | 1,706 | 0.33 |
| Amputation or congenital absence of two limbs | 275 | 0.05 |
| Conditions resulting in physical impairment | 4,282 | 0.82 |
| Down syndrome | 518 | 0.10 |
| Birth defects [a] | 29,861 | 5.69 |
| Chronic health conditions | 28,008 | 5.34 |
| Cystic fibrosis | 189 | 0.04 |
| Epilepsy | 2,562 | 0.49 |
| Asthma | 24,267 | 4.63 |
| Diabetes | 1,537 | 0.29 |
Note: a See breakdown of conditions included in birth defects in Appendix B.
Percentages do not add up to 100 given that children with coexisting conditions are included multiple times (i.e. once for each condition).
As mentioned before, some children in our birth cohort were identified as having more than one disability type. Figure 2 displays the broad disability groups and the coexisting conditions between these groups. Children with one condition represented 83 per cent of those with disability. Those having only physical disabilities represented 38 per cent of all children with disability, 25 per cent had only chronic health conditions, 15 per cent were found with only mental health conditions and 5 per cent had only intellectual and/or developmental conditions.
The most prevalent coexisting condition was found for those with mental health and physical conditions, at 4 per cent of children with disability, followed by chronic health and/or physical conditions (3%) and physical and intellectual and developmental conditions (2%). Only 549 (1%) children were identified as having all four broad groups of disability.
Figure 2: Broad disability groups and coexisting conditions
Data table for the figure above:
| Dataset | Number of children and percentage |
|---|---|
| Chronic health conditions | 22,148 (25.2%) |
| Mental health conditions | 12,350 (14.7%) |
| Intellectual and development conditions | 4,071 (4.9%) |
| Physical conditions | 31,757 (37.9%) |
| Chronic health conditions and Mental health conditions | 1,577 (1.9%) |
| Chronic health conditions and Intellectual development conditions | 544 (0.6%) |
| Chronic health conditions and Physical conditions | 2,558 (3.1%) |
| Mental health conditions and Intellectual and development conditions | 599 (0.7%) |
| Mental health conditions and Physical conditions | 3,763 (4.5%) |
| Intellectual and development conditions and Physical conditions | 2,093 (2.5%) |
| Chronic health conditions, Mental health conditions and Intellectual and development conditions | 215 (0.3%) |
| Chronic health conditions, Mental health conditions and Physical conditions | 735 (0.9%) |
| Chronic health conditions, Intellectual and development conditions and Physical conditions | 682 (0.8%) |
| Mental health conditions, Intellectual and development conditions and Physical conditions | 1,127(1.3%) |
| Chronic health conditions, mental health conditions, Intellectual and development conditions and Physical conditions | 549 (0.7%) |
Note: Percentages are calculated over all children with disability.
Aboriginal and Torres Strait Islander children with disability
Of the 39,956 Aboriginal and Torres Strait Islander children born alive in Western Australia between 1990 and 2009, 22 per cent were identified as having a disability. This percentage was higher than the proportion identified for non-Aboriginal and Torres Strait Islander children at 15 per cent. Additionally, our analysis found that (Table 6):
- Aboriginal and Torres Strait Islander children with disability were more likely to be of high socio-economic disadvantage (72%) compared to those with no disability (69%).
- The proportion of Aboriginal and Torres Strait Islander children with disability living in outer regional and remote areas (52.5%) was slightly higher than the Aboriginal and Torres Strait Islander population with no disability (48.9%).
Table 6: Demographic characteristics of Aboriginal and Torres Strait Islander children, overall and by disability status
Total
| Number | Disability flag for Aboriginal and Torres Strait Islander children No N | Disability flag for Aboriginal and Torres Strait Islander children No % | Disability flag for Aboriginal and Torres Strait Islander children Yes N | Disability flag for Aboriginal and Torres Strait Islander children Yes % |
|---|---|---|---|---|
| N | 31,001 | 77.59 | 8,955 | 22.41 |
Sex
| Sex | Disability flag for Aboriginal and Torres Strait Islander children No N | Disability flag for Aboriginal and Torres Strait Islander children No % | Disability flag for Aboriginal and Torres Strait Islander children Yes N | Disability flag for Aboriginal and Torres Strait Islander children Yes % |
|---|---|---|---|---|
| Female | 15,806 | 50.99 | 3,826 | 42.72 |
| Male | 15,195 | 49.01 | 5,129 | 57.28 |
Socio-Economic Index For Area
| Socio-Economic Index For Area | Disability flag for Aboriginal and Torres Strait Islander children No N | Disability flag for Aboriginal and Torres Strait Islander children No % | Disability flag for Aboriginal and Torres Strait Islander children Yes N | Disability flag for Aboriginal and Torres Strait Islander children Yes % |
|---|---|---|---|---|
| 1 (high disadvantage) | 15,330 | 49.72 | 4,717 | 52.88 |
| 2 | 6,043 | 19.60 | 1,709 | 19.16 |
| 3 | 4,831 | 15.67 | 1,275 | 14.29 |
| 4 | 3,396 | 11.01 | 874 | 9.80 |
| 5 (low disadvantage) | 1,231 | 3.99 | 346 | 3.88 |
Remoteness ARIA 2006
| Remoteness ARIA 2006 | Disability flag for Aboriginal and Torres Strait Islander children No N | Disability flag for Aboriginal and Torres Strait Islander children No % | Disability flag for Aboriginal and Torres Strait Islander children Yes N | Disability flag for Aboriginal and Torres Strait Islander children Yes % |
|---|---|---|---|---|
| Major cities | 11,082 | 42.79 | 2,933 | 40.47 |
| Inner regional | 2,149 | 8.30 | 512 | 7.06 |
| Outer regional | 4,318 | 16.67 | 1,252 | 17.28 |
| Remote | 4,169 | 16.10 | 1,212 | 16.72 |
| Very remote | 4,183 | 16.15 | 1,338 | 18.46 |
Note: SEIFA and remoteness count subtotals do not sum to 100 per cent of children due to missing records.
Diagnosed mental health disorders, asthma and birth defects were the three most prevalent disability types for both Aboriginal and Torres Strait Islander and non-Aboriginal and Torres Strait Islander children. Interestingly, when comparing disability types the highest differences in prevalence were also seen within those disability types (Figure 3):
- Diagnosed mental health disorders were found in 29 per cent of Aboriginal and Torres Strait Islander children with disability and 23 per cent of non-Aboriginal and Torres Strait Islander children with disability.
- Birth defects were present in 37 per cent of non-Aboriginal and Torres Strait Islander children with disability and 23 per cent of Aboriginal and Torres Strait Islander children with disability.
- Asthma was found in 34 per cent of Aboriginal and Torres Strait Islander children with disability and 28 per cent of non-Aboriginal and Torres Strait Islander children with disability.
Figure 3: Proportion of Aboriginal and Torres Strait Islander and non-Aboriginal and Torres Strait Islander children with disability
Data table for the figure above
| Disability | Non-Aboriginal and Torres Strait Islander ( %) | Aboriginal and Torres Strait Islander (%) |
|---|---|---|
| Intellectual disability | 8.96 | 11.97 |
| Autism and pervasive development disorders | 3.01 | 1.00 |
| Conduct disorder | 3.08 | 3.08 |
| Attention deficit hyperactivity disorder | 2.00 | 1.14 |
| Diagnosed mental health disorders | 23.08 | 29.03 |
| Cerebral palsy | 1.14 | 1.14 |
| Other genetic conditions | 1.14 | 0.28 |
| Spinal cord or brain injury | 10.10 | 15.92 |
| Permanent blindness | 0.22 | 0.22 |
| Permanent bilateral hearing loss | 1.98 | 3.00 |
| Deaf blindness | 2.03 | 3.00 |
| Amputation or congenital absence of two limbs | 0.22 | 0.22 |
| Conditions resulting in physical impairment | 5.00 | 5.00 |
| Down syndrome | 0.96 | 0.21 |
| Birth defects | 36.87 | 23.06 |
| Cystic fibrosis | 0.21 | 0.21 |
| Epilepsy | 3.05 | 4.01 |
| Asthma | 28.08 | 34.03 |
| Diabetes | 2.03 | 2.03 |
Note: Broader groups are not presented. Percentages are calculated over total number of children in the population. Children with coexisting conditions are included multiple times, once in each condition.
Exposure to DFV
The second component of this study was determining the prevalence of children with disability who are exposed to DFV, utilising population-level administrative data from Western Australia. Using maternal hospitalisation for assault as an indicator of DFV, we found that there were 22,368 children (born 1990 to 2009) who had been exposed to DFV between March 1989 and June 2013.
Overall, these results represented a population prevalence of 4 per cent, with children with disability exposed at double the prevalence at 8 per cent (6526; Figure 4). This higher prevalence is consistent with previous research that has found children with disability have a higher risk of exposure to violence and child protection involvement compared to their non-disabled peers (Jones et al., 2012; Maclean et al., 2017).
Figure 4: Proportion of children who were exposed to DFV (mother hospitalised for assault) between March 1989 and June 2013, overall and for children with disability
Data table for the figure above
| Population portion | Proportion of children |
|---|---|
| Population cohort | 4.3% |
| Children with disability | 7.8% |
Of children exposed to DFV (mother hospitalised for assault), 29 per cent were children with disability. Within this group, physical health conditions were the most prevalent type of disability identified in 13 per cent of children exposed to DFV. The most prevalent physical conditions were birth defects and spinal cord or brain injuries, with 6 per cent and 4 per cent of children exposed to DFV respectively. Mental health conditions were identified in 12 per cent of children exposed to DFV, 10 per cent were identified as having a chronic health condition and 5 per cent were identified as having an intellectual and/or developmental condition.
Children with disability were more likely to be exposed to DFV (mother hospitalised for assault) than children without disability. However, not all disability groups had the same exposure to DFV. When looking at the disability groups for children exposed to DFV, we found (Figure 5):
- All conditions (except cystic fibrosis) showed higher exposure to DFV than the overall birth cohort.
- The highest proportion of children exposed to DFV was seen within the broad mental health conditions group, where over 13 per cent of children diagnosed with mental health disorders and/or conduct disorder were exposed.
- Almost 7 per cent of children with physical conditions were exposed to DFV, with children with conditions resulting from physical impairment reaching 12 per cent exposure.
- Similarly, within the broad intellectual and/or developmental conditions group, 12 per cent of children with intellectual disability and/or ADHD were exposed to DFV.
- Finally, children with epilepsy showed the relative highest exposure in the broad chronic health conditions groups, at 10 per cent.
Figure 5: Proportion of children exposed to DFV (mother hospitalised for assault), by disability type
Data table for the figure above
| Disability type | Proportion of children (%) |
|---|---|
| Intellectual and development conditions | 10.94 |
| Intellectual disability | 11.75 |
| Autism and pervasive development disorders | 11.00 |
| Attention deficit hyperactivity disorder | 5.23 |
| Mental health conditions | 11.96 |
| Conduct disorder | 13.11 |
| Diagnosed mental health disorders | 13.84 |
| Physical conditions | 13.33 |
| Cerebral palsy | 6.69 |
| Other genetic conditions | 7.79 |
| Spinal cord or brain injury | 5.85 |
| Permanent blindness | 10.53 |
| Permanent bilateral hearing loss | 10.95 |
| Deaf blindness | 10.82 |
| Amputation or congenital absence of two limbs | 4.70 |
| Conditions resulting in physical impairment | 11.84 |
| Down syndrome | 4.99 |
| Birth defects | 4.90 |
| Chronic health conditions | 7.83 |
| Cystic fibrosis | 2.08 |
| Epilepsy | 10.44 |
| Asthma | 6.77 |
| Diabetes | 5.04 |
| Overall | 4.25 |
Note: Red line indicates overall population proportion. Percentages are calculated over total number of children with each disability type. Darker blue lines indicate the broad disability groups. Children with coexisting conditions are included multiple times, once in each condition.
Children living in socio-economically disadvantaged areas were more likely to be exposed to DFV (mother hospitalised for assault). Of children exposed to DFV, 61 per cent were from the two most socio-economically disadvantaged quintiles, which compares to 42 per cent of the overall population. This proportion was slightly higher for children with disability exposed to DFV (63%). Finally, children exposed to DFV were more likely to be from outer regional, remote or very remote areas (34%) compared to the overall cohort (17%). Exposure to DFV was slightly higher among children with disability who lived in outer regional, remote or very remote areas (36%) than children without disability who lived in outer regional, remote or very remote areas (33%).
Table 7: Demographic characteristics of children exposed to DFV (mother hospitalised for assault), overall and by disability status
Total
| Demographic | Children with mothers hosp. for assault N | Children with mothers hosp. for assault % | Disability flag No N | Disability flag No % | Disability flag Yes N | Disability flag Yes % |
|---|---|---|---|---|---|---|
| N | 22,368 | 15,842 | 70.82 | 6,526 | 29.18 |
Aboriginal and Torres Strait Islander status
| Demographic | Children with mothers hosp. for assault N | Children with mothers hosp. for assault % | Disability flag No N | Disability flag No % | Disability flag Yes N | Disability flag Yes % |
|---|---|---|---|---|---|---|
| Yes | 10,233 | 45.77 | 7,023 | 44.35 | 3,210 | 49.20 |
| No | 12,126 | 54.23 | 8,812 | 55.65 | 3,314 | 50.80 |
Sex
| Demographic | Children with mothers hosp. for assault N | Children with mothers hosp. for assault % | Disability flag No N | Disability flag No % | Disability flag Yes N | Disability flag Yes % |
|---|---|---|---|---|---|---|
| Female | 10,958 | 48.99 | 8,121 | 51.26 | 2,837 | 43.47 |
| Male | 11,410 | 51.01 | 7,721 | 48.74 | 3,689 | 56.53 |
SEIFA
| Demographic | Children with mothers hosp. for assault N | Children with mothers hosp. for assault % | Disability flag No N | Disability flag No % | Disability flag Yes N | Disability flag Yes % |
|---|---|---|---|---|---|---|
| 1 (most disadvantaged) | 9,385 | 42.16 | 6,548 | 41.54 | 2,837 | 43.67 |
| 2 | 4,296 | 19.30 | 3,028 | 19.21 | 1,268 | 19.52 |
| 3 | 3,709 | 16.66 | 2,626 | 16.66 | 1,083 | 16.67 |
| 4 | 2,835 | 12.74 | 2,085 | 13.23 | 750 | 11.55 |
| 5 (least disadvantaged) | 2,033 | 9.13 | 1,475 | 9.36 | 558 | 8.59 |
Remoteness
| Demographic | Children with mothers hosp. for assault N | Children with mothers hosp. for assault % | Disability flag No N | Disability flag No % | Disability flag Yes N | Disability flag Yes % |
|---|---|---|---|---|---|---|
| Major cities | 10,665 | 56.40 | 7,688 | 57.09 | 2,977 | 54.68 |
| Inner regional | 1,771 | 9.36 | 1,290 | 9.58 | 481 | 8.84 |
| Outer regional | 2,410 | 12.74 | 1,673 | 12.42 | 737 | 13.54 |
| Remote | 1,860 | 9.84 | 1,299 | 9.65 | 561 | 10.30 |
| Very remote | 2,205 | 11.66 | 1,517 | 11.26 | 688 | 12.64 |
Note: Aboriginal and Torres Strait Islander status, SEIFA and remoteness count subtotals do not sum to 100 per cent of children due to missing records.
Aboriginal and Torres Strait Islander children exposed to DFV
Aboriginal and Torres Strait Islander children were disproportionately exposed to DFV (mother hospitalised for assault) at 26 per cent, compared to only 3 per cent of non-Aboriginal and Torres Strait Islander children.
This proportion was even higher for Aboriginal and Torres Strait Islander children with disability, at 36 per cent. Aboriginal and Torres Strait Islander children made up 46 per cent of children with a mother hospitalised for assault, which was almost six times the proportion of Aboriginal and Torres Strait Islander children in the study birth cohort. Given that Aboriginal and Torres Strait Islander children make up 8 per cent of our cohort, this is a significant over-representation and is consistent with previous findings from survey data (ABS, 2019b). Furthermore, Aboriginal and Torres Strait Islander children with disability represented 49 per cent of children with disability exposed to DFV, with only 11 per cent of Aboriginal andTorres Strait Islander children with disability in the overall cohort.
Child protection contact
There were 29,071 (5.5%) children in the birth cohort with a maltreatment allegation between January 1990 and March 2013. A total of 12,638 children had a substantiated allegation, which represented 2.4 per cent of the study population, and 9,081 (1.7%) children had at least one out-of-home care placement during the study period. Overall, 30,493 (5.8%) children had contact with the child protection system (notifications, substantiations and/or out-of-home care placement). Note that there are 1,422 children who entered care but did not have a prior maltreatment allegation. We could not determine from the data the reason for care entry. Children can be placed in care without allegations for many reasons (e.g. children who were abandoned or homeless, children who came to child protection services from the juvenile justice system, or children who were siblings of other children notified). While the average age at first maltreatment allegation and/orsubstantiation was five years old, the average age at care placement was four years. However, 28 per cent, 31 per cent and 36 per cent of children were one years old or less when they had their first allegation, substantiation and/or care placement, respectively.
Children with disability were more likely to have contact with child protection, consistent with previous research (Jones et al., 2012; Maclean et al., 2017). Within the group with disability, proportions of child protection involvement were more than double the population levels (Figure 6).
- The proportion of children with disability who had at least one maltreatment allegation was 11 per cent.
- Five and a half per cent had at least one substantiated maltreatment allegation.
- Four per cent were placed in out-of-home care at least once.
The proportion of children with disability among those with a maltreatment allegation was 32 per cent. Similarly, within those with substantiated maltreatment as well as among those with a care placement, 36 per cent were identified as having a disability. This shows a significant over-representation of children with disability in contact with the child protection system, with only 16 per cent of children in the overall cohort identified as having a disability.
Figure 6: Child protection involvement for children in birth cohort and those with disability
Data table for the figure above
| Child protection involvement | Birth cohort | Children with disability |
|---|---|---|
| Allegation | 5.5% | 11.2% |
| Substantiation | 2.4% | 5.5% |
| Out-of-home care | 1.7% | 3.9% |
Figure 7 displays the proportion of children with a maltreatment allegation by type of abuse at first contact with child protection for those identified as having or not having disability. Neglect and physical abuse at first allegation were slightly more prevalent among children with disability, at 31 per cent and 28 per cent respectively (test of proportions: 0.03[CI: 0.01–0.04; p=0.00] and 0.04[CI: 0.02–0.05; p=0.00], respectively). Sexual abuse did not show significant difference between children with and without disability (0.01[CI: 0.00–0.02; p=0.15]). Conversely, the proportion of those exposed to emotional, psychological and other types of maltreatment at first allegation was slightly more prevalent within those with no identified disability (0.03[CI: 0.02–0.03; p=0.00], 0.003[CI: 0.001–0.004; p=0.00] and 0.04[CI: 0.03–0.04; p=0.00], respectively).
Figure 7: Proportion of children’s type of abuse at first child protection contact (maltreatment allegation) for those with and without disability
Data table for the figure above
| Type of above | Children with no disability | Children with disability |
|---|---|---|
| Emotional abuse | 8.9% | 6.4% |
| Neglect | 24.8% | 31.0% |
| Physical abuse | 24.7% | 28.3% |
| Psychological abuse | 0.7% | 0.4% |
| Sexual abuse | 24.7% | 25.4% |
| Other | 3.4% | 2.8% |
| Unknown | 9.3% | 5.7% |
Note: No information of type of abuse was available for children whose first contact with child protection was an out-of-home-care placement.
Child protection involvement was variable across children with different types of disability (Figure 8). Conduct disorder, ADHD, conditions resulting from physical impairment and intellectual disability showed the highest proportion of children with a maltreatment allegation, with 33 per cent, 31 per cent, 28 per cent and 22 per cent of children in these groups having at least one allegation of maltreatment during the follow-up period, respectively.
Figure 8: Proportion of children with at least one child maltreatment allegation, by type of disability
Data table for the figure above
| Disability type | Proportion of children (%) |
|---|---|
| Intellectual and development conditions | 21.54 |
| Intellectual disability | 22.55 |
| Autism and pervasive development disorders | 9.59 |
| Attention deficit hyperactivity disorder | 30.99 |
| Mental health conditions | 21.45 |
| Conduct disorder | 33.27 |
| Diagnosed mental health disorders | 21.23 |
| Physical conditions | 9.72 |
| Cerebral palsy | 11.51 |
| Other genetic conditions | 8.54 |
| Spinal cord or brain injury | 13.83 |
| Permanent blindness | 16.64 |
| Permanent bilateral hearing loss | 16.42 |
| Deaf blindness | 14.62 |
| Amputation or congenital absence of two limbs | 10.51 |
| Conditions resulting in physical impairment | 27.67 |
| Down syndrome | 6.70 |
| Birth defects | 6.39 |
| Chronic health conditions | 10.64 |
| Cystic fibrosis | 5.38 |
| Epilepsy | 16.50 |
| Asthma | 10.16 |
| Diabetes | 8.58 |
| Overall | 5.56 |
Note: Red line indicates overall population proportion. Percentages are calculated over total number of children with each disability type. Darker blue lines indicate the broad disability groups. Children with coexisting conditions are included multiple times, once in each condition.
In the overall cohort, 52 per cent of female children had contact with the child protection system – slightly more than male children (48%). However, for children with disability, there was a higher proportion of male (54%) than female (46%) children who had contact with child protection. This is driven by the higher percentage of male children with disability involved in child protection, for all levels of child protection involvement.
Table 8: Demographic characteristics of children by type of child protection involvement, by disability status
Total
Children with no disability
| Demographic | Allegations N | Allegations % | Substantiations N | Substantiations % | OoHC [a] N | OoHC [a] % |
|---|---|---|---|---|---|---|
| N | 19,651 | 4.46 | 8,031 | 1.82 | 5,803 | 1.32 |
Children with disability
| Demographic | Allegations N | Allegations % | Substantiations N | Substantiations % | OoHC [a] N | OoHC [a] % |
|---|---|---|---|---|---|---|
| N | 9,420 | 11.25 | 4,607 | 5.50 | 3,278 | 3.91 |
Sex
Children with no disability
| Demographic | Allegations N | Allegations % | Substantiations N | Substantiations % | OoHC [a] N | OoHC [a] % |
|---|---|---|---|---|---|---|
| Female | 10,781 | 54.88 | 4,455 | 55.49 | 3,090 | 53.26 |
| Male | 8,862 | 45.12 | 3,573 | 44.51 | 2,712 | 46.74 |
Children with disability
| Demographic | Allegations N | Allegations % | Substantiations N | Substantiations % | OoHC [a] N | OoHC [a] % |
|---|---|---|---|---|---|---|
| Female | 4,345 | 46.13 | 2,243 | 48.69 | 1,417 | 43.23 |
| Male | 5,074 | 53.87 | 2,364 | 51.31 | 1,861 | 56.77 |
Aboriginal and Torres Strait Islander status
Children with no disability
| Demographic | Allegations N | Allegations % | Substantiations N | Substantiations % | OoHC [a] N | OoHC [a] % |
|---|---|---|---|---|---|---|
| Yes | 6,279 | 31.97 | 2,948 | 36.73 | 2,432 | 41.94 |
| No | 13,359 | 68.03 | 5,078 | 63.27 | 3,367 | 58.06 |
Children with disability
| Demographic | Allegations N | Allegations % | Substantiations N | Substantiations % | OoHC [a] N | OoHC [a] % |
|---|---|---|---|---|---|---|
| Yes | 2,946 | 31.28 | 1,666 | 36.18 | 1,288 | 39.30 |
| No | 6,471 | 68.72 | 2,939 | 63.82 | 1,989 | 60.70 |
Socio-Economic Index for Area
Children with no disability
| Demographic | Allegations N | Allegations % | Substantiations N | Substantiations % | OoHC [a] N | OoHC [a] % |
|---|---|---|---|---|---|---|
| 1 (most disadvantaged) | 6,701 | 34.24 | 2,822 | 35.31 | 2,059 | 35.68 |
| 2 | 4,614 | 23.57 | 1,842 | 23.05 | 1,369 | 23.73 |
| 3 | 3,876 | 19.80 | 1,620 | 20.27 | 1,162 | 20.14 |
| 4 | 2,749 | 14.04 | 1,069 | 13.38 | 725 | 12.56 |
| 1 (most disadvantaged) | 6,701 | 34.24 | 2,822 | 35.31 | 2,059 | 35.68 |
Children with disability
| Demographic | Allegations N | Allegations % | Substantiations N | Substantiations % | OoHC [a] N | OoHC [a] % |
|---|---|---|---|---|---|---|
| 1 (most disadvantaged) | 3,398 | 36.20 | 1,738 | 37.90 | 1,241 | 38.00 |
| 2 | 2,269 | 24.17 | 1,079 | 23.53 | 771 | 23.61 |
| 3 | 1,760 | 18.75 | 861 | 18.77 | 615 | 18.83 |
| 4 | 1,131 | 12.05 | 533 | 11.62 | 377 | 11.54 |
| 1 (most disadvantaged) | 828 | 8.82 | 375 | 8.18 | 262 | 8.02 |
Remoteness
Children with no disability
| Demographic | Allegations N | Allegations % | Substantiations N | Substantiations % | OoHC [a] N | OoHC [a] % |
|---|---|---|---|---|---|---|
| Major cities | 10,762 | 62.29 | 4,397 | 62.90 | 3,214 | 64.01 |
| Inner regional | 2,190 | 12.68 | 862 | 12.33 | 592 | 11.79 |
| Outer regional | 2,086 | 12.07 | 737 | 10.54 | 566 | 11.27 |
| Remote | 1,306 | 7.56 | 546 | 7.81 | 380 | 7.57 |
| Very remote | 934 | 5.41 | 448 | 6.41 | 269 | 5.36 |
Children with disability
| Demographic | Allegations N | Allegations % | Substantiations N | Substantiations % | OoHC [a] N | OoHC [a] % |
|---|---|---|---|---|---|---|
| Major cities | 5,189 | 63.26 | 2,511 | 63.04 | 1,799 | 63.91 |
| Inner regional | 823 | 10.03 | 362 | 9.09 | 273 | 9.70 |
| Outer regional | 1,041 | 12.69 | 504 | 12.65 | 339 | 12.04 |
| Remote | 659 | 8.03 | 342 | 8.59 | 250 | 8.88 |
| Very remote | 491 | 5.99 | 264 | 6.63 | 154 | 5.47 |
Note: a OoHC refers to out-of-home care. Sex, Aborigial and Torres Strait Islander status, SEIFA and remoteness count subtotals do not sum to 100 per cent of children due to missing records.
Children who had contact with child protection were more likely to come from the most socio-economically disadvantaged areas. For all levels of child protection involvement, at least 35 per cent of children with disability were living in the most disadvantaged quintile as opposed to the least disadvantaged (8%). This compares to the overall cohort, where only 22 per cent of children live in the most disadvantaged quintile.
Aboriginal and Torres Strait Islander children: Child protection involvement
The over-representation of Aboriginal and Torres Strait Islander children with child protection contact was seen in this WA cohort. The Aboriginal and Torres Strait Islander children in the sample had 5.6 times higher prevalence of maltreatment allegations than non-Aboriginal and Torres Strait Islander children, 7 times higher prevalence of substantiated allegations and 8.4 times higher prevalence of placement in out-of-home care. This is consistent with the Aboriginal and Torres Strait Islander over-representation reported across jurisdictions in Australia in the national Child Protection Australia 2019–2020 publication (AIHW, 2021).
Aboriginal and Torres Strait Islander children with disability were also over-represented for each level of child protection involvement, with almost one third of all children with disability who had a maltreatment allegation being Aboriginal and Torres Strait Islander. The proportion of Aboriginal and Torres Strait Islander children with disability with child protection involvement was between 3.8 and 5.6 times the proportion found for non-Aboriginal and Torres Strait Islander children with disability. Similar over-representation of Aboriginal and Torres Strait Islander children was found among children with disability across all levels of child protection involvement.
Overlap between exposure to DFV and contact with the child protection system (birth cohort)
The majority of children who were exposed to DFV (identified by maternal hospitalisations for assault or child protection involvement) were identified by one data source only. Close to two thirds (62%) of children whose mothers were hospitalised for assault were only identified as exposed to DFV by hospitalisation records (2.6% of overall cohort). Similarly, 72 per cent of children involved with the child protection system were only identified as exposed to DFV by child protection data (4.2% of total cohort). Interestingly, these percentages were lower for children with disability at 53 per cent and 69 per cent, respectively.
There was a significant overlap between children identified as having a mother with an assault hospitalisation and those in contact with the child protection system. Overall, 38 per cent of children exposed to maternal assault hospitalisations were also in contact with child protection (allegation, substantiation and/or care placement); this proportion was 30 per cent of those in contact with child protection or 1.6 per cent of the birth cohort. This was higher for children with disability: 47 per cent of those with a mother hospitalised for assault were also in contact with child protection (31% of those in contact with child protection or 3.7% of the cohort with disability).
Table 9: Children who were involved in child protection and had a mother hospitalised for assault, by disability status
Maternal assault hospitalisation & child protection
| Factor | Overall N | Overall % | No disability N | No disability % | Disability N | Disability % |
|---|---|---|---|---|---|---|
| Maternal assault hospitalisation (MAH) | 22,368 | 4.26 | 15,842 | 3.59 | 6,526 | 7.79 |
| Child protection contact, any (Any CP) | 30,493 | 5.81 | 20,616 | 4.68 | 9,877 | 11.79 |
Interaction
| Factor | Overall N | Overall % | No disability N | No disability % | Disability N | Disability % |
|---|---|---|---|---|---|---|
| MAH only | 13,869 | 2.64 | 10,424 | 2.36 | 3,445 | 4.11 |
| Allegation & MAH | 8,038 | 1.53 | 5,124 | 1.16 | 2,914 | 3.48 |
| Substantiations & MAH | 4,505 | 0.86 | 2,722 | 0.62 | 1,783 | 2.13 |
| OoHC [a] & MAH | 3,836 | 0.73 | 2,368 | 0.54 | 1,468 | 1.75 |
| Any CP & MAH | 8,499 | 1.62 | 5,418 | 1.23 | 3,081 | 3.68 |
| Any CP only | 21,994 | 4.19 | 15,198 | 3.45 | 6,796 | 8.11 |
Note: a OoHC refers to out-of-home care.
Percentages are a proportion of the total number of children in birth cohort.
For children in the cohort whose mother was hospitalised for assault, 36 per cent had a maltreatment allegation (1.5% of cohort), 20 per cent had a substantiated allegation (0.9% of cohort) and 17 per cent were placed in out-of-home care in the follow-up period (0.7% of cohort). Among those with disability, this percentage was higher for allegations (44%), substantiated allegations (27%), and being placed in out-of-home care (22%), respectively.
Aboriginal and Torres Strait Islander children
The overlap between children identified as having a mother with an assault hospitalisation and those in contact with the child protection system was more pronounced for Aboriginal and Torres Strait Islander children. Of Aboriginal and Torres Strait Islander children identified as exposed to DFV by maternal assault hospitalisation, 47 per cent also had contact with child protection, compared to 30 per cent of non-Aboriginal and Torres Strait Islander children exposed to DFV. This overlap was higher among children with disability, with 54 per cent of Aboriginal and Torres Strait Islander children with disability exposed to DFV by maternal assault hospitalisations also having contact with child protection, compared to 40 per cent of non-Aboriginal and Torres Strait Islander children with disability exposed to DFV also having contact with child protection (Figure 9).
The percentage of children identified by only one data source was lower for Aboriginal and Torres Strait Islander children compared to non-Aboriginal and Torres Strait Islander children. Half (50%) of Aboriginal and Torres Strait Islander children identified by child protection were only identified by child protection data and 53 per cent of those exposed to maternal assault hospitalisations were only identified by hospitalisation records. This compares to 70 per cent of non-Aboriginal and Torres Strait Islander children with maternal assault hospitalisation only identified in hospitalisation records and 82 per cent of those in contact with child protection only being identified in this data source.
Figure 9: Proportion of Aboriginal and Torres Strait Islander children with and without overlapped DFV exposure and child protection involvement, overall cohort and by disability status
Data table for the figure above
Overall Aboriginal and Torres Strait Islander MAH
| Disability status | MAH only (%) | Any CP & MAH (%) |
|---|---|---|
| Overall | 52.8 | 47.2 |
| No disability | 56.0 | 44.0 |
| Disability | 45.6 | 54.4 |
Overall Aboriginal and Torres Strait Islander any CP
| Disability status | Any CP only (%) | Any CP & MAH (%) |
|---|---|---|
| Overall | 50.2 | 49.8 |
| No disability | 53.3 | 46.7 |
| Disability | 43.5 | 56.5 |
Note: MAH = maternal assault hospitalisation.
Any CP = any child protection involvement.
Aboriginal and Torres Strait Islander children were disproportionately over-represented among those exposed to maternal assault hospitalisation and involved with the child protection system. Aboriginal and Torres Strait Islander children represented 57 per cent of those exposed to maternal assault hospitalisation and with any child protection involvement, when non-Aboriginal and Torres Strait Islander children only represented 8 per cent of the cohort.
Linked data analysis (DFV cohort)
The second cohort analysis utilised data relating to children born alive in Western Australia between 1987 and 2010 and had a mother who experienced DFV, as identified through the WAPIMS (2004 to 2008). For this cohort, we were also able to determine whether the mother had a hospitalisation for assault through the HMDS data (1987 to 2016), and whether the children were involved in the child protection system (1990 to 2016). This cohort is not directly comparable to the previous birth cohort analysis as it only includes children identified through police data.
As shown in Table 10, there were 15,423 children with a mother identified in the police data where a male perpetrator was charged for a violent offence against them and a domestic relationship flag was present. Demographically, children exposed to DFV (mother in police data) were predominantly living in areas with the highest levels of socio-economic disadvantage (74%) and had a fairly even gender split, and Aboriginal and Torres Strait Islander children were over-represented at 54 per cent.
There were also high levels of child protection involvement for those children whose mother was identified in the police data with:
- 59 per cent of these children also having a child maltreatment allegation
- 30 per cent having a substantiated allegation
- 17 per cent having an out-of-home-care placement.
The proportion of children with maltreatment allegations and/or substantiated allegations was much lower than in the birth cohort, where 36 per cent had an allegation and 20 per cent had a substantiated allegation. However, children with a mother with an assault hospitalisation had a similar proportion of out-of-home-care placements to those identified in the police DFV data, at 17 per cent. Interestingly, only 24 per cent of children whose mother was identified as experiencing DFV in the police data were also identified as exposed to DFV using maternal hospitalisations for assault (Table 10). This proportion was slightly higher among children with disability, with 31 per cent of children whose mothers were identified by the police data as experiencing DFV also exposed to maternal assault hospitalisations.
For children in the DFV cohort, 30 per cent were children with disability (Table 10). The same definition of disability was used in the first and second analysis with a similar proportion (29%) of children with disability whose mother was hospitalised for assault.
Table 10: Children with and without disability with a mother identified in the police DFV dataset
Total
| All children N | All children % | Disability flag No N | Disability flag No % | Disability flag Yes N | Disability flag Yes % | |
|---|---|---|---|---|---|---|
| N | 15,423 | 10,783 | 69.92 | 4,640 | 30.08 |
Aboriginal and Torres Strait Islander status
| All children N | All children % | Disability flag No N | Disability flag No % | Disability flag Yes N | Disability flag Yes % | |
|---|---|---|---|---|---|---|
| Yes | 8,304 | 53.84 | 5,541 | 51.39 | 2,763 | 59.55 |
| No | 7,119 | 46.16 | 5,242 | 48.61 | 1,877 | 40.45 |
Sex
| All children N | All children % | Disability flag No N | Disability flag No % | Disability flag Yes N | Disability flag Yes % | |
|---|---|---|---|---|---|---|
| Female | 7,552 | 48.97 | 5,510 | 51.10 | 2,042 | 44.01 |
| Male | 7,871 | 51.03 | 5,273 | 48.90 | 2,598 | 55.99 |
SEIFA
| All children N | All children % | Disability flag No N | Disability flag No % | Disability flag Yes N | Disability flag Yes % | |
|---|---|---|---|---|---|---|
| 1 (most disadvantaged) | 8,035 | 52.10 | 5,502 | 51.02 | 2,533 | 54.59 |
| 2 | 3,312 | 21.47 | 2,341 | 21.71 | 971 | 20.93 |
| 3 | 2,228 | 14.45 | 1,594 | 14.78 | 634 | 13.66 |
| 4 | 1,258 | 8.16 | 922 | 8.55 | 336 | 7.24 |
| 5 (least disadvantaged) | 590 | 3.83 | 424 | 3.93 | 166 | 3.58 |
Remoteness
| All children N | All children % | Disability flag No N | Disability flag No % | Disability flag Yes N | Disability flag Yes % | |
|---|---|---|---|---|---|---|
| Major cities | 7,188 | 46.61 | 5,061 | 46.93 | 2,127 | 45.84 |
| Inner regional | 1,567 | 10.16 | 1,151 | 10.67 | 416 | 8.97 |
| Outer regional | 2,264 | 14.68 | 1,628 | 15.10 | 636 | 13.71 |
| Remote | 1,778 | 11.53 | 1,214 | 11.26 | 564 | 12.16 |
| Very remote | 2,626 | 17.03 | 1,729 | 16.03 | 897 | 19.33 |
Child protection involvement
| All children N | All children % | Disability flag No N | Disability flag No % | Disability flag Yes N | Disability flag Yes % | |
|---|---|---|---|---|---|---|
| Any allegations | 9,047 | 58.66 | 5,984 | 55.49 | 3,063 | 66.01 |
| Any substantiations | 4,582 | 29.71 | 2,899 | 26.88 | 1,683 | 36.27 |
| Any care placement | 2,581 | 16.73 | 1,570 | 14.56 | 1,011 | 21.79 |
| Any contact | 9,095 | 58.97 | 6,008 | 55.72 | 3,087 | 66.53 |
Mother domestic violence hospital admission from pregnancy to 6/2013
| All children N | All children % | Disability flag No N | Disability flag No % | Disability flag Yes N | Disability flag Yes % | |
|---|---|---|---|---|---|---|
| No | 11,667 | 75.65 | 8,483 | 78.67 | 3,184 | 68.62 |
| Yes | 3,756 | 24.35 | 2,300 | 21.33 | 1,456 | 31.38 |
For children with disability whose mother was identified as experiencing DFV in the police data, 56 per cent were males and 60 per cent were Aboriginal and Torres Strait Islander children, both higher proportions compared to those with no disability. Similarly, children with disability in the DFV cohort showed a higher proportion of child protection involvement than those with no disability, with 66 per cent having an allegation, 36 per cent a substantiated allegation and 22 per cent a care placement.
As shown in Table 11, 35 per cent of children in the DFV cohort were not identified as having a maternal assault hospitalisation or child protection involvement. An additional 40 per cent of those in the DFV cohort were identified also as having child protection involvement but not a maternal assault hospitalisation. Conversely, 6 per cent had a maternal assault hospitalisation but no child protection involvement. Finally, of children in the DFV cohort, 18 per cent had contact with child protection and were exposed to a maternal assault hospitalisation (three-way interaction). All interactions between data sources identifying DFV were higher for children with disability, with 24 per cent of those with disability identified in the three datasets (police, hospitalisation records and child protection records).
Table 11: Children in the DFV cohort (police records) who were involved in child protection and had a mother hospitalised for assault, by disability status (two- and three-way interactions)
| Overall N | Overall % | No disability N | No disability % | Disability N | Disability % | |
|---|---|---|---|---|---|---|
| Police only | 5,352 | 34.70 | 4,124 | 38.25 | 1,228 | 26.47 |
| MAH [a] & police | 976 | 6.33 | 651 | 6.04 | 325 | 7.00 |
| Any CP [b] & police | 6,315 | 40.95 | 4,359 | 40.42 | 1,956 | 42.16 |
| Allegation & MAH & police | 2,755 | 17.86 | 1,636 | 15.17 | 1,119 | 24.12 |
| Substantiations & MAH & police | 1,641 | 10.64 | 936 | 8.68 | 705 | 15.19 |
| OoHC [c] & MAH & police | 1,074 | 6.96 | 621 | 5.76 | 453 | 9.76 |
| Any CP & MAH & police | 2,780 | 18.03 | 1,649 | 15.29 | 1,131 | 24.38 |
Notes: a MAH refers to maternal assault hospitalisation.
b Any CP refers to any child protection involvement.
c OoHC refers to out-of-home care.
Percentages are a proportion of the total number of children in the DFV cohort.
Figure 10 breaks down disability types for children in the DFV cohort.
- The largest proportion of disability identified in the children was in relation to mental health conditions, at 14 per cent.
- This was followed by conditions associated with physical disability, at 13 per cent.
- These physical disabilities were predominantly composed of birth defects (6%) and spinal cord or brain injuries (5%).
These results are similar to our previous findings in the first analysis, where the most prevalent disability types for children of mothers hospitalised for assault also were related to mental health conditions, at 12 per cent, and physical conditions at 13 per cent, with birth defect and spinal cord or brain injuries as the predominant types.
Figure 10: Children with disability in the DFV cohort, by type of disability and Aboriginal and Torres Strait Islander status
Note: Percentages are calculated in proportion to total number of children identified by police as exposed to DFV. Children with coexisting conditions are included multiple times, once in each condition.
Aboriginal and Torres Strait Islander children in the DFV cohort
One in three Aboriginal and Torres Strait Islander children identified as exposed to DFV in the police data were identified as having a disability, and this proportion was similar to the proportion of Aboriginal and Torres Strait Islander children exposed to maternal hospitalisation in the birth cohort analysis performed previously. Aboriginal and Torres Strait Islander children with disability represented almost 60 per cent of children in the DFV cohort, which was higher than the proportion of Aboriginal and Torres Strait Islander children exposed to DFV in the police data with no disability (53%).
When analysing Aboriginal and Torres Strait Islander children in the DFV cohort by type of disability, we found that:
- Mental health conditions were more prevalent for Aboriginal and Torres Strait Islander children (16%) compared to non-Aboriginal and Torres Strait Islander children (12%).
- Physical health conditions were slightly higher for Aboriginal and Torres Strait Islander children (14%) compared to non-Aboriginal and Torres Strait Islander children (12%).
- Finally, chronic health conditions were found in 11 per cent of Aboriginal and Torres Strait Islander children in the DFV cohort.
Phase 1A:
Linked data – Discussion
Birth cohort and DFV cohort analysis
Disability ascertainment
It is important when planning disability and related services that the needs of children are routinely determined to ensure planning and service provision meet the unique support requirements of children and their families. Therefore, the disability ascertainment that we were able to undertake through linking data in this project is an important contribution to knowledge, as it provides new information on the prevalence of disability. Population-level ascertainment of children with disability is important for the monitoring of support needs and the allocation of resources and services in our communities. By utilising a range of datasets, this study has been able to achieve relatively comprehensive ascertainment of conditions.
Our population-level data identified that 16 per cent of children in the birth cohort had disability based on the definition we have outlined in our methods. This level of disability is higher than the 7.7 per cent of children aged 0 to 14 years found in the SDAC but less than the 19 per cent reported by the Nationally Consistent Collection of Data on School Students with Disability (Productivity Commission, 2019). Differences may be due to the scope of disabilities captured by the survey versus administrative data and the age profiles of the children captured.
The majority of children in this study were identified using a single database, with HMDS identifying the largest proportion of children with disability (59%), followed by the WARDA (35%), the MHIS (16%) and the IDEA (10%). While the IDEA dataset ascertained a smaller number of children, importantly it did identify more than half the children in the cohort who had an intellectual disability. This highlights the importance of using multiple data sources to ascertain disability.
The majority of children we identified with disability had one identified condition (83%). For those who did have coexisting conditions, the most prevalent co-occurring conditions were:
- mental health and physical conditions (4.5%)
- chronic health and physical conditions (3.1%)
- physical and intellectual and developmental conditions (2.5%).
As we are not using self-report data, it is a challenge to understand the complexity of coexisting conditions utilising population-level data. The AIHW (2020) has reported high levels of coexisting conditions, including physical and mental health conditions, as well as double the prevalence of asthma in children with disability. A very small proportion (1%) of children in our cohort were identified as having all four broad groups of disability.
Exposure to domestic and family violence
Maternal hospitalisation for assault
By linking administrative data, we were able to identify that 4 per cent of all children in the birth cohort had a mother hospitalised for assault, and children with disability had double the prevalence at 8 per cent. This would be an underestimate of children’s exposure to DFV as it was limited to physical abuse. Importantly, of the children whose mother had a hospitalisation for assault, almost one in three were children with disability. While children with disability were over-represented in the prevalence of children with a mother hospitalised for assault, there was variability in exposure between disability conditions. The conditions with the greatest exposure to maternal assault hospitalisations were:
- mental health conditions (13%)
- intellectual and developmental conditions (11%)
- chronic conditions (8%)
- physical conditions (7%).
This is important because children with disability whose mothers are assaulted are at risk of experiencing trauma (McCloskey & Walker, 2000). The finding that a substantial proportion of these children have psychological and developmental support requirements is significant. Crisis and counselling support services need to be equipped to respond to the needs of children with disability in these families, and resourced to support them effectively.
The significant over-representation of Aboriginal and Torres Strait Islander children with disability whose mothers were hospitalised for assault is consistent with previous findings from survey data (ABS, 2019b). Gender-based violence is not consistent with traditional Aboriginal and Torres Strait Islander culture and the over-representation of DFV for Aboriginal and Torres Strait Islander children and mothers should be seen in the context of the impact of colonisation, dispossession and entrenched disadvantage (Our Watch, 2018; AIFS, 2019). This highlights the importance of Australia’s Closing the Gap target to reduce the rate of all forms of family violence and abuse against Aboriginal and Torres Strait Island women and children by at least 50 per cent by 2031 (Commonwealth of Australia, Department of Prime Minister and Cabinet, 2021a). The Closing the Gap Implementation Plan indicates a commitment bygovernments to build and strengthen structures to empower Aboriginal and Torres Strait Islander peoples. This includes building Aboriginal and Torres Strait Islander community-controlled sectors to deliver services and to share access to location-specific data and information to enable Aboriginal and Torres Strait Islander organisations and communities to obtain a comprehensive picture of what is happening in their communities to assist their decision-making (Commonwealth of Australia, Department of Prime Minister and Cabinet, 2021b). The Fourth Action Plan has prioritised the support of Aboriginal and Torres Strait Islander women who are disproportionately exposed to DFV, and highlighted the need for governments to enable community-led solutions and design of services. This requires comprehensive data to be provided across regions to ensure this information can be delivered to communities to enable community-driven strategies.
Almost two in three children with a mother hospitalised for assault were from the two most socio-economically disadvantaged quintiles and outer regional or remote areas. This has implications for regional and remote resource needs and service provision to address DFV and in regard to families that have additional needs in relation to supporting children with disability. While disability can impact on individuals from all socio-economic levels, there is well-established literature indicating a relationship between disability and socio-economic disadvantage (WHO, 2011). The intersection of poverty and ensuring accessible services for disability is therefore an imperative for policy and practice.
Child protection involvement
According to the current Western Australian Children and Community Services Act 2004, children in need of protection include those being exposed to family violence, which is categorised as emotional abuse. Child protection involvement is therefore another source of data for ascertaining children’s exposure to DFV and child maltreatment. The child protection data includes children who have been notified to child protection for all types of maltreatment, including emotional abuse, neglect, and physical, psychological and sexual abuse.
We found that within the birth cohort between January 1990 and March 2013:
- 5.5 per cent of children had a maltreatment allegation
- 2.4 per cent had a substantiated maltreatment
- 1.7 per cent had a placement in out-of-home care.
Children with disability had double the proportion of involvement in child protection. Among children with disability:
- 11 per cent had a child maltreatment allegation
- 5.5 per cent had a substantiated allegation
- almost 4 per cent had a placement in out-of-home care.
Overall, the type of maltreatment alleged in the first contact with child protection was similar between children with and without disability. The only difference was a slightly higher prevalence of neglect (31% vs. 28%) and physical abuse (28% vs. 25%) among children with disability compared to children with no disability. Like children with disability who have maternal assault hospitalisation, the proportion of children with maltreatment allegations varied by disability groups. Conduct disorder, ADHD, conditions resulting from physical impairment and intellectual disability showed the highest proportion of children with a maltreatment allegation.
Children with disability were significantly over-represented in the child protection system. Children with disability made up:
- 32 per cent of maltreatment allegations
- 36 per cent of those with substantiated maltreatment
- 36 per cent of placements into out-of-home care.
This is similar to the estimates of previous international studies (Dion et al., 2018; Sullivan & Knutson, 2000).
This has significant policy and practice implications for the resource and support needs of children with disability, in terms of both prevention and response to abuse and violence through the child protection system. This includes the children themselves who require comprehensive health and wellbeing plans, as well as children who are eligible for NDIS support. Support for families will also be required including those going through family preservation or reunification services to ensure additional needs of their children are able to be met. This may also include support for carers (either kinship or foster carers) to meet these needs and parenting skill- and capacity-building where needed. These findings have important implications for preventing child maltreatment and determining the causal pathways for children with disability and their increased risk of child protection involvement. Consideration should also be given to the fact that children withdisability often have greater service contact, which increases the surveillance of families with a child with disability and may also contribute to higher child protection involvement.
Children with maternal assault hospitalisation and child protection contact
Our study found that 38 per cent of children with a mother hospitalised for assault were in contact with the child protection system (1.6% of birth cohort), and this was higher for children with disability at 47 per cent (3.7% of children with disability in cohort). Research reviews have provided evidence that child abuse and DFV often co-occur, with studies citing around a 41 per cent co-occurrence of child abuse and DFV (Herrenkohl et al., 2008). Bragg (2003) also indicated that in 30 to 60 per cent of families where either DFV or child maltreatment is identified, it is likely that both forms of abuse exist. In our research it is difficult to elucidate whether the DFV exposure was considered the reason for the substantiated maltreatment. However, our research does highlight the important role of the hospital system in providing support to mothers who present for an assault hospitalisation and the role of social workers in partnering with mothers toaddress their safety, health and wellbeing needs. Connection to services and support prior to discharge is essential for mothers and their children to improve both their safety and wellbeing outcomes.
Linked police DFV and child protection data
The use of linked police DFV data is an important addition to ascertaining children’s exposure to DFV. Despite the different ascertainment of DFV between the two cohorts, we found similar proportions of children with disability in those children exposed to DFV, at approximately 30 per cent. Similarly, Aboriginal and Torres Strait Islander children were over-represented in both groups, which is consistent with previous research. However, Orr et al. (2022) did find that Aboriginal and Torres Strait Islander mothers were more likely to be identified in the hospital morbidity data (73%) than identified as victims in the police data (44%) (Orr et al., 2022) and surmised that Aboriginal and Torres Strait Islander mothers may be more reluctant to disclose to police (Orr et al., 2022). Hence it is important to investigate multiple data sources to ascertain DFV exposure for children and their families.
Of interest, we found that children whose mothers were identified as experiencing DFV in the police data had very high involvement with child protection. Two thirds (66%) of those identified as having disability in the police data had a child protection allegation, which was higher than children without an identified disability (55%). This compares to 45 per cent of children with disability from the birth cohort whose mother was hospitalised for assault also having a child protection allegation. Additionally, there were 10 per cent more child allegation substantiations for children in the DFV cohort compared to children whose mother had been hospitalised for assault in the birth cohort. Research has identified that reporting of DFV can result in unintended consequences, with the potential for inappropriate child protection reports and concern that adult victims rather than the perpetrators are being held accountable for child safety (Cross et al.,2012).
Importantly, for those children identified as having both a mother with an assault hospitalisation and identified in the police data, there was much greater involvement and intervention by child protection. For children with disability whose mother was identified in both:
- 77 per cent had an allegation
- 48 per cent had a substantiated allegation
- 31 per cent were placed in out-of-home care.
This may indicate greater exposure to and/or severity of DFV but more research is needed to determine the reason for this, including if it may be due to other co-occurring factors that may result in greater safety concerns for the children. In terms of practice and policy implications, the PATRICIA (Pathways and Research into Collaborative Inter-Agency practice) project has provided important findings and recommendations to improve collaborative work across the child protection and domestic violence interface (Humphreys & Healey, 2017). Included in these recommendations is the Safe & Together approach, which focuses on building alliances with mothers, supporting and validating children’s experiences and ensuring perpetrator accountability.
Strengths and limitations of population-level linked data
Population-level linked data is an important source of data to ascertain disability and exposure to DFV. It is more difficult from small samples and survey data to identify prevalence numbers across a range of geographical areas and subpopulations including those people with disability. This has been recognised by the Royal Commission into Violence, Abuse, Neglect and Exploitation of People with Disability, which has highlighted a major challenge that there is no nationally consistent data on neglect or exploitation experienced by people with disability, including important subgroups such as children with disability and First Nations children with disability (Commonwealth of Australia, 2020). While this research has provided an important source of data to enable an ascertainment of prevalence, a greater range of datasets needs to be utilised to enable full coverage both within and across jurisdictions. This would enable a national picture of theinteraction between disability and DFV experiences among children.
While the current data has its strengths, there are also limitations. As the datasets utilised are administrative, they do not contain all the information that enable a comprehensive examination of disability and DFV. As explained in the introduction regarding defining disability, there are a range of definitions that are utilised to understand this complex construct; however, these datasets predominantly rely upon medical definitions due to the data sources that utilise ICD codes, which are very narrow. Therefore, we cannot draw from children’s own disability identification, and whether they see themselves as having a disability, or the type of disability they identify with (and how). Our data is also limited by not being able to determine children’s level of functional impairment. While we can identify conditions and diagnoses, we cannot fully ascertain the impact of a condition on the individual child or young person. In addition, the data likelyonly captures children who experience severe symptoms of their conditions, such as chronic health conditions that would require hospitalisation (e.g. epilepsy and asthma).
In regard to DFV, it is important to establish prevalence using multiple data sources, including hospital morbidity, police and child protection data. However, this has limitations in that there are many mothers experiencing DFV who are not hospitalised for injuries or experience other types of violence besides physical abuse. In addition, many families who experience DFV will never contact police or come into contact with the child protection system. This likely limits the ascertainment of mothers in the hospital data to those who experience more severe physical DFV while reducing the ascertainment of those who suffer non-physical violence (Orr et al., 2022). A broader understanding of the experiences of women and mothers and the identification of children who are exposed to DFV is needed. Future research should also utilise a broader definition of DFV that captures a wider variety of relationships in family violence, particularly kinship networks forAboriginal and Torres Strait Islander peoples. There is also no detail in the datasets on the level, duration and extent of DFV exposure for children. This includes whether children directly witness the violence or are subject themselves to the violence, or the effects of the violence on them physically, emotionally or psychologically. This is where qualitative data is important to provide a more nuanced understanding of the level and impacts of exposure.
Another limitation is that we cannot examine the impact of current policy and practice on the prevalence of DFV exposure for children with disability due to the age of our datasets. Given the current Royal Commission into Violence, Abuse, Neglect and Exploitation of People with Disability and the ongoing implementation of recommendations and policy and practice efforts, it is imperative that rates of violence exposure, abuse and neglect are more routinely monitored for the effectiveness of these efforts. Additionally, given the data availability, there are varying lengths of time for children being in the study. The time children were followed depended on birth year and available records in data sources such as hospitalisations, mental health contacts, child protection and police. All information available was used, as described in the methods section, to ensure the greatest capture of disability conditions and DFV exposure to enable quantifying theextent of the issues. Future research should take this into account in assessing risk estimates.
In this research, while we have been able to ascertain the prevalence of children exposed to DFV, this does not provide further knowledge of why there is increased exposure for children with disability. Disability is not the cause of the violence. However, previous research has discussed the co-occurrence of other factors that may increase the risk of DFV exposure in children with disability (Sullivan & Knutson, 2000). This includes family-based risk factors, such as disadvantaged communities, parental factors (e.g. mental health issues) and substance use (Sullivan & Knutson, 2000). Some of these factors may also result in children being more likely to be at risk of having a disability such as fetal alcohol spectrum disorder or ADHD (Russell et al., 2016). It is also the case that exposure to DFV may result in a disability such as an assault that leads to a head or brain injury (Brain Injury Australia, 2018). Individual-level factors intersectwith systemic and structural disadvantage which disproportionately affects children with disability and their families, resulting in higher levels of poverty, greater barriers to education, discrimination and reduced access to necessary resources (Spencer et al., 2015).
Phase 1B:
Case file analysis – Methods
Data collection
Phase 1B of the “Connecting the dots” project uses a case file analytical framework (Witte, 2020) utilising a random sample of intake reports made to child protection from a metropolitan region within South Australia over a six-month period in 2016. This sample was obtained for an earlier study but is used again here with appropriate approvals from the data custodian and ethics committees (Octoman et al., 2022).
A report made to child protection is a concern reported to the statutory child protection department by any type of notifier alleging child abuse or neglect. This is the primary entry point for children into the child protection system and the intake report outlines the concerns regarding the child. Compared to the population-level administrative data that includes all children who are born in a state through Birth Registration and the MNS, the intake reports only concern children and families who come to the attention of the child protection system. As a result, this is a more limited sample of children and families who would be considered higher risk due to their contact with the child protection system.
The intake reports were created within a professional context to meet a range of professional and legal objectives and obligations. As such, they do not “provide a ‘transparent window on the world’” (Taylor, 2008, p. 26). They are not first-person or unbiased accounts of children’s experiences, of disabilities or of DFV. The reports are only one element of administrative data held by the department and do not constitute the entirety of the data held by a jurisdiction on the child or family concerned. However, reports made by notifiers can be utilised to form a picture of concerns raised about the abuse and neglect of children over the course of their childhood. Details about children’s exposure to DFV are reported to child protection from a range of notifiers, including police who attend such matters.
Data utilised in this study was collected as a part of a broader study (Arney et al., 2018; Octoman et al., 2021) which took a first principles approach to better understand the concerns being raised to the statutory child protection department about families. Data was collected and deidentified, with the names of all family members replaced with pseudonyms as a part of this broader study. Data included child protection administrative data, including fixed-field administrative data and intake reports extracted from the electronic case management system.
Unit-record fixed-field administrative data were extracted by the Department for Child Protection for all concerns reported to child protection for children in the families. The most recent intake report that occurred prior to the end of 2016 was identified and extracted from the electronic case management system for each child in the family known to child protection with a report on the electronic filing system. Reports were included in the analysis regardless of the outcome or response to the report, and therefore the data includes both reports that were screened “in” for child protection response and reports screened “out”. Intake reports include narrative detail about the current concern reported to child protection as well as a brief summary of previous concerns reported to the child protection department. All intake reports were deidentified prior to analysis.
Ethics approval
Ethical approval was obtained from the Aboriginal Health Research Ethics Committee and the University of South Australia Human Research Ethics Committee.
Sample
The broader research study utilised a 20 per cent random sample (n=324) of children reported to child protection in a metropolitan region of South Australia made between 1 July and 31 December 2016. Family groups were identified using sibling information extracted from the electronic management system. All biological or legally related siblings of the 324 children in the random sample were identified and formed 280 families.
In total, the sample represents approximately 1,063 children. Drawing on existing data preparation and coding from the broader study and initial familiarisation with the data, 62 of the 280 families were identified as having a child with disability who was reported to child protection between July and December 2016 (referred to as an “index CWD”; see Figure 11).
Figure 11: Flow diagram of sample inclusion
Text alternative for the figure above:
Population: 1,619 children reported to statutory child protection department between 1 July and 31 December 2016 from a discrete region.
- 20% random sample: 324 children reported
-
- Family groups: 280 family groups
-
- No disability: 218 (77.9%) families had no reported index CWD
- Disability: 62 (22.1%) families had an index CWD
Measures
For each of the 62 families with a child with disability, information about disability and DFV were coded from the narrative details contained in the intake reports. Definitions of the categories of disability and DFV utilised in the case file analysis are detailed below.
Disability categories for case file analysis
Following Phase 1A of this research, to construct disability categories we have used the NDIS categories (outlined in Appendix A) and additional categories of mental health disorders and chronic health conditions that align with the Disability Discrimination Act 1992 (Cth) – cystic fibrosis, epilepsy, asthma and diabetes. However, due to descriptive limitations in the data and the reliance on one data source, the distilled categories used by Phase 1B are necessarily broad in order to capture disability types. The disability categories used by the Phase 1B study are:
- ASD
- developmental delay
- intellectual disability
- physical disability
- speech and language delay
- chronic health conditions.
Definition of domestic and family violence used for case file analysis
This study uses the following definition of DFV, as outlined in the National Plan to Reduce Violence against Women and their Children 2010–2022:
acts of violence that occur between people who have, or have had, an intimate relationship. While there is no single definition, the central element of domestic violence is an ongoing pattern of behaviour aimed at controlling a partner through fear, for example, by using behaviour which is violent and threatening. In most cases, violent behaviour is part of a range of tactics to exercise power and control over women and their children, and can be both criminal and non-criminal. Domestic violence includes physical, sexual, emotional and psychological abuse. (COAG, 2011, p. 2)
In this study, any DFV was captured where there was specific mention of violence against a parent or caregiver of the child with disability. This includes DFV that was reported at the time of the report or that was included in the history of reporting to child protection. Detail about the presence of DFV and any exposure to DFV was coded from the narrative detail contained in the intake reports. Exposure to DFV is a multidimensional concept that incorporates a range of experiences, including witnessing or hearing violence first-hand; living with the aftermath of DFV, including witnessing injuries or being displaced from their homes; having prenatal exposure to DFV; intervening in the DFV (e.g. asking a parent to stop or defending a parent); and hearing about the DFV after it occurred (Holden, 2003).
Procedure
Utilising previous coding (Arney et al., 2018), families that included any child with a health condition or physical disability, or a learning delay or intellectual disability, were identified. Disability information for children was cross-checked with the fixed-field administrative data file that contains all reports for the family, and only families that had a child with disability who were known to child protection between July and December 2016 were included for further examination.
With reference to family genograms, the intake reports were coded utilising the qualitative data analysis program NVivo by two independent researchers. For each family, the nature of the disability and the nature of DFV recorded in the family intake reports were coded. Any specific mention in the intake reports about the interface between DFV and the disability was thematically coded.
Inter-rater reliability was then conducted for all cases by running a coding comparison query in NVivo, using coding stripes and a coding comparison query. Inter-rater reliability focused on whether there was agreement about the nature of the child’s disability, the number of children with disability in a family, the presence of DFV, and the presence of a theme relating to DFV and disability in the narrative of the intake report. The two researchers worked together to bring the codes into agreement.
Analysis
In its analysis, this study uses a case file analysis framework (Witte, 2020) to explore exposure of children with disability to DFV. Following coding and agreement, a quantitative analysis of the extent of children with disability exposed to DFV was conducted. Information about the type of disability recorded for each child and family, and the number of children with disability in the family, was recorded and analysed in SPSS v25. Families for whom there was a theme relating to DFV and disability were then categorised to represent themes identified from the data. These themes are presented and contain deidentified illustrative or cumulative case studies using case study methodology designed to anonymise the data while presenting as true a picture as possible.
Findings:
Phase 1B case file analysis
Extent of children with disability exposed to DFV
Of the 62 families that included an index child with disability that was reported to child protection between July and December 2016, 45 family groups also included DFV (see Figure 12). This represents 16.1 per cent of the total sample of family groups (n=280). The remaining 17 family groups included a child with disability where no DFV was recorded in the child protection intake reports.
Figure 12: Number of families where index children with disability were exposed to DFV
Text alternative for the figure above:
Disability: 62 families had an index CWD
- No DFV: 17 (27.4%) families with an index CWD – no reported DFV
- DFV: 45 (72.6%) families had an index CWD and DFV
Two hundred and eighteen families from the random sample of families (n=280) did not include an index child with disability. For these families (Figure 12), 73.9 per cent were exposed to DFV (see Table 12).
Table 12: The number and proportion of families with index CWD and no index CWD who have DFV recorded in the intake reports for the broader sample
| Family | No DFV recorded in child protection intake reports | DFV recorded in the intake reports | Total |
|---|---|---|---|
| Index CWD | 17 (27%) | 45 (73%) | 62 (100%) |
| No index CWD | 57 (26%) | 161 (74%) | 218 (100%) |
| Total | 74 (26%) | 206 (74%) | 280 (100%) |
Nature of child disability
Across the 62 families, there were a total of 96 children with disability. This included 69 children with disability in the families, with at least one index child with disability and DFV (median = 1 child, range = 1–6), and 27 children with disability in the families with no DFV reported (median = 1 child, range = 1–3). Of the 96 index children with disability, 32.3 per cent (n=31) were identified to be living with more than one disability. The proportion of each type of disability identified for each family and for the child are detailed in Table 13.
For all children and families, developmental delay and ASD were the most commonly identified disabilities. For children reported to have a developmental delay (n=40, 41.7%), 12 (30%) were also recorded to have a speech and language delay. Speech and language delay was identified without mention of a developmental delay for a total of nine children.
In many cases, families had a number of children in the family with co-occurring disabilities. Of families with an index child with disability and DFV, 33.3 per cent had more than one child with disability, ranging between one and six children with disability in the family.
For index children with disability, 36.2 per cent of children exposed to DFV were identified to be living with more than one disability (median=1 disability, range=1–5), and for children with disability not recorded to have been exposed to DFV, 22 per cent were living with multiple disabilities (median=1, range=1–4).
Table 13: Proportion of family groups and index children with DFV, with no DFV, and total that included at least one child with any of the types of disability
Families
Autism spectrum disorder (ASD)
| Families with DFV and index CWD N | Families with DFV and index CWD % | Families with an index CWD no DFV (n=17) N | Families with an index CWD no DFV (n=17) % | All families with an index CWD (n=62) N | All families with an index CWD (n=62) % | |
|---|---|---|---|---|---|---|
| ASD | 18 | 40.0 | 8 | 47.1 | 26 | 41.9 |
| No recorded ASD | 27 | 60.0 | 9 | 52.9 | 36 | 58.1 |
Chronic health condition
| Families with DFV and index CWD N | Families with DFV and index CWD % | Families with an index CWD no DFV (n=17) N | Families with an index CWD no DFV (n=17) % | All families with an index CWD (n=62) N | All families with an index CWD (n=62) % | |
|---|---|---|---|---|---|---|
| Chronic health condition | 15 | 33.3 | 4 | 23.5 | 19 | 30.6 |
| No recorded chronic health condition | 30 | 66.7 | 13 | 76.5 | 43 | 69.4 |
Physical disability
| Families with DFV and index CWD N | Families with DFV and index CWD % | Families with an index CWD no DFV (n=17) N | Families with an index CWD no DFV (n=17) % | All families with an index CWD (n=62) N | All families with an index CWD (n=62) % | |
|---|---|---|---|---|---|---|
| Physical disability | 7 | 15.6 | 0 | 0.0 | 7 | 11.3 |
| No recorded physical disability | 38 | 84.4 | 17 | 100.0 | 55 | 88.7 |
Intellectual disability
| Families with DFV and index CWD N | Families with DFV and index CWD % | Families with an index CWD no DFV (n=17) N | Families with an index CWD no DFV (n=17) % | All families with an index CWD (n=62) N | All families with an index CWD (n=62) % | |
|---|---|---|---|---|---|---|
| Intellectual disability | 12 | 26.7 | 3 | 17.6 | 15 | 24.2 |
| No recorded intellectual disability | 33 | 73.3 | 14 | 82.4 | 47 | 75.8 |
Developmental delay
| Families with DFV and index CWD | Families with an index CWD no DFV (n=17) | All families with an index CWD (n=62) | Index CWD exposed to DFV (n=69) | Index CWD no DFV (n=27) | Total index CWD (n=96) | |
|---|---|---|---|---|---|---|
| Developmental delay | 18 | 40.0 | 7 | 41.2 | 25 | 40.3 |
| No recorded developmental delay | 27 | 60.0 | 10 | 58.8 | 37 | 59.7 |
Speech and language delay
| Families with DFV and index CWD | Families with an index CWD no DFV (n=17) | All families with an index CWD (n=62) | Index CWD exposed to DFV (n=69) | Index CWD no DFV (n=27) | Total index CWD (n=96) | |
|---|---|---|---|---|---|---|
| Speech and language delay | 13 | 28.9 | 4 | 23.5 | 17 | 27.4 |
| No recorded speech or language delay | 32 | 71.1 | 13 | 76.5 | 45 | 72.6 |
Index children
Autism spectrum disorder (ASD)
| Index CWD exposed to DFV (n=62) N | Index CWD exposed to DFV (n=62) % | Index CWD no DFV (n=27) N | Index CWD no DFV (n=27) % | Total index CWD (n=96) N | Total index CWD (n=96) % | |
|---|---|---|---|---|---|---|
| ASD | 22 | 31.9 | 13 | 48.1 | 35 | 36.5 |
| No recorded ASD | 47 | 68.1 | 14 | 51.9 | 61 | 63.5 |
Chronic health condition
| Index CWD exposed to DFV (n=62) N | Index CWD exposed to DFV (n=62) % | Index CWD no DFV (n=27) N | Index CWD no DFV (n=27) % | Total index CWD (n=96) N | Total index CWD (n=96) % | |
|---|---|---|---|---|---|---|
| Chronic health condition | 15 | 21.7 | 4 | 14.8 | 19 | 19.8 |
| No recorded chronic health condition | 54 | 78.3 | 23 | 85.2 | 77 | 80.2 |
Physical disability
| Index CWD exposed to DFV (n=62) N | Index CWD exposed to DFV (n=62) % | Index CWD no DFV (n=27) N | Index CWD no DFV (n=27) % | Total index CWD (n=96) N | Total index CWD (n=96) % | |
|---|---|---|---|---|---|---|
| Physical disability | 8 | 11.6 | 0 | 0.0 | 8 | 8.3 |
| No recorded physical disability | 61 | 88.4 | 27 | 100.0 | 88 | 91.7 |
Intellectual disability
| Index CWD exposed to DFV (n=62) N | Index CWD exposed to DFV (n=62) % | Index CWD no DFV (n=27) N | Index CWD no DFV (n=27) % | Total index CWD (n=96) N | Total index CWD (n=96) % | |
|---|---|---|---|---|---|---|
| Intellectual disability | 15 | 21.7 | 4 | 14.8 | 19 | 19.8 |
| No recorded intellectual disability | 54 | 78.3 | 23 | 85.2 | 77 | 80.2 |
Developmental delay
| Index CWD exposed to DFV (n=62) N | Index CWD exposed to DFV (n=62) % | Index CWD no DFV (n=27) N | Index CWD no DFV (n=27) % | Total index CWD (n=96) N | Total index CWD (n=96) % | |
|---|---|---|---|---|---|---|
| Developmental delay | 31 | 44.9 | 9 | 33.3 | 40 | 41.7 |
| No recorded developmental delay | 38 | 55.1 | 18 | 66.7 | 56 | 58.3 |
Speech and language delay
| Index CWD exposed to DFV (n=62) N | Index CWD exposed to DFV (n=62) % | Index CWD no DFV (n=27) N | Index CWD no DFV (n=27) % | Total index CWD (n=96) N | Total index CWD (n=96) % | |
|---|---|---|---|---|---|---|
| Speech and language delay | 15 | 21.7 | 6 | 22.2 | 21 | 21.9 |
| No recorded speech or language delay | 54 | 78.3 | 21 | 77.8 | 75 | 78.1 |
Nature of domestic and family violence
The 45 families with a child with disability who were reported to child protection in the region between July and December 2016 and also had DFV recorded make up 16.1 per cent of all 280 families, and 72.6 per cent of families with a child with disability. The information contained in the intake reports was varied in nature, and detail about DFV included a range of verbal, emotional and psychological abuse and physical violence.
The DFV recorded for these families was varied. For some families, there was limited information about the specific violence within the family. For example, reports contained detail about the presence of DFV between parents of the child with disability. For other families, reports highlighted that there were frequent DFV incidents in the household or concerns about the father’s violence towards the mother throughout the relationship.
For many families, the DFV was chronic. For one family in the sample, a summary of previous information reported to child protection documented 13 years of chronic DFV. Another family, who had previous reports about DFV occurring in 2014, also had a current report in 2016 about exposure to DFV. For other families, the violence was noted in the report as having occurred historically, with the violence either no longer being present or not reported to child protection during the study period. For example, one family’s report noted a child protection history for the family which included “DV [domestic violence] between the parents”, however there was no other mention of DFV in the reports.
Child protection reports included details about physical violence, including physical assault between intimate partners. The perpetrators of violence in the reports were usually the children’s fathers or stepfathers, or the mother’s partner. Examples from the intake reports included hitting, punching, choking, arm-twisting, and attacking with knives and bottles. There were reports of the physical injuries sustained by women perpetrated by their partners and the other effects of such violence, including mental health impacts and alcohol or drug use. Reports for these families also contained concerns about threats to harm or kill the other intimate partner, and details about verbal abuse, property damage and the presence and breaches of intervention orders.
Complexity of family context
The intake reports included detail of often complex experiences of DFV that intersected with other risk factors (e.g. use of alcohol and other drugs, unmanaged/unsupported mental health issues and criminal behaviour) and indicators of abuse and neglect of children, including emotional abuse and sexual abuse. While no detailed assessment of these factors was conducted as part of this study, the complex contexts of child abuse and neglect have been documented in other research conducted with this sample and other child protection samples (Arney et al., 2018; Meiksans, Arney et al., 2021; Meiksans, McDougall et al., 2021; Octoman et al., 2021). The complexity among families may be heightened by the intersection with disability, as is described below. Similarly, the complexity within families may also serve to increase the likelihood of disability – for example, experiences of abuse and neglect in childhood and contemporaneous exposure to domesticviolence have been identified as risk factors for alcohol consumption during pregnancy (Frankenberger et al., 2015; McQuire et al., 2020), which contributes to fetal alcohol spectrum disorders. While it was not possible to draw a causal relationship between DFV and disability in the sample described here, the relationship between disability and exposure to violence has been documented elsewhere (Litrownik et al., 2003; Sullivan & Knutson, 2000).
Further, the complexity within families may compound experiences of neglect (e.g. the association between chronic alcohol and other drug use and neglect, which may be greater among children with disability, who have higher needs). This created family environments in which children with disability experienced neglect, physical abuse, exposure to substance use and the impact of unsupported parental mental health problems.
In conjunction with DFV, multiple risk factors resulting in unsafe home environments or adverse outcomes for children with disability were common across the sample. For example, one child with chronic health issues, who lived with their mother and siblings, was exposed to risk factors and neglect, as well as to chronic DFV. The family home was reported to be unhygienic and unsafe, with pest infestation, decaying food and hazardous items accessible to the children. The mother also had substance use issues and custody disputes with the father of one of the children, and struggled to cope with financial instability. The report also included concerns that a child with chronic health issues had not been provided medication, impacting their health outcomes.
DFV was also reported to be precipitated by substance use. For example, in one family group, the mother reported using substances as a way of coping with the DFV she was experiencing. This resulted in a range of additional risk factors for the two children with ASD, developmental delays, and speech and language delays in the family group. These risk factors included maternal drug use during pregnancy; the mother feeling unable to care for the children, engage with DFV services, or prioritise the children’s safety; and the mother experiencing mental health issues associated with her drug use.
Domestic and family violence and disability
Twenty-one of the 45 family groups experiencing DFV and including a child with disability were identified as containing one or more examples of the themes relating to DFV and disability. The remaining 24 families that included a child with disability and DFV contained information recorded in the intake reports about the presence of DFV and the presence of a child with disability in the family, but did not contain any specific detail about the exposure of DFV for the child with disability. These links were categorised thematically. The thematic categories relating to DFV and disability are now described in turn.
Theme 1: Child with disability experienced trauma as a result of DFV (n=17)
For 17 families, reports contained some information about children with disability showing signs of trauma, described as being scared, distressed, anxious, or having behaviour problems, in response to DFV that they had been exposed to. While children being unfazed by DFV is also an indicator of concern, this was generally not captured in the intake reports.
For eight families, child protection reports contained descriptive detail about the child with disability being “scared” or feeling “unsafe” in response to DFV. For example, one family that included two children with ASD and their siblings were described as being scared after witnessing their father being assaulted by his male partner and threatening to kill himself. For another family, a child with chronic health issues witnessed their mother being violently assaulted by her partner. The child was concerned that their mother had died and was reported as shaken and pale. One family group specifically identified that the children were feeling unsafe in their environment. For example, in one family that included two children with developmental delays, intellectual disabilities, and speech and language delays, the children were reported as feeling unsafe in response to the DFV in their home environment.
For four families there were reports that children with disability were distressed in response to DFV. For example, in one family with two children with disability (including ASD, intellectual disability, developmental delay, and speech and language delay), the children witnessed their father verbally abusing their mother, and threatening to have the children placed in foster care. These threats were reported to be persistent and escalating, causing distress to the children. In another family group, a psychological assessment had been undertaken on a child with speech and language delay, which found the child to be acutely traumatised by the DFV in their family. A child with a speech and language delay was reported as feeling anxious in a family group where the DFV had become physical abuse of the child. In another family group, which included a child with ASD, the child was reported to be distressed and crying in an environment where the DFVhad also translated into physical abuse of the child.
For four families, reports contained information about children’s responses to their exposure to DFV, which included behavioural concerns or responses. For example, in one family with multiple children with disabilities, information about the children’s distress was described following a DFV incident in which the parents were arguing in front of the children, during which the mother threatened to cut her wrists with a knife and yelled comments at the children. During this incident, one of the children had packed their bags, wanting to leave home. In another family, a child with developmental delay was reported as being distressed after witnessing a verbal argument between their father and mother. In this family, concerns were documented in the report about the children’s exposure to DFV causing behavioural issues. In another family group, a child with ASD and a speech and language delay was living in an environment of chronic DFV. In thisfamily group, the children were reported to be locking themselves together in one room, occasionally leaving the room for food. The children were reported to be frightened of their father and were themselves displaying aggressive behaviours.
For one family group, the report explicitly detailed that the child had significant development delays experienced as a possible result of the highly violent environment in which they had lived for the first four years of their life. As a result of the limited contextual and historical information available, it was not possible to reveal further detail about this finding nor about the possibility that other children experienced disabilities as a result of DFV.
Theme 2: The perpetrator of the DFV also directed violence towards children with disability (n=7)
For seven of the family groups, the perpetrator of the DFV also perpetrated violence (physical abuse) toward the child with disability. In some family groups, these children were also reported to use violence themselves. Information on the violence used by children was not highly descriptive, though children were variously described as fighting with each other (within their sibling group) and being “very violent”.
Children with disability were both exposed to DFV and were the subject of violence themselves in these families. For example, a child with ASD and a speech and language delay was living in an environment of chronic DFV, in which the father had begun to hit the child when they made mistakes in their homework. In another family with a child with ASD, the child and their siblings would return with bruises after fortnightly access visits to a father who had been a perpetrator of DFV. The child with ASD reported that their father had punched and pushed them.
In one family group with two children with developmental delays, the children witnessed ongoing violence, including during custody handovers. Concerns were raised in the intake report about the father’s aggression and violence also being directed towards the children, potentially causing behavioural issues, with one of these children described as being very violent.
For at least two of these families, the disability precipitated the physical abuse. For one child with a chronic health condition, aggression and abuse were directed toward the child regarding the monitoring and management of their condition. The father in a second family had begun to direct his violence toward a child with ASD when the child wouldn’t stop crying, in an apparent attempt to control the child’s behaviour.
Theme 3: Violence negatively impacted service access for children with disability (n=3)
This study found that children with disability also experienced challenges in receiving support from services because of the DFV in their families. The reports identified that three family groups in this study experienced an impact on access to services. For example, worker safety issues were raised by notifiers as factors that could or were already impacting the provision of home-based support, including one disability service and one parenting support service. A child with disability in the third family group was deemed unable to be referred to a mental health service, despite concerns about self-harm and suicidal ideation, due to the presence of violence in the family.
Theme 4: Intervention order breaches occurred (n=2)
For two family groups in this study, the reports contained details of breaches of no-contact intervention orders where the child with disability had contact with a parent/caregiver that was the defendant. Breaches of intervention orders heightened the risk of exposure of children with disability to violent parents.
In one family group, in contravention of a no-contact intervention order, the parent/caregiver allowed the children to have contact with the other parent/caregiver due to mental health concerns and the lack of support in managing as a single parent of a child with ASD, intellectual disability and challenging behaviour. In the second family group, concerns related to a child with ASD and developmental delay catching public transport on their own to visit the other parent, against whom there was an intervention order in which the child was a protected person.
Theme 5: Disabilities of children presented added complexity to escaping DFV (n=2)
For two family groups in this study, the disabilities of the children presented an added complexity to escaping DFV.
In one family group, which included a child with ASD, the mother had to decline alternative housing due to its lack of suitability for the safety of her child and the children’s behaviour support needs (it was a double-storey property). The second family group were living in a house owned by the paternal grandparents, though the mother and father were separated. This presented complications for the DFV situation, as the father gained access to the home and continued to perpetrate violent behaviour toward the mother and children, despite him officially residing at a different address. The ongoing presence of violence in the home has resulted in this family being one that services will not visit due to worker safety issues. Both families were working with a disability service to gain suitable housing; however, the service with which the second family is working will not visit due to DFV.
Discussion: Phase 1B – Case file analysis
Children with disability are over-represented in the present sample of children and their families when compared to families with children with disability in the Australian population. As with Phase 1A, this higher prevalence is consistent with previous research that has found children with disability have a higher risk of exposure to violence and child protection involvement compared to their non-disabled peers (Jones et al., 2012; Maclean et al., 2017). The present study identified that of the 280 South Australian families known to child protection, 22 per cent included at least one index child with disability. Previous statistics highlight that in 2003, 13 per cent of families in Australia were identified as including a child with disability (ABS, 2008a). There is, however, limited information in the literature as to why this over-representation might occur.
The violence in the families in this study included verbal, emotional and psychological abuse, and physical violence. For many families, the violence was chronic. For other families, the violence was historical, with the violence no longer occurring due to the removal of a violent partner from the life of the family. For some families, the violence was occurring in the context of other complex risk factors (e.g. use of alcohol and other drugs, unmanaged/unsupported mental health issues and criminal behaviour) and indicators of abuse and neglect of children, including emotional abuse and sexual abuse. Consistent with other qualitative studies of child protection records, the information provided in the intake reports, particularly regarding historical violence, often lacked specific detail (Meiksans, McDougall et al., 2021).
Five themes relating to DFV and disability were identified in the narratives of the intake reports for 21 of the families included in this study. These included two themes related to the impact of violence on the children, including the traumatisation of children as a result of witnessing DFV and exposure of children with disability to violent parents through intervention order breaches. A further two themes described how children’s disability impacted access to needed services and support. Finally, one theme related to the presence of additional risk factors, including violence directed towards the children with disability (physical abuse).
The findings of this study are now discussed with regard to the exposure of children with disability to DFV; the complexity of the contexts of DFV in this sample; and the obstacles to services and supports for children with disability and their families. Limitations of the study are also discussed, together with directions for future research and implications and recommendations for policy and practice.
The exposure of children with disability to DFV
The findings of this study indicate that in families known to child protection, children with disability are exposed to family violence at similar levels as families that have not been recorded as including an index child with disability. Of the 62 families in this study that included children with disability, the majority (72.6%) were exposed to DFV. For the 218 families that did not include an index child with disability, 73.9 per cent were exposed to DFV.
Within the present child protection sample, families who include an index child with disability and families who are not recorded to include an index child with disability have similar proportions of violence. This exposure to DFV is similar to the presence of domestic violence identified for child protection samples in the broader sample and in previous research. The whole sample of 280 families known to child protection identified that almost three quarters of families had DFV recorded in their child protection reports (Arney et al., 2018). Another study of a sample of prenatal child protection reports from a single Australian jurisdiction in 2014 found that 70 per cent had reports to child protection in the prenatal period, which included concerns about current or previous intimate partner violence (Meiksans, McDougall et al., 2021). While children with disability are significantly more likely than children without disability to be exposed toviolence (Australian Institute of Health and Welfare, 2020; Jones et al., 2012; Robinson et al., 2020), the similar proportions described by the present child protection sample may be due to insufficient detail about children with disability within the intake reports.
The reports analysed in this study revealed a picture of families in which the children were described as being scared, distressed or anxious as a result of the DFV that they had witnessed. Children were variously reported to be acutely traumatised, displaying behavioural problems associated with DFV, unable to seek comfort from violent parents, visibly crying and distressed, and expressing fear of or worry about their parents. While not all children with disability are at increased risk from DFV, there are additional or prolonged risks for children with disability apparent in this study, making clear that both children and their parents are not well supported by services. For example, within the sample, children were exposed to violent parents in breach of intervention orders. In one family, this contact took place in order to manage both the child’s “behaviours” and the mental health of the protected parent.
In the present sample, the explicit link between chronic DFV exposure and developmental delay in early childhood was recorded by only one notifier for one family. Despite this, it is possible that for many children in this study, the timing, chronicity and severity of violence exposure, and exposure to other types of child abuse and neglect, was the cause of, or related to, at least some of the disabilities of the index children with disability. Previous research has reported that chronic exposure to, or experience of, DFV is associated with impaired cognitive functioning, behavioural problems, learning difficulties, trauma and poor mental wellbeing (Campo, 2015; Jaffe et al., 2012; Kerns et al., 2015; Margolin & Vickerman, 2011). The complexity within families identified in this study, and identified in previous research, also suggests that exposure to DFV often co-occurs with other types of risk or abuse and neglect within families (Bromfield etal., 2010; Meiksans, Arney et al., 2021). Without support, the impact of exposure to DFV and other risks can have a long-lasting effect on children.
There is a need for children’s disability and mental health services to collaborate and to understand the aetiology in the symptoms that children with disability display. Research highlights that some of the symptomatology may be related to experiences of trauma, including exposure to DFV (Kerns et al., 2015), which may exacerbate or mirror the symptoms of the disability. It should be ensured that therapeutic supports are offered that are accessible, affordable and responsive to the experiences of children with disability who are exposed to DFV.
The complexity of DFV contexts
In many families, home life was chaotic, with violence being one part of this picture. While 45 family groups in this study included DFV, other factors that negatively impacted the children with disability in the family were also present. Studies reporting on detrimental and long-lasting effects of DFV for children have highlighted that DFV tends to be experienced in families where other risk factors and indicators of abuse and neglect are also present (Moore et al., 2020). In the present study, these included parental substance use, physical abuse of the children, neglect (including medical neglect), other emotional abuse, sexual abuse, and mental health issues for both children and parents. Previous analysis of the sample of 280 families reported to child protection identified that three quarters of families had DFV identified in the intake reports, over half of families had alcohol or other drug use or mental health concerns identified, and over 40per cent had parental criminal behaviour identified (Arney et al., 2018). Research undertaken by Maclean and colleagues (2017) also identified that for children and young people with disability, socio-economic disadvantage, maternal mental health, teenage parents and substance use admissions were risk factors for maltreatment.
DFV is itself complex, and this complexity is compounded by its interaction with other adversities experienced by families. Disability, though not itself a risk factor, may be associated with an increased impact or risk for children with disability if support services and resources are not available to families, appropriate to their needs, or engaged with them. In conjunction with DFV, multiple risk factors resulting in dangerous home environments or adverse outcomes for children with disability were common across the sample.
Obstacles to services and supports for children with disability and their families
Children with disability who are experiencing DFV and are known to the child protection system are often in contact with multiple systems and support services. A constellation of service systems can come into play to support children in this situation, including child protection systems and DFV and disability services, including the NDIS and therapeutic or targeted services. However, some children in this study experienced barriers to accessing disability and DFV services and other support services. Two obstacles to accessing services were identified as especially important.
As previously described, immediate safety concerns relating to the DFV were an obstacle. For example, families experienced barriers to accessing services (a disability service and a parenting support service) because of worker safety issues. At the same time, one child could not access a mental health service due to the current violence in the family, which made the child ineligible for the service. While worker safety is a key concern in responding to critical incidents, lack of support compounds problems for children and families. One study highlights multidisciplinary teams as a possible way of managing safety without compromising needed service provision (Humphreys et al., 2020).
The second obstacle was the absence of suitable accommodation for women with children with disability experiencing DFV. Two women in the study were unable to escape DFV due to the difficulties of finding suitable accommodation that would meet the needs of their children. While both families were in the process of working with a disability service to gain suitable housing, previous studies have identified the lack of mainstream understanding of housing requirements for people with disability (Dyson et al., 2017; Thiara et al., 2011). Several studies have highlighted the barriers faced by women with disability in escaping DFV. These obstacles are further compounded when there are children with disability, ranging from inappropriate services or interventions to social constructions and understandings of disabilities (Nixon, 2009; Thiara et al., 2011; Women with Disabilities Australia, 2007).
Obstacles such as ongoing violence in the family and the lack of suitable accommodation fail to make use of existing policy and practice (particularly through the NDIS), and to support both children and families more proactively to respond to the gaps in parenting support for children with additional support needs, particularly in high-intensity areas such as behaviour support.
These findings broadly support the service recommendations of previous studies of both children with disability and women with disability and the obstacles to accessing services and supports, including DFV services and disability services (COAG, 2011; Robinson, Frawley et al., 2021). These studies suggest that services must be well-resourced, collaborative, wraparound supports with continuity of care if they are to provide disability support and to address child protection risk reduction and family violence (Corr & Milagros Santos, 2017; Dyson et al., 2017; MacLean et al., 2017; McDonald & Rosier, 2011; Robinson, valentine et al., 2021). A learning from this study is that, while appropriate services might be available, these supports should neither be impossible to deliver during critical incidents nor only be made available during such times. Instead, a service response that can be both preventative and responsive to the multiple factorsthat families might live with and encounter is needed.
Strengths and limitations of case file analysis
The challenge for defining disabilities in the context of the child protection intake reports is the limited or subjective information about disabilities contained therein. These reports don’t tend to capture information on the functional capacities of children with disability, whether they have received a diagnosis, how they would describe their disability, how they experience or are impacted by the disability they may have been born with or acquire, and indeed, whether the information provided is correct.
Therefore, due to the descriptive limitations in the data, the disability categories used in this study were necessarily broad in order to capture disability types about which limited information was provided. In addition, chronic health conditions that are not included in the NDIS categories were included, such as cystic fibrosis, epilepsy, asthma, and diabetes. This additional category was included following discussion with our advisory group and a review of the literature because, if these conditions are unmanaged, they would impact on individuals’ functional capacity. The disability categories used by the Phase 1B study were:
- ASD
- developmental delay
- intellectual disability
- physical disability
- speech and language delay
- chronic health conditions.
A key strength of the case file analysis is that it utilised narrative detail contained in child protection reports to understand the nature and extent of disability and DFV that children with disability in families known to the child protection system were exposed to. Child protection reports provide rich narrative information about the concerns reported to child protection from notifiers. This study used and synthesised the information provided across the life of the family for each child within the family to provide a narrative about child protection concerns, including DFV exposure, over childhood. While this provides a rich summary of information, the order of events could not always be established, and therefore the timing of the emergence of disability and DFV could not be specifically explored in this study.
A limitation of such administrative data is that it is collected as a part of the day-to-day operation of the child protection department to support service delivery and for recordkeeping purposes (Woollard, 2014). These datasets are not collected for research purposes and the nature of and existence of disability identified in the reports is largely reliant on the information known and reported by the notifier. The notifier may not be aware of any assessment or diagnostic information regarding children nor all details about the family context. Further, the study used only the most recent child protection reports for each family. While these reports contain very brief summaries of previous reports, it’s possible that for all 280 families in the sample, information about children’s disability or the extent and nature of DFV within the family is not contained in these more recent reports. Thus, a limitation of this study is that only informationcontained in the most recent report narratives could be coded; information about disability or domestic violence that is not contained in the reports is therefore unknown and could not be included in this study.
This study utilised a child protection-specific sample, where all families were known to the child protection system. Therefore, consideration of the findings needs to be interpreted based on this type of sample. Children and families included in this sample may have had varied involvement with child protection, including previous reports, investigations, or experiences in out-of-home care. It is possible that there may be more monitoring or surveillance for families known to child protection because of the other services involved in the family. Having more services involved may increase the reporting or information and concerns known to child protection; however, it does not invalidate these reports made to child protection. This sample also only included a small sample of families who represent a discrete metropolitan region of a single Australian jurisdiction.
A further limitation is that for some families, the direct exposure to DFV of children with disability was not clear in the intake reports. Some reports directly stated that the children witnessed incidents of violence or were exposed to the violence; however, not all cases had the details of the level of exposure for the index children with disability.
Directions for future research
The complexity of the pathways for children with disability and their exposure to DFV is difficult to elucidate and requires mixed-method research to provide a more comprehensive understanding to determine risk reduction and prevention strategies. Including the voices of children with disability and their families is key to ensuring this comprehensive understanding of how we can support families in the reduction and prevention of domestic violence but also the support that families require in the provision of safety and support interventions.
This research was conducted using a select sample of children and families in one jurisdiction. Future research should explore the utilility of technology to conduct population-level analysis, or alternatively utilise a consistent and regular collection and analysis for a larger sample of families to understand children with disability’s exposure to DFV. Given the high level of involvement of children with disability in child protection and the high level of DFV, there is a need to examine whether services have the resources and skills to meet the needs of children with disability and their families. Examination of multidisciplinary wraparound responses to ensure that the needs of the children with disability and the needs of their parents/caregivers and other family members are also met is required. The qualitative component of this program of research is essential to identify the barriers and enablers for access to services specifically for familieswith children with disability and to capture the experience of DFV for children with disability.
The research identified descriptive limitations in the data that restricted the understanding of the data in Phase 1B. While there is increasing recognition of the integral role quality recordkeeping plays in child safety and wellbeing (Eberhard, 2015; Evans et al., 2020; Ogle et al., 2022; Reed et al., 2018), the challenges of quality child-centred case recording among child protection practitioners, particularly concerning children with disability, remain opaque and require further research.
Additional implications and recommendations for policy and practice
This study provides evidence of the need to better identify the prevalence of DFV and disability in routine data collection and the opportunities to make better use of administrative data. It found an over-representation of families of children with disability within the child protection reports. This is consistent with previous research (Jones et al., 2012; Maclean et al., 2017). However, for those families reported to child protection, families with and without a child with disability had similar proportions of exposure to DFV.
There is a need to consider in policy and practice how to better support children with disability and their parents/caregivers, noting that any policy and practice changes necessarily include ongoing, accessible consultation with children with disability and their families and advocates, as well as ongoing evaluation. Within this study, children were identified as being scared or distressed in response to their exposure to violence. Some cases indicated that children were highly traumatised as a result of the violence they witnessed with concerns regarding the impact on their development, behaviour, cognition, and wellbeing. Access to services and supports to ensure children with disability feel safe and supported is vital. Support for parents and caregivers is also an important consideration. Parents and caregivers need access to resources, services and supports to enable appropriate and safe housing for families and mental health supports that meetthe needs of families with children with disability. Other specific implications for policy and practice are as follows:
- DFV is often one factor within a complex context of child abuse and neglect. This complexity presents a compounding picture of risk for children with disability. A disability, child protection and DFV service response that is both preventative and responsive to the multiple factors that families might live with and encounter is needed.
- It is important that exclusion or ineligibility from a service does not prevent families from receiving the support that they need. For example, if a disability service cannot work with a child until safety concerns are addressed, then alternative sources of this support are needed. Families with multiple support needs often require specialised support and time to build trust with staff, especially if child protection agencies are involved or families fear their involvement.
- The significance of first-response services such as hospitals and police was evident. Ensuring these practitioners are well-skilled in meeting the needs of families and children with disability is essential, particularly given the high proportion of children with disability in families experiencing violence that use these services.
- The provision of suitable alternative accommodation for women with children with disability who are experiencing DFV is needed, as is ensuring improved knowledge and skills in addressing housing requirements for people with disability. There should be provision of appropriate services and support to ensure children can remain in the home when it is safe to do so.
- Workforce development is also important. Training and resources are needed across sectors to improve support for, and knowledge of, the additional needs of children with disability and their families. Consideration needs to be given to supports for children to address development and wellbeing, as well as parents who may require support to attend mental health and/or substance use services.
- Supports and responses for families with children with disability require flexibility in delivery to address ongoing needs, particularly in families with complex and chronic challenges, as well as the delivery of supports to respond to critical incidents. This requires addressing structural barriers to ensure comprehensive training, policies and referral protocols for DFV with knowledge of intervention, support or referral pathways that are tailored to individual circumstances and needs (Hudspeth et al., 2022). Moreover, therapeutic supports should be offered that are accessible, affordable and responsive to the experiences of children with disability who are exposed to DFV.
- Our finding that a substantial proportion of children with disability exposed to DFV have psychological and developmental support needs is important. Crisis and counselling support services need to be equipped to respond to the needs of children with disability in these families, and resourced to support them effectively.
- Almost two in three children with a mother hospitalised for assault were born in the most socio-economically disadvantaged areas (1st and 2nd quintiles) and outer regional or remote areas. This has implications for regional and remote resource needs and service provision to address DFV, particularly for families that have additional needs in relation to supporting children with disability.
Conclusions from linked data and case file analysis
The first phase of this project was undertaken to examine the nature and extent of DFV that children with disability are exposed to. Utilising linked population-level data has enabled us to ascertain the prevalence of children with disability exposed to DFV in Western Australia. Children with disability have double the exposure to a mother hospitalised for assault compared to the general population of children. Children with disability are also far more likely than the population of children to have child protection involvement and entry into out-of-home care. Children with disability make up approximately 30 per cent of those children exposed to domestic violence, as identified through the police and hospitalisation data. Children with disability make up 32 per cent of children involved in child protection and 36 per cent who enter out-of-home care.
These findings show the substantial support and resources required for children with disability and their families in services and systems. Our results also highlight the over-representation of Aboriginal and Torres Strait Islander children with disability and the increased proportion of children with disability in regional and remote areas exposed to DFV. It also highlights the importance of the Close the Gap targets for a 50 per cent reduction in all forms of family violence and abuse against Aboriginal and Torres Strait Islander women and children and a 45 per cent reduction in the rate of Aboriginal and Torres Strait Islander children in out-of-home care by 2031 (Australian Government, 2021). This provides evidence for the crucial need for service provision that is culturally appropriate for Aboriginal and Torres Strait Islander families and that regional and remote areas have adequate access to services which meet their needs. Aboriginal andTorres Strait Islander-led research that addresses the evidence and monitoring for prevention and intervention strategies are essential directions for future research.
This project has also been able to describe what is known about the nature and extent of exposure to DFV for children with disability reported to child protection. Through analysis of a sample of the intake reports of 280 families in South Australia, 62 families were identified as including a child with disability reported to child protection between July and December 2016, and this study found that 45 of these family groups had exposure to DFV. This study has identified that children with disability are over-represented in the sample of children and their families compared to children with disability in the Australian population.
Overall, this study shows a picture of highly complex contexts of abuse and neglect, of which DFV is one feature, and the obstacles to services and supports experienced by children with disability and their families. This study has provided a deeper insight into the exposure to DFV for children with disability. It lays the groundwork for future research into service provision and access for children with disability and describes implications for policy and practice around the understanding of DFV and the design of preventative and responsive services and supports. Given the high proportion of families with a child with disability who would be accessing health services, it is also important to address structural barriers for health professionals and for health systems to have comprehensive training, policies and referral protocols for DFV with knowledge of intervention or referral pathways (Hudspeth et al., 2022). While our study has focused onadministrative data and case file reviews to understand the prevalence and nature of DFV in children with disability, our broader project also aims to capture the voices of children and families who experience DFV and the facilitators and barriers to service provision, which is covered in our final report (Robinson et al., 2022). Importantly, children with disability and their families need to have a voice in how these services can be tailored to meet their needs, and greater research and prevention efforts need to be dedicated to reducing the risk of DFV exposure.
References
Arney, F., Chong, A., Taylor, C., & Octoman, O. (2018, September 2–5). Identifying factors associated with families with repeat involvement with child protection [Conference presentation]. International Society for the Prevention of Child Abuse and Neglect (ISPCAN) 22nd International Congress on Child Abuse and Neglect, Prague, Czech Republic.
Australian Bureau of Statistics. (2008a). Australian social trends 2008. https://www.ausstats.abs.gov.au/ausstats/subscriber.nsf/0/DE5DE30C9CF6E5E3CA25748E00126A25/$File/
41020_2008.pdf
Australian Bureau of Statistics. (2008b). Socio-Economic Indexes for Areas (SEIFA) – Technical paper. ABS.
Australian Bureau of Statistics. (2011). Australian and New Zealand Standard Offence Classification (ANZSOC). https://www.abs.gov.au/AUSSTATS/abs@.nsf/Lookup/1234.0Main+Features12011?OpenDocument
Australian Bureau of Statistics. (2018). Australian Statistical Geography Standard (ASGS): Volume 5 – Remoteness structure, July 2016. https://www.abs.gov.au/ausstats/abs@.nsf/mf/1270.0.55.005
Australian Bureau of Statistics. (2019a). Disability, Ageing and Carers, Australia: Summary of findings. ABS. https://www.abs.gov.au/statistics/health/disability/disability-ageing-and-carers-australia-summary-findings/latest-release
Australian Bureau of Statistics. (2019b). National Aboriginal and Torres Strait Islander Social Survey, 2014–15. https://www.abs.gov.au/ausstats/abs@.nsf/Lookup/by%20Subject/4714.0~2014-15~Feature%20Article~Aboriginal%20and%20Torres%20Strait%20Islander%20women’s%20experiences%20of%20family%20and%20domestic%20violence%20(Feature%20Article)~10100
Australian Bureau of Statistics. (2020). Partner violence – In focus: Crime and justice statistics. https://www.abs.gov.au/statistics/people/crime-and-justice/focus-crime-and-justice-statistics/partner-violence-january-2020
Australian Institute of Family Studies. (2019). Child protection and Aboriginal and Torres Strait Islander children. AIFS.
Australian Institute of Health and Welfare. (2019). Family, domestic and sexual violence in Australia: Continuing the national story 2019 – In brief. Cat. no. FDV 4. https://www.aihw.gov.au/getmedia/b180312b-27de-4cd9-b43e-16109e52f3d4/aihw-fdv4-FDSV-in-Australia-2019_in-brief.pdf.aspx?inline=true
Australian Institute of Health and Welfare. (2020a). Australia’s children. https://www.aihw.gov.au/reports/children-youth/australias-children/contents/health/the-health-of-australias-children
Australian Institute of Health and Welfare. (2020b). People with disability in Australia. Cat. no. DIS 77. https://www.aihw.gov.au/getmedia/ee5ee3c2-152d-4b5f-9901-71d483b47f03/aihw-dis-72.pdf.aspx?inline=true
Australian Institute of Health and Welfare. (2021). Child Protection Australia 2019–2020. Cat. no. CWS 78. https://www.aihw.gov.au/getmedia/c3b0e267-bd63-4b91-9ea6-9fa4d14c688c/aihw-cws-78.pdf.aspx?inline=true
Australian Institute of Health and Welfare. (2022). METEOR: Metadata online registry – Disability group code N. https://meteor.aihw.gov.au/content/index.phtml/itemId/316280
Bragg, H. L. (2003). Child protection in families experiencing domestic violence. US Department of Health and Human Services.
Brain Injury Australia. (2018). The prevalence of acquired brain injury among victims and perpetrators of family violence. https://www.braininjuryaustralia.org.au/wp-content/uploads/BRAININJURYAUSTRALIAfamilyviolencebraininjuryFINAL.pdf
Bromfield, L., Lamont, A., Parker, R., & Horsfall, B. (2010). Parenting and child abuse and neglect in families with multiple and complex problems. Child Abuse Prevention, 33. Australian Institute of Family Studies. https://aifs.gov.au/sites/default/files/publication-documents/issues33_0.pdf
Campo, M. (2015). Children’s exposure to domestic and family violence: Key issues and responses. CFCA Paper 36. Australian Institute of Family Studies. https://aifs.gov.au/cfca/sites/default/files/publication-documents/cfca-36-children-exposure-fdv.pdf
Campo, M., & Tayton, S. (2015). Domestic and family violence in regional, rural and remote communities. Australian Institute of Family Studies. https://aifs.gov.au/cfca/sites/default/files/publication-documents/cfca-resource-dv-regional.pdf
Commonwealth of Australia. (2019). Fourth Action Plan of the National Plan to Reduce Violence against Women and their Children 2010–2022. Commonwealth of Australia. https://www.dss.gov.au/women-publications-articles-reducing-violence/fourth-action-plan
Commonwealth of Australia, Department of Prime Minister and Cabinet. (2021a). National Agreement on Closing the Gap. Commonwealth of Australia.
Commonwealth of Australia, Department of Prime Minister and Cabinet. (2021b). Closing the Gap: Commonwealth Implementation Plan. Commonwealth of Australia. https://www.niaa.gov.au/sites/default/files/publications/commonwealth-implementation-plan-130821.pdf
Commonwealth of Australia (Department of Social Services). (2021). Safe and Supported: The National Framework for Protecting Australia’s Children 2021–2031. Commonwealth of Australia. https://www.dss.gov.au/sites/default/files/documents/12_2021/dess5016-national-framework-protecting-childrenaccessible.pdf
Corr, C., & Milagros Santos, R. (2017). Abuse and young children with disabilities: A review of the literature. Journal of Early Intervention, 39(1), 3–17. https://doi.org/10.1177/1053815116677823
Council of Australian Governments. (2011). National Plan to Reduce Violence against Women and their Children 2010–2022. https://www.dss.gov.au/sites/default/files/documents/08_2014/national_plan1.pdf
Cross, T. P., Mathews, B., Tonmyr, L., Scott, D., & Ouimet, C. (2012). Child welfare policy and practice on children’s exposure to domestic violence. Child Abuse & Neglect, 36(3), 210–216.
Department for Child Protection (SA). (2020). Disability Access and Inclusion Plan 2020–2024. https://www.childprotection.sa.gov.au/department/about-us/disability-access-and-inclusion-plan
Department of Families, Fairness and Housing. (2020, May 11). National Disability Insurance Scheme (NDIS) – Child and family system interface. https://providers.dffh.vic.gov.au/ndis-child-and-family-system-interface-practice-guidelines
Dion, J., Paquette, G., Tremblay, K. N., Collin-Vézina, D., & Chabot, M. (2018). Child maltreatment among children with intellectual disability in the Canadian Incidence Study. American Journal on Intellectual and Developmental Disabilities, 123(2), 176–188.
Disability Discrimination Act 1992 (Cth).
Dyson, S., Frawley, P., & Robinson, S. (2017). “Whatever it takes”: Access for women with disabilities to domestic and family violence services (ANROWS Horizons 5/2017). ANROWS.
Eberhard, K. (2015). Unresolved issues: Recordkeeping recommendations arising from Australian commissions of inquiry into the welfare of children in out-of-home care, 1997–2012. Archives and Manuscripts, 43(1), 4–17.
Evans, J., Golding, F., O’Neill, C., & Tropea, R. (2020). “All I want to know is who I am”: Archival justice for Australian care leavers. In Archives, Recordkeeping, and Social Justice (pp. 105–126). Routledge.
Fawcett, B. (2016). Children and disability: Constructions, implications and change. International Social Work, 59(2), 224–234. https://doi.org/10.1177/0020872813515011
Flynn, S. (2020). Theorizing disability in child protection: Applying critical disablity studies to the elevated risk of abuse for disabled children. Disability and Society, 35(6), 949–971. https://doi.org/10.1080/09687599.2019.1669433
Frankenberger, D. J., Clements-Nolle, K., & Yang, W. (2015). The association between adverse childhood experiences and alcohol use during pregnancy in a representative sample of adult women. Women’s Health Issues, 25(6), 688–695.
Fraser-Barbour, E., Crocker, R., & Walker, R. (2018). Barriers and facilitators in supporting people with intellectual disabilty to report sexual violence: Perspectives of Australian disability and mainstream support providers. Journal of Adult Protection, 20(1), 5–16. https://doi.org/10.1108/JAP-08-2017-0031
Glasson, E. J., de Klerk, N. H., Bass, A. J., Rosman, D. L., & Palmer, C. D. J. (2007). Cohort profile: The Western Australian family connections genealogical project. International Journal of Epidemiology, 37(1), 30–35.
Hernon, J., Brandon, M., Cossar, J., & Shakespeare, T. (2015). Recognising and responding to the maltreatment of disabled children: A children’s rights approach. Social Work and Social Sciences Review, 17(3), 61–77. https://doi.org/10.1921/13003170306
Herrenkohl T., Sousa, C., Tajima, E., Herrenkohl, R., & Moylan, C. (2008). Intersection of child abuse and children’s exposure to domestic violence. Trauma, Violence and Abuse, 9(2), 84–99.
Holden, G. W. (2003). Children exposed to domestic violence and child abuse: Terminology and taxonomy. Clinical Child and Family Psychology Review, 6(3), 151–160.
Holman, C. D., Bass, A. J., Rouse, I. L., & Hobb, M. S. (1999). Population-based linkage of health records in Western Australia: Development of a health services research linked database. Australian New Zealand Journal of Public Health, 23(5), 453–59.
Hudspeth, N., Cameron, J., Baloch, S., Tarzia, L., & Hegarty, K. (2022). Health practitioners’ perceptions of structural barriers to the identification of intimate partner abuse: A qualitative meta-synthesis. BMC Health Services Research, 22(1), 96. https://doi.org/10.1186/s12913-022-07491-8
Humphreys, C., & Healey, L. (2017). PAThways and Research into Collaborative Inter-Agency practice: Collaborative work across the child protection and specialist domestic and family violence interface: Final report (ANROWS Horizons 03/2017). ANROWS.
Humphreys, C., Healey, L., & Heward‐Belle, S. (2020). Fathers who use domestic violence: Organisational capacity building and practice development. Child & Family Social Work, 25, 18–27.
Iezzoni. L. I. (2000). Using administrative data to study persons with disabilities. Milbank Q, 80(2), 347–379. https://doi.org/10.1111/1468-0009.t01-1-00007
Jaffe, P. G., Wolfe, D., & Campbell, M. (2012). Growing up with domestic violence: Assessment, intervention, and prevention strategies for children and adolescents. Hogrefe Publishing.
Jones, L., Bellis, M. A., Wood, S., Hughes, K., McCoy, E., Eckley, L., Bates, G., Mikton, C., Shakespeare, T., & Officer, A. L. (2012). Prevalence and risk of violence against children with disabilities: A systematic review and meta-analysis of observational studies. Lancet, 380(9845), 899–907. https://doi.org/10.1016/s0140-6736(12)60692-8
Kerns, C. M., Newschaffer, C. J., & Berkowitz, S. J. (2015). Traumatic childhood events and autism spectrum disorders. Journal of Autism and Developmental Disorders, 45, 3475–3486.
Litrownik, A. J., Newton, R., Hunter, W. M., English, D., & Everson, M. D. (2003). Exposure to family violence in young at-risk children: A longitudinal look at the effects of victimization and witnessed physical and psychological aggression. Journal of Family Violence, 18, 59–73. https://doi.org/10.1023/A:1021405515323
Maclean, M. J., Sims, S., Bower, C., Leonard, H., Stanley, F. J., & O’Donnell, M. (2017). Maltreatment risk among children with disabilities. Pediatrics, 139(4). https://doi.org/10.1542/peds.2016-1817
Madden, R., & Dimitropoulous, V. (2014). The International Classification of Functioning, Disability and Health ICF: What it is and what it can be used for. Interchange Journal of the Health Information Management Association of Australia, 4, 27–29.
Margolin, G., & Vickerman, K. (2011). Posttraumatic stress in children and adolescents exposed to family violence. Couple and Family Psychology, 1(S), 63–73.
McCloskey, L.A, & Walker, M. (2000). Postratumatic stress in children exposed to family violence and single-event trauma. Journal of the American Academy of Child and Aolescent Psychiatry, 39, 108–115.
McDonald, M., & Rosier, K. (2011). Interagency collaboration: Does collaboration benefit children and families? Exploring the evidence. Australian Family Relationships Clearinghouse. https://policywise.com/wp-content/uploads/2016/08/Pre-Reading-Inter-Agency-Collaboration-Briefing-Paper-21-Part-B.pdf
McQuire, C., Daniel, R., Hurt, L., Kemp, A., & Paranjothy, S. (2020). The causal web of foetal alcohol spectrum disorders: A review and causal diagram. European Child & Adolescent Psychiatry, 29(5), 575–594.
Meiksans, J., Arney, F., Flaherty, R., Octoman, O., Chong, A., Ward, F., & Taylor, C. (2021). Risk factors identified in prenatal child protection reports. Children and Youth Services Review, 122. https://doi.org/https://doi.org/10.1016/j.childyouth.2020.105905
Meiksans, J., McDougall, S., Arney, F., Flaherty, R., Chong, A., Ward, F., & Taylor, C. (2021). The nature of domestic and family violence reported to child protection prenatally. Children and Youth Services Review, 120. https://doi.org/10.1016/j.childyouth.2020.105685
Moore, T., Buchanan, F., Chung, D., Chong, A., Fernandes, C., Hawkes, M., Meiksans, J., Moulding, N., Martin, R.,
& Schulze, D. (2020). Fostering safety in families reunifying after violence: Findings from a participatory study with young people and families. Australian Centre for Child Protection, University of South Australia.
National Disability Insurance Agency. (2021a). NDIS Operating Guidelines. List A: Conditions that are likely to meet the disability requirements. https://www.ndis.gov.au/about-us/operational-guidelines/access-ndis-operational-guideline/list-conditions-which-are-likely-meet-disability-requirements-section-24-ndis-act
National Disability Insurance Agency. (2021b). NDIS Operating Guidelines. List B: Conditions that are likely to result in a permanent impairment. https://www.ndis.gov.au/about-us/operational-guidelines/access-ndis-operational-guideline/list-b-permanent-conditions-which-functional-capacity-are-variable-and-further-assessment-functional-capacity-generally-required
National Disability Insurance Scheme Act 2013 (Cth).
https://www.legislation.gov.au/Details/C2021C00540
Nixon, J. (2009). Domestic violence and women with disabilities: Locating the issue on the periphery of social movements. Disability & Society, 24(1), 77–89.
Octoman, O., Arney, F., Chong, A., O’Donnell, M., Meiksans, J., Hawkes, M., Ward, F., & Taylor, C. (2022). A rapid exploratory analysis of the extent of child protection involvement over the life of the family. Child Abuse Review: e2762.
Ogle, J., Vincent, S., & Hawkes, M. (2022). Authenticity, power and the case record: A textual analysis of the participation of children and young people in their child protection conference. Child & Family Social Work, 27(2), 278–286. https://doi.org/10.1111/cfs.12881
Orr, C., Fisher, C., Glauert, R., Preen, D., & O’Donnell, M. (2022). A demographic profile of mothers and their children who are victims of family and domestic violence: Using linked police and hospital admissions data. Journal of Interpersonal Violence, 37(1–2). https://journals.sagepub.com/doi/pdf/10.1177/0886260520916272
Orr, C., Preen, D., Fisher, C., Sims, S., & O’Donnell, M. (2021). Trends in hospital admissions for intimate partner violence in Australian mothers with children born from 1990 to 2009. Journal of Interpersonal Violence, 36
(15–16). https://doi.org/10.1177/0886260519832905
Our Watch. (2018). Changing the picture: A national resource to support the prevention of violence against Aboriginal and Torres Strait Islander women and their children. https://www.ourwatch.org.au
Patel, D. R., & Brown, K. A. (2017). An overview of the conceptual framework and definitions of disability. International Journal of Child Health and Human Development, 10(3), 247–252.
Petterson, B., Leonard, H., Bourke J., Sanders, R., Chalmers, R., Jacoby, P., & Bower, C. (2005). IDEA (Intellectual Disability Exploring Answers): A population-based database for intellectual disability in Western Australia. Annals of Human Biology, 32(2), 237–243. https://doi.org/10.1080/03014460500075035
Productivity Commission. (2019). Report on Government Services 2019, Part B, Chapter 4. Productivity Commission.
Reed, B., Oliver, G., Upward, F., & Evans, J. (2018). Multiple rights in records: The role of recordkeeping informatics. In Archival futures (pp. 99–116). Facet Publishing.
Robinson, S., Frawley, P., & Dyson, S. (2021). Access and accessibility in domestic and family violence services for women with disabilities: Widening the lens. Violence against Women, 27(6–7), 918–936.
Robinson, S., valentine, k., & Idle, J. (2021). Disability and family violence prevention: A case study on participation in evidence making. Evidence & Policy: A Journal of Research, Debate and Practice, 17(2), 315–333.
https://doi.org/10.1332/174426421X16143457505305
Robinson, S., valentine, k., Marshall, A., Burton, J., Moore, T., Brebner, C., & O’Donnell, M. (2022). Connecting the dots: Understanding the domestic and family violence experiences of children and young people with disability within and across sectors: Final report. ANROWS.
Robinson, S., valentine, k., Newton, B. J., Smyth, C., & Parmenter, N. (2020). Violence prevention and early intervention for mothers and children with disability: Building promising practice (Research report, 16/2020). ANROWS.
Royal Commission into Violence, Abuse, Neglect and Exploitation of People with Disability. (2020). Interim report. Commonwealth of Australia. https://disability.royalcommission.gov.au/system/files/2020-10/Interim%20Report.pdf
Russell, A. E., Ford, T., Williams, R., & Russell, G. (2016). The association between socioeconomic disadvantage and attention deficit/hyperactivity disorder (ADHD): A systematic review. Child Psychiatry and Human Development, 47(3), 440–458. doi: 10.1007/s10578-015-0578-3
Spencer, N. J., Blackburn, C. M., & Read, J. M. (2015). Disabling chronic conditions in childhood and socioeconomic disadvantage: A systematic review and meta-analyses of observational studies. BMJ Open, 5, e007062. https://doi.org/10.1136/bmjopen-2014-007062
Sullivan P., & Knutson, J. (2000). Maltreatment and disabilities: A population based epidemiological study. Child Abuse and Neglect, 24(10), 1257–1273. https://doi.org/10.1016/S0145-2134(00)00190-3
Taylor, C. (2008). Trafficking in facts: Writing practices in social work. Qualitative Social Work, 7(1), 25–42.
Thiara, R. K., Hague, G., & Mullender, A. (2011). Losing out on both counts: Disabled women and domestic violence. Disability & Society, 26(6), 757–771.
United Nations. (1989, November 20). United Nations Convention on the Rights of the Child. https://www.ohchr.org/en/instruments-mechanisms/instruments/convention-rights-child#:~:text=PART%20I-,Article%201,child%2C%20majority%20is%20attained%20earlier
Witte, S. (2020). Case file analyses in child protection research: Review of methodological challenges and development of a framework. Children and Youth Services Review, 108. https://doi.org/10.1016/j.childyouth.2019.104551
Women with Disabilities Australia. (2007). Forgotten sisters: A global review of violence against women with disabilities. WWDA.
Woollard, M. (2014). Administrative data: Problems and benefits: A perspective from the United Kingdom. In A. Duşa, D. Nelle, G. Stock, & G. G. Wagner (Eds.), Facing the future: European research infrastructures for the humanities and social sciences (pp. 49–60). SCIVERO.
World Health Organization. (2011). World report on disability. WHO. https://www.who.int/publications/i/item/9789241564182
Appendix A:
Disability categories
Table A1: Disability categories
| Groups | Diagnosis | Databases |
|---|---|---|
| Intellectual disability [c] | Intellectual disability | IDEA, HMDS, MHIS |
| Autism and pervasive development disorders [c] | Autism (autistic disorder) includes autistic disorders pervasive developmental disorders | IDEA, HMDS, MHIS |
| Cerebral palsy [c] | Cerebral palsy | IDEA, HMDS, MHIS |
| Other genetic conditions [c] | Genetic conditions excluding Down syndrome | IDEA, HMDS, MHIS |
| Spinal cord or brain injury [c] | Resulting in paraplegia, quadriplegia, hemiplegia where there is severe loss of strength and movement in the affected limbs of the body | HMDS, MHIS |
| Permanent blindness [c] | Permanent blindness | HMDS, MHIS |
| Permanent bilateral hearing loss [c] | Permanent hearing loss | HMDS, MHIS |
| Deaf blindness [c] | Permanent and severe to total impairment of visual function and hearing | HMDS, MHIS |
| Amputation or congenital absence of two limbs [c] | Amputations (T05) Congenital absence of limb or part thereof | HMDS |
| Conditions resulting in physical impairment | Conditions for physical impairment (List B for NDIS) | HMDS, MHIS |
| Conduct disorder | Conduct disorder (F91) | HMDS, MHIS |
| ADHD | ADHD (F90.0) | HMDS, MHIS |
| Diagnosed mental health disorders (excluding specific groups) | Mental and behavioural disorder [a] (all other mental/behavioural disorders apart from autism, conduct disorder, attention deficit and intellectual disability) | HMDS, MHIS |
| Chronic health conditions | Cystic fibrosis (E84) Epilepsy (G40) Asthma (J45) Diabetes (E10–E14) | HMDS, MHIS |
| Birth defects (generic category) | Birth defects (other congenital malformations contained in WARDA) [b] | WARDA, HMDS |
| Down syndrome | Down syndrome (Q90) | WARDA, HMDS, IDEA |
Notes: a This includes organic disorders, disorders due to psychoactive substance use, schizophrenia-type disorders, mood disorders, behavioral syndromes, stress-related disorders, personality disorders, specific developmental disorders, behavioral and emotional disorders.
b See https://kemh.health.wa.gov.au/services/register_developmental_anomalies/diagnostic_codes_birth_defects.htm.
Also see Appendix B.
c NDIS Categories – List A: Conditions that are likely to meet the disability requirement. https://ourguidelines.ndis.gov.au/home/becoming-participant/applying-ndis/list-conditions-are-likely-meet-disability-requirements
Table A2: Disability categories including ICD-10 codes
| NDIS category List A | Group | Databases | ICD-10 codes |
|---|---|---|---|
| 1. Intellectual disability | Intellectual disability | IDEA | F70–F79 |
| 2. Autism and pervasive development disorders | Autism List A – includes Autistic disorders List B – pervasive developmental disorders (F84) | IDEA | F84, F84.0, F84.1, F84.2, F84.5 (all of F84) F84 Pervasive developmental disorders F84.0 Childhood autism F84.1 Atypical autism F84.2 Rett syndrome F84.3 Other childhood disintegrative disorder F84.4 Overactive disorder associated with mental retardation and stereotyped movements F84.5 Asperger syndrome F84.8 Other pervasive developmental disorders F84.9 Pervasive developmental disorder, unspecified |
| 3. Cerebral palsy | Cerebral palsy | IDEA | G80 |
| 4. Other genetic conditions (unlike NDIS category, Down syndrome has been excluded into separate category) | IDEA WARDA HMDS | Other genetic conditions (excluding Down syndrome – separate group) Angelman syndrome (Q87.85) Coffin-Lowry syndrome in males (Q89.8) Cornelia de Lange syndrome (Q87.12) Cri du Chat syndrome (Q93.4) Edwards syndrome (Trisomy 18 – full form) (Q91) Epidermolysis bullosa (severe forms) (Q81) Lesch-Nyhan syndrome (E79.1) Leigh syndrome (G31.82) G31.8–G31.9, G32.8: Congenital degenerative CNS disorder Leukodystrophies: Alexander disease (infantile and neonatal forms) Canavan disease Krabbe disease (gl oboid cell leukodystrophy) Infantile form (E75.23) Pelizaeus-Merzbacher disease (connatal form) Lysosomal storage disorders resulting in severe intellectual and physical impairments: Gaucher disease Types 2 and 3 (E75.22) Niemann-Pick disease (Types A and C) (E75.24) Pompe disease (E74.02) Sandhoff disease (infantile form) (E75.01) Schindler disease (Type 1) Tay-Sachs disease (infantile form) (E75.02) Mucopolysaccharidoses – the following forms: MPS 1-H (Hurler syndrome) (E76.01 and E76.02) MPS III (San Fillipo syndrome) (E76.22) Osteogenesis Imperfecta (severe forms) (Q78.0) Type II – with two or more fractures per year and significant deformities severely limiting ability to perform activities of daily living (E76.1) Patau syndrome (Q91) Rett syndrome (F84.2) Spinal muscular atrophies of the following types: (G12) Werdnig-Hoffmann disease (SMA Type 1 Infantile form) Dubowitz disease (SMA Type II – Intermediate form) X-linked spinal muscular atrophy | |
| 5. Spinal cord or brain injury | Resulting in paraplegia, quadriplegia, hemiplegia where there is severe loss of strength and movement in the affected limbs of the body | HMDS | Paraplegia and tetraplegia (G82); hemiplegia S14 Injury of nerves and spinal cord at neck level (check numbers with potential restriction to S14.0 concussion and oedema of cervical spinal chord) S06 Intracranial injury T06.0 Injuries of brain and cranial nerves with injuries of nerves and spinal cord at neck level |
| 6. Permanent blindness | NDIS *in both eyes | HMDS | H54 – Blindness H54.4 Blindness in one eye H54.0 Blindness both eyes |
| 7. Permanent bilateral hearing loss | NDIS *in both ears | HMDS | H90 Conductive and sensorineural hearing loss H91 Other and unspecified hearing loss |
| 8. Deaf blindness | Permanent and severe to total impairment of visual function and hearing | HMDS | Have identified impairment in both 6 and 7 |
| 9. Amputation or congenital absence of two limbs | Amputations (T05) Congenital absence of limb or part thereof (Q71, Q72, Q73) | T05 Traumatic amputations involving multiple body regions T05.0 both hands T05.1 one hand and other arm [any level] T05.2 both arms [any level] T05.3 both feet T05.4 one foot and other leg [any level, except foot] T05.5 both legs [any level] T05.6 upper and lower limbs [any level] T05.8 combinations of body regions T05.9 multiple traumatic amputations, unspecified Congenital absence of limbs Q71 Reduction defects of upper limb Q72 Reduction defects of lower limb Q73 Reduction defects of unspecified limb | |
| 9a. Additional groups – Conditions resulting in physical impairment (List B) | List B for conditions for physical impairment | Epidermolysis bullosa (Q81) Harlequin type icthyosis (Q80.4) Juvenile arthritis/Stills disease (excluding monocyclic/self-limited adult-onset Stills disease) (M08, M09) Rheumatoid arthritis (M06) Diseases of myoneural junction and muscle (G70, G71) – which includes types of muscular dystrophy | |
| 9a. Additional groups – Conditions resulting in physical impairment (List B) | Conduct disorder (F91) | HMDS | F91–F92 |
| 9a. Additional groups – Conditions resulting in physical impairment (List B) | ADHD (F90.0) | HMDS | F90.0 |
| Diagnosed mental health disorders (excluding specific groups) | Not included in NDIS but psychiatric disability is an interest group Mental and behavioural disorder [a] (all other mental/behavioural disorders apart from autism, conduct disorder, attention deficit and intellectual disability) | HMDS | F00–F69, F80–F99 (excluding F84.0, F84.1, F90–F92) |
| Chronic health conditions | Cystic fibrosis (E84) Epilepsy (G40) Asthma (J45) Diabetes (E10–E14) | Coded separately and also included as a chronic health condition group |
Other groups
| NDIS category List A | Group | Databases | ICD-10 codes |
|---|---|---|---|
| Birth defects (generic category) | Birth defects (other congenital malformations) | WARDA [b] HMDS | Congenital malformations from WARDA |
| Down syndrome | Down syndrome (Q90) |
Notes: a This includes organic disorders, disorders due to psychoactive substance use, schizophrenia-type disorders, mood disorders, behavioral syndromes, stress-related disorders, personality disorders, specific developmental disorders, behavioral and emotional disorders.
Appendix B:
Western Australian register of birth defects categories
| Main diagnostic categories | Common individual defects within category |
|---|---|
| Nervous system defects | Neural tube defects Anencephalus Spina bifida Encephalocoele Microcephaly Congenital hydrocephalus Congenital deafness |
| Congenital anomalies of eye | Anophthalmia Microphthalmia Congenital cataract and lens anomalies |
| Congenital anomalies of ear, face and neck | Anotia, microtia Branchial remnants |
| Cardiovascular defects | Transposition of great vessels Tetralogy of fallot Ventricular septal defect Atrial septal defect Hypoplastic left heart syndrome Patent ductus arteriosus Coarctation of aorta |
| Respiratory system defects | Choanal atresia |
| Gastro-intestinal defects | Cleft palate only Cleft lip only Cleft lip and palate Tracheo-oesophageal fistula Oesophageal atresia/stenosis Pyloric stenosis Stenosis/atresia small intestine Stenosis/atresia anus Hirschprung’s disease |
| Uro-genital defects | Undescended testis Hypospadias Renal agenesis or dysgenesis Cystic kidney disease Obstructive defects renal pelvis Vesico-ureteric reflux Other anomalies of ureter |
| Musculo-skeletal defects | Developmental dysplasia of hip Polydactyly Syndactyly Reduction deformities Upper and/or lower limbs Craniosynostosis Diaphragmatic hernia Exomphalos Gastroschisis |
| Congenital anomalies of integument | Birth marks, naevus |
| Chromosomal defects | Down syndrome Trisomy 13 Trisomy 18 Turner syndrome |
| Other | Congenital hypothyroidism Adrenogenital syndome Disorders of amino acid Transport and metabolism Phenylketonuria Disorders of carbohydrate Transport and metabolism Cystic fibrosis G6PD deficiency Thalassemias Haemophilia Muscular dystrophies and myopathies Fetal alcohol spectrum disorder Congenital rubella syndrome |