
RESEARCH REPORT Economic insecurity and intimate partner violence in Australia during the COVID-19 pandemic
Anthony Morgan
Research Manager, Serious and Organised Crime Research Lab,
Australian Institute of Criminology
Hayley Boxall
Research Manager, Violence against Women and Children Research Program,
Australian Institute of Criminology
Anthony Morgan
Research Manager, Serious and Organised Crime Research Lab,
Australian Institute of Criminology
Hayley Boxall
Research Manager, Violence against Women and Children Research Program,
Australian Institute of Criminology
Read the PDF version of the report
This report addresses work covered in the ANROWS research project “The impact of the COVID-19 pandemic on experiences of intimate partner violence among Australian women”. Please consult the ANROWS website for more information on this project.
ANROWS research contributes to the six National Outcomes of the National Plan to Reduce Violence against Women and their Children 2010–2022. This research addresses National Plan Outcome 2 – Relationships are respectful and Outcome 4 – Services meet the needs of women and their children experiencing violence.
Suggested citation:
Morgan, A., & Boxall, H. (2022). Economic insecurity and intimate partner violence in Australia during the COVID-19 pandemic (Research report, 02/2022). ANROWS.

Australian Institute of Criminology
GPO Box 1936
Canberra ACT 2601
Author acknowledgement
We acknowledge the important work of Chris Owen and Gladys Lima and colleagues from Roy Morgan in administering the survey on our behalf, as well as their valuable input into survey design. The survey was also developed in consultation with representatives from the Department of Home Affairs, Department of the Prime Minister and Cabinet, Attorney-General’s Department, Department of Social Services, Australian Bureau of Statistics, Australian Institute of Health and Welfare and Australia’s National Research Organisation for Women’s Safety. We are grateful for their support and assistance. Finally, we acknowledge the women who responded to the survey and shared with us their experiences of violenc
Contents
Economic disparity or inequality between partners
Experiences of economic insecurity among women
The relationship between economic insecurity and women’s experiences of intimate partner violence
The intersection between economic insecurity and IPV among priority populations
Changes in financial status and their impact on patterns of violence and abuse experienced by women
Definitions and concepts
| Term | Definition |
|---|---|
| Economic disparity | Economic disparity refers to one person in a relationship having more economic power than the other person. This can include where the respondent is the main income earner in the relationship, but it may also include circumstances where other measures of economic security are unevenly balanced between two partners, such as one partner being employed and the other not, or where only one partner is able to find savings in an emergency. |
| Economic hardship | The inability of respondents or their partners to cover essential household costs (e.g. food, heating and cooling) due to a shortage of money. |
| Economic insecurity | For this research, economic security is defined as the extent to which “individuals are vulnerable to hardship-causing economic losses” (Hacker, 2018). Key domains of economic insecurity that have been discussed by economists and researchers include economic hardship, economic status and subjective feelings of stress associated with financial wellbeing. |
| Emotionally abusive, harassing and controlling behaviours | Emotionally abusive, harassing and controlling behaviours refers to a broad range of behaviours or actions that are aimed at controlling a current or former intimate partner’s behaviour or causing them emotional harm or fear. These behaviours fall into five broad categories: financial abuse, verbally abusive and threatening behaviours, socially restrictive behaviours, stalking and monitoring of behaviours and reproductive coercion. These behaviours are also referred collectively to as non-physical abuse within this report. |
| Financial precarity | The ability of respondents or their partners to draw on their savings for emergency reasons. In this research, two measures were included: specifically, whether the respondent or their partner could obtain $500 or $2,000 within a week if required to for emergency reasons. |
| Financial stress | The emotional distress and anxiety experienced by respondents and their partners related to their financial status. Financial stress refers to the subjective feelings of stress associated with financial wellbeing, which can be experienced by an individual regardless of their objective financial status. |
| Intimate partner violence | For the purpose of this research, intimate partner violence is defined as physical violence, sexual violence or emotionally abusive, harassing and controlling behaviours that occur between current or former intimate partners. |
| Partner | A partner is defined as a person with whom the respondent has had a relationship during the last 12 months. This includes current and former partners. All questions about former partners refer to the respondent’s most recent partner. Violence by previous partners – either where a respondent has had multiple partners in the last 12 months, or they experienced violence in the last 12 months by a partner with whom the relationship ended before February 2020 – is not captured within this survey. “Partner” is used interchangeably with “intimate partner”. |
| Physical violence | Physical violence is the occurrence, attempt or face-to-face threat of physical assault by an intimate partner, including:
Questions about physical violence were taken from the Personal Safety Survey (PSS; Australian Bureau of Statistics, 2017). |
| Relationship | Relationship is, for the purpose of this research, broadly defined. It includes going on a date, regular dating partners, serious or casual sexual relationships, and emotionally committed relationships such as long-term, cohabiting, engaged or married partners. |
| Respondent | Survey respondents were adult, Australian women aged 18 years and older who were in a current or former relationship with an intimate partner at some point in the 12 months prior to the survey. Respondents were selected from online research panels used to recruit research participants. |
| Sexual violence | Sexual violence is the occurrence, attempt or face-to-face threat of sexual assault by a current or former intimate partner. This includes an intimate partner forcing them, trying to force them or threatening to force them to take part in sexual activity against their will; this definition was also taken from the PSS (ABS, 2017). It also includes image-based abuse, forcing a partner to watch pornography and forcing a partner to have sex without contraception (knowingly or otherwise). |
Executive summary
A large body of research has now examined the impact of the COVID-19 pandemic on family and intimate partner violence (IPV; Bourgault et al., 2021; Peterman, O’Donnell, & Palermo, 2020; Peterman & O’Donnell, 2020a, 2020b; Piquero et al., 2021). Various studies conducted in Australia and overseas have identified high rates of self-reported IPV victimisation among women during the COVID-19 pandemic (Arenas-Arroyo et al., 2021; Béland et al., 2020; Boxall et al., 2020; Boxall & Morgan, 2021; Fereidooni et al., 2021; Hamadani et al., 2020; Jetelina et al., 2021; Perez-Vincent et al., 2020). Recent Australian research found the COVID-19 pandemic has coincided with the onset of first-time IPV within previously non-abusive relationships and an escalation in the frequency and severity of ongoing violence (Boxall et al., 2020; Boxall & Morgan, 2021). This suggests that the COVID-19 pandemic may have influenced patterns of violence and abuse experienced by women within some relationships.
There has been a focus on the impact of the COVID-19 pandemic on the economic security of women and their partners and its contribution to IPV (Peterman, Potts, et al., 2020a). Previous research has shown that economic insecurity is significantly associated with the perpetration and persistence of IPV; however, the relationship is a complex one (Schwab-Reese, 2016).
The current study aimed to address the following research questions:
- What is the relationship between risk factors that can change over time, particularly factors related to economic insecurity, and Australian women’s experiences of IPV?
- Is there any evidence of a relationship between those risk factors that have been influenced or exacerbated by the COVID-19 pandemic and women’s experiences of IPV?
- Does the relationship between economic insecurity and IPV differ according to the type of IPV or pattern of violence and abuse (i.e. onset and escalation) experienced?
Method
Building on research conducted in mid-2020 following the first wave of the pandemic and national containment measures (Boxall et al., 2020), an online survey of more than 10,000 adult women aged 18 years and older in Australia who had been in a relationship in the last 12 months was conducted between February and April 2021. This captures the national containment period, staggered reopening, and subsequent lockdowns and containment measures introduced in several states in mid- to late 2020 and early 2021. It does not capture the period of the lockdowns in mid- to late 2021 associated with outbreaks of the Delta strain of the virus. Respondents were asked about:
- their experiences of IPV in the last 12 months, including physical violence, sexual violence and emotionally abusive, harassing and controlling behaviours
- their experiences of prior IPV
- the changes in their own and their partner’s circumstances that may have contributed to changes in the patterns of abuse they were experiencing
- economic security and social support networks.
For the purpose of the study, economic security was measured across a number of domains: economic status of respondents and their partners (e.g. employment status), experiences of economic hardship (e.g. inability to pay to heat or cool their home), and emotional distress associated with financial status.
The data were analysed in two stages. First, experiences of economic insecurity among respondents were explored at a descriptive level. The second stage of the analysis involved the estimation of multivariate regression models to measure the relationship between the major variables of interest (i.e. economic insecurity) and the likelihood of having experienced IPV, while controlling for other risk factors for violence. This second stage examined the relationship between IPV and chronic stressors associated with economic insecurity as well as the acute stressors coinciding with the COVID-19 pandemic.
Results
Experiences of economic insecurity
Three in five respondents reported that they had been in full-time, part-time or casual employment for at least part of the 12-month period prior to the survey (58.1%), and two in three (66.5%) said that their partner had been employed. Among women who had been employed for at least some of the time during this period, one third (31.3%) reported they had been temporarily laid off, lost their job or had to take a pay cut or reduce their hours. The main source of income for one in four respondents was a government pension, benefit or allowance (25.7%) – this includes individuals already in receipt of assistance prior to February 2020 as well as those respondents who applied for support payments introduced during the COVID-19 pandemic.
At least one form of economic hardship – defined as the inability to pay for essential household expenses because of a shortage of money – was reported by one in three women who responded to the survey (31.6%). One in five respondents (20.2%) said their partner had experienced at least one form of economic hardship. Experiences of economic hardship among respondents included:
- being unable to pay bills or expenses on time (18.1%)
- needing to pawn or sell something (16.3%)
- going without medical or dental treatment when needed (14.8%)
- skipping meals (9.8%)
- being unable to heat or cool their home (5.8%).
A smaller proportion of respondents (2.9%) reported that their children had to go without medical or dental treatment, and 1.5 per cent said their children had skipped meals.
One in five respondents (19.6%) and 14.9 per cent of their partners had sought government financial assistance in the past year, including the support payments introduced during the COVID-19 pandemic. Respondents also reported borrowing money from family or friends (14.9%) and applying for early access to their superannuation (11.8%). It was less common for respondents to report seeking financial assistance from non-government or community organisations (6.0% of respondents and 2.8% of partners).
Two in five respondents (40.9%) said they felt anxious about their financial situation, and 25.5 per cent said their partner was also anxious about their financial situation (though a large proportion were not sure about their partner). The impact of this stress on respondents included difficulty controlling worrying (24.5%), irritability (23.9%) and difficulty sleeping (20.8%). One in six respondents (16.3%) reported high levels of financial precarity, meaning that they would not be able to obtain $500 within a week in an emergency, and 11.7 per cent indicated their partner was in the same situation.
Economic insecurity among survey respondents: A snapshot
| In the first 12 months of the COVID-19 pandemic … | |
|---|---|
| 2 in 5 women (40.9%) said they were anxious about their financial situation | 40.9%  |
| 1 in 3 women (31.3%) were temporarily laid off, lost their job, had to reduce their hours or take a pay cut | 31.3%  |
| 1 in 3 women (31.6%) experienced at least one form of economic hardship | 31.6%  |
| 1 in 5 women (20.2%) were unable to pay essential household bills | 20.2%  |
| 1 in 10 women (9.8%) had skipped meals | 9.8%  |
| 1 in 10 women (11.8%) applied for early access to super | 11.8%  |
| 1 in 4 women (25.7%) said their main source of income was government income or pension | 25.7%  |
Note: Denominators for all estimates include respondents who did not want to disclose this information. Results are specific to survey respondents and not generalisable to wider population.
The relationship between economic insecurity and women’s experiences of intimate partner violence in the last 12 months
There was strong evidence of a relationship between economic insecurity and recent IPV. Women with higher levels of financial stress were much more likely to have experienced physical and sexual violence or emotionally abusive, harassing and controlling behaviours relative to women who reported low levels of financial stress in the last 12 months. This was, however, only true for women who had not experienced violence by their current or most recent partner prior to February 2020 (i.e. first-time victims). That financial stress was not associated with a higher likelihood of repeat violence suggests it may have contributed to the violence, rather than being a consequence of an abusive relationship.
Further, women who reported at least one form of economic hardship in the last 12 months were significantly more likely than women who had not experienced economic hardship to experience all forms of IPV. This relationship existed even after controlling for sociodemographic and relationship factors associated with IPV. Economic hardship was associated with both first-time and repeat violence, suggesting that it may be a cause of IPV in some relationships and, in others, be characteristic or a consequence of the type of financial abuse experienced by victims and survivors of IPV.
Although not a measure of economic insecurity per se, there was also evidence of economic disparity within relationships being associated with a higher likelihood of IPV. For example, women who were the main income earner in the relationship were more likely than women who were not the main income earner to have experienced physical violence, sexual violence and emotionally abusive, harassing and controlling behaviours. Notably, as with financial stress, this relationship only existed for victims and survivors of first-time violence, suggesting that it too was a contributing factor to the violence experienced by respondents.
IPV was more likely in relationships where financial precarity was experienced by one partner and not the other, potentially also highlighting the role of economic disparity in violence. Specifically, respondents who said that they could find $2,000 within a week in an emergency, but that their partner could not, were significantly more likely than respondents in relationships where neither partner could obtain the money to have experienced sexual violence and emotionally abusive, harassing and controlling behaviours. The opposite was also true – women who said that their partner would be able to obtain $2,000 in an emergency, but that they could not, were also more likely to experience physical and emotionally abusive, harassing and controlling behaviours. Finally, compared to respondents who reported that both they and their partner had not been employed in the previous 12 months, employed women with unemployed partners were more likely to experience all forms of IPV.
Regardless of levels of economic insecurity and disparities in relationships, women receiving medium or high levels of social support were less likely to report having experienced IPV, when compared to women who had low levels of social support. As with economic security, it is difficult to establish the temporal order of this relationship, especially since isolation from family and friends is a common feature of abusive and controlling relationships.
Finally, even after taking into account measures of economic insecurity and social support, other sociodemographic and relationship characteristics were positively associated with IPV. In particular, women with a restrictive long-term health condition, Aboriginal and Torres Strait Islander women, women who had been pregnant in the last 12 months and women who were living with children who responded to the survey were all at an increased risk of having experienced one or more forms of IPV in the last 12 months. Importantly, women who exhibited one or more of these risk factors and experienced economic insecurity were at an even higher risk of IPV. For example, women with a restrictive long-term health condition who were also economically insecure were significantly more likely than economically insecure women without a health condition to report all forms of IPV.
Changes in financial status and their impacts on patterns of violence and abuse experienced by women
One of the aims of this study was to measure the impact of COVID-19 on IPV experienced by women by exploring the effect of acute pandemic-related economic stressors. This involved examining the onset of IPV within previously non-abusive relationships longer than 12 months, and escalation in the frequency and severity of violence and abuse within already abusive relationships.
Women who had lost their job, taken a pay cut or reduced their hours (hereafter referred to as job loss or lost work) were significantly more likely than women whose employment was unaffected during the pandemic to have experienced physical violence and sexual violence by their current or most recent partner for the first time. Further, a partner’s job loss or lost work was associated with an increased likelihood of respondents experiencing first-time physical violence or first-time emotionally abusive, harassing and controlling behaviours. The probability of experiencing the onset of physical violence, sexual violence and emotionally abusive, harassing and controlling behaviours was generally highest where both partners had experienced job loss or lost work.
While changes to a respondent’s own employment status were not related to the escalation of IPV, respondents whose partner had lost their job or work were significantly more likely to experience an escalation in the frequency and severity of physical violence and emotionally abusive, harassing and controlling behaviours, which suggests that changes in employment status exacerbated the risk of violence. Moreover, women who said their financial situation had improved when compared with 12 months ago were more likely to experience a de-escalation of physical violence, and an increased likelihood of escalating physical violence and emotionally abusive, harassing and controlling behaviours. This is indicative of the complex role of economic stressors in relationships characterised by ongoing patterns of abuse, but also the challenge of disentangling which aspects of economic insecurity are a cause, characteristic or consequence of violence.
Discussion
Key finding 1: Experiences of economic insecurity were common among women during the first 12 months of the COVID-19 pandemic
High levels of economic insecurity were reported by women who participated in the survey across multiple domains. In addition, while we note the limitations of relying on an assessment by respondents, the prevalence of economic insecurity was higher among women relative to their partners. This finding is consistent with research which suggests women have been more negatively impacted by the pandemic than men, given the concentration of job losses in industries with higher proportions of female employees, and because of their role as primary carers of children and the rise in parent-only childcare arrangements during the pandemic.
Key finding 2: Economic insecurity was associated with an increased likelihood of IPV among women
Economic insecurity was positively associated with experiences of physical violence, sexual violence and emotionally abusive, harassing and controlling behaviours perpetrated by respondents’ current or most recent former partner in the last 12 months. While the direction of this relationship cannot be established with certainty using a cross-sectional survey, the high rate of economic insecurity among victims and survivors is evidence that many women who experience IPV may require economic support and material resources in order to leave abusive relationships, and also maintain their independence and longer term safety. This could include access to stable housing, income support, debt forgiveness, microloans and access to affordable childcare options if women choose to enter the workforce. Further, the finding that financial stress was associated with first-time physical and sexual violence in previously non-abusive relationships and not repeat violence, while job loss or lost work was associated with first-time and escalating violence, highlights the importance of measures that can alleviate financial stress or, when it occurs, reduce the likelihood it will lead to violence.
Key finding 3: Economic disparity within relationships was associated with IPV, even after controlling for economic insecurity
Economic disparity between partners was associated with recent experiences of IPV. Women who were the main income earners, were employed when their partner was not, or had access to financial savings that their partner did not, were more likely to experience IPV. In other words, women’s employment, relative income or access to financial savings were not on their own protective against the occurrence of IPV. Schemes focused on improving the economic status of women may not on their own mitigate the risk of IPV in all circumstances. While we could not measure the gendered views held by the partners of respondents, previous research has argued the relationship between economic disparity and IPV is a consequence of attitudes that support traditional gender norms and hegemonic masculinities (Zhang & Breunig, 2021). Efforts to improve the economic security of women therefore need to be supported by strategies to address these harmful attitudes and dismantle the systems that enable them, as well as additional protections for women from unintended consequences.
Key finding 4: Economic insecurity co-occurred with other vulnerabilities reported by women which were associated with an increased likelihood of IPV
Although economic insecurity was independently associated with experiences of physical violence, sexual violence and emotionally abusive, harassing and controlling behaviours, it often co-occurred with factors shown in Australian and international literature to increase the risk of IPV within relationships. Understanding that the role of economic insecurity in IPV may be concentrated in particular communities is crucial when developing and implementing strategies that are intended to improve women’s economic security. For example, financial support schemes need to be designed so they are accessible by women who have carer commitments and disabilities, and are delivered in partnership with Indigenous services and communities to ensure they are culturally appropriate.
Key finding 5: The relationship between economic status, stress and disparity and IPV varied according to the type of IPV and whether it was experienced as a chronic condition or an acute stressor
There was evidence that the relationship between economic status, stress and disparity and IPV varied according to the type of IPV being examined. Sexual violence emerged as uniquely associated with relationships characterised by economic disparity and economic parity (i.e. where both partners were employed or had access to savings). Further, there were mixed results regarding the relationship between unemployment and IPV, but clear evidence of a strong correlation with job loss and lost work, suggesting that it was this acute economic stress that likely increased the risk of IPV (especially if one partner was not working). Other correlates of IPV reflected more chronic forms of economic insecurity.
Key finding 6: Consistent with other Australian and international research, there was clear evidence that the acute economic stressors associated with the COVID-19 pandemic were associated with both the onset and escalation of IPV
This report adds to a growing body of international evidence that shows the economic consequences of the COVID-19 pandemic – including the acute economic stress on women and their partners – have been associated with an increased likelihood of first-time violence among respondents whose current or most recent partner (with whom they’d been in a relationship longer than 12 months) had not previously been violent, and an increase in the frequency or severity of violence among respondents in abusive relationships. The relationship between these acute economic stressors and recent changes in women’s experiences of violence provides the strongest evidence – though still based on cross-sectional data – of the relationship between Australian women’s economic insecurity and experiences of IPV during the pandemic. These results highlight the importance of efforts to try and mitigate the economic consequences of the pandemic now and in future stages of the Australian response to the pandemic. The findings are also relevant to other significant events, including natural disasters, where there may be a sudden impact on the economic circumstances of individuals and associated financial stress.
Conclusion
Findings from this study contribute detailed evidence of the relationship between economic insecurity and IPV experienced by women living in Australia during the first 12 months of the COVID-19 pandemic. These findings address some of the key limitations of previous research that has explored the link between economic insecurity and IPV, including by measuring different types of IPV, recruiting a large sample of women from the wider community, and measuring the relationship between acute economic stressors and IPV as well as more chronic forms of economic insecurity. This study is not without its own limitations, including the use of a cross-sectional research design, which makes it difficult to establish with certainty whether economic insecurity is a cause or a consequence of IPV, and the limits of an online panel that may be not representative of the most vulnerable sections of the community or include women who could not participate for safety reasons.
Taken together, this research highlights the complexity associated with understanding the role of economic insecurity in IPV. Findings draw attention to the need to address women’s economic security and not only within the context of the COVID-19 pandemic and its short- and long-term economic consequences. Future studies attempting to understand the role of economic security in IPV need to consider the circumstances of both partners in the relationship and, specifically, the role of economic parity and disparity, while longitudinal and perpetrator-focused studies are required to disentangle the magnitude and the direction of the relationship between economic insecurity and IPV. This will further enhance our understanding of the best types and timing of economic supports for women to prevent IPV, how to support victims and survivors in abusive relationships, and how to support women post-separation from abusive partners.
Introduction
Various studies conducted in Australia and overseas have identified high rates of self-reported intimate partner violence (IPV) victimisation among women during different stages of the COVID-19 pandemic (Arenas-Arroyo et al., 2021; Béland et al., 2020; Boxall et al., 2020; Fereidooni et al., 2021; Hamadani et al., 2020; Jetelina et al., 2021; Perez-Vincent et al., 2020). A recent survey conducted by Boxall and Morgan (2021) of 10,000 women living in Australia who had been in a relationship in the last 12 months found that during the first 12 months of the pandemic:
- 9.6 per cent of respondents had experienced physical violence from a current or former partner
- 7.6 per cent of respondents had experienced sexual violence from a current or former partner
- 31.6 per cent of respondents had experienced emotionally abusive, harassing and controlling behaviours from a current or former partner, including:
- financial abuse (19.3%)
- verbally abusive and threatening behaviours (18.7%)
- monitoring of movements and stalking (11.7%)
- socially restrictive behaviours (17.4%)
- reproductive coercion (2.8%; Boxall & Morgan, 2021).
Critically, the authors also found that around two thirds of respondents who experienced IPV perpetrated by their current or most recent partner in the 12 months prior to the survey had either experienced violence for the first time, or an escalation in the frequency and severity of ongoing violence. This suggests that the COVID-19 pandemic may have influenced patterns of violence and abuse experienced by women within some relationships.
In explaining the role of the COVID-19 pandemic in experiences of IPV among women, several theories have been put forward. There has been a focus on the impact of economic consequences of the COVID-19 pandemic on the economic security of women and their partners and its contribution to IPV (Peterman, Potts, et al., 2020a). This was a common theme among the factors identified by respondents as contributing to an upward trajectory of violence in the recent survey by Boxall and Morgan (2021), with financial stress and changes to employment status among the most common factors, alongside family and household stressors.
An expanding body of research has attempted to understand the role of economic insecurity experienced by women and the occurrence of IPV. Within this literature, economic security is defined as the extent to which “individuals are vulnerable to hardship-causing economic losses” (Hacker, 2018). Key domains of economic insecurity include economic hardship, economic status and subjective feelings of stress associated with financial wellbeing (Cortis & Bullen, 2016).
Economic status
Most studies have examined the role of economic insecurity on IPV using objective measures of the socioeconomic status of victims and survivors and perpetrators of IPV – in particular, the employment status of victims and survivors and perpetrators, and their level of income.
There is very little evidence that the employment status of victims and survivors and perpetrators is associated with the occurrence of IPV after controlling for other domains of economic insecurity such as economic hardship and stress (Cortis & Bullen, 2016; Fox et al., 2002; Golden et al., 2013; Lucero et al., 2016; Mouzos & Makkai, 2004; Ricks et al., 2016). However, there is more evidence in support of changes in employment status being a risk factor for violence. Benson and colleagues’ (2003) analysis of multiple waves of the National Survey of Families and Households in the United States showed that employment instability (defined as the number of times that an individual has been unemployed during a period) increased the risk of physical forms of IPV. Fox and colleagues (2002) similarly found that every period of male unemployment of at least six months increased the risk of IPV perpetration among men by 50 per cent. The authors suggested that it was the instability of an individual’s employment and their feelings of rejection associated with losing their job that increased the risk of IPV, rather than their employment status.
Further, although employment status may not be related to experiences of IPV, some studies have indicated that the type of employment may matter (Lucero et al., 2016). For example, although Fox et al. (2002) found that the employment status of respondents was not associated with physical IPV victimisation, working in physically demanding industries that caused respondents to be tired and irritable after coming home, and working in blue-collar, low-skilled work, was positively associated with IPV for both men and women. The authors explained this finding by suggesting that the exhausting nature of the work being done by some respondents, as well as the perceived lack of alternatives, may have contributed to feelings of stress and in turn violence (Fox et al., 2002).
There is some evidence that level of household income is associated with IPV. For example, Ahmadabadi et al. (2020) interviewed over 2,000 men and women about their experiences of physical, sexual and emotional forms of IPV in the last 12 months. Multivariate analyses identified that after controlling for a range of factors, men and women who reported family incomes of less than $1,000 a week were more likely to experience all forms of IPV compared to respondents who reported $2,500+ weekly family incomes. However, there were very few differences between the lowest income group of respondents and middle-income families.
Consistent with Ahmadabadi et al.’s (2020) findings, Benson et al. (2003) found that while respondents who lived in the most economically disadvantaged suburbs had higher rates of IPV, there were no differences between respondents living in the second, third and least disadvantaged communities. The authors suggested that these findings could be explained by “tipping point theory” – the notion that when a neighbourhood reaches a certain level of disadvantage, the composition of that neighbourhood can change, and the crime-related effects of disadvantage become apparent (Benson et al., 2003). In other words, the relationship between socioeconomic disadvantage and crime is not linear, but is concentrated in households that are experiencing the most extreme forms of economic insecurity.
This said, Australian research has found little evidence of a relationship between income and IPV victimisation. Mouzos and Makkai’s (2004) analysis of the Australian component of the International Violence against Women Survey found that respondents whose combined household income was less than $850 AUD a week were no more likely to experience IPV than respondents whose combined income was greater than this amount. However, if tipping point theory is correct, it may be that the individuals experiencing extreme forms of poverty are being “hidden” by the relatively simple measure used in this survey. Conversely, it may be that other aspects of economic insecurity are more strongly associated with IPV. For example, based on the analysis of data from the 2012 Personal Safety Survey, Kutin et al. (2017) found that household or personal income was not associated with the likelihood of economic abuse, especially once the level of financial stress (which was associated with economic abuse) was taken into account.
Economic hardship
Economic hardship refers to “the shortfall in a family’s financial resources relative to their financial obligations” (Lucero et al., 2016, p. 397). Measures of economic hardship include food insecurity (i.e. skipping meals or being unable to pay for food), inability to pay for amenities and essential services such as heating or cooling their home, and not seeking medical care when required due to the associated costs (Breiding et al., 2017; Ricks et al., 2016; Schwab-Reese et al., 2016). Housing insecurity is another important measure of economic hardship, where it is defined as the inability to pay for housing (Breiding et al., 2017). This is distinct from measures of housing stability, such as housing cost burden or evictions, which contribute to economic hardship (Deidda, 2015; Kahlmeter et al., 2018).
Several studies have identified that experiences of economic hardship are associated with IPV. For example, Schwab-Reese et al.’s (2016) secondary analysis of data collected from 10,000 respondents as part of the National Longitudinal Study of Adolescent to Adult Health found a linear relationship between financial stressors and economic hardship and IPV. With every additional financial stressor reported, the odds of respondents reporting they had been physically violent towards their partner increased. These findings are comparable to those reported from the Fragile Families and Child Wellbeing Study (Golden et al., 2013). The analysis of interviews conducted with over 2,000 women found that every additional reported economic hardship was associated with an increase in the odds of experiencing physical violence and emotional abuse (Golden et al., 2013).
Specific forms of economic hardship have been shown to be uniquely associated with IPV, even after controlling for other forms of economic insecurity and hardship. For example, Ricks and colleagues (2016) analysed data collected from women who participated in the California Women’s Health Survey in the United States and found that respondents who experienced high levels of food insecurity in the last 12 months had higher odds of experiencing IPV compared to women who reported low levels of food insecurity. This relationship remained stable even after controlling for unemployment, and income level among respondents. Further, Breiding et al.’s (2017) analysis of data collected as part of the 2010 National Intimate Partner and Sexual Violence Survey identified that housing insecurity and experiences of homelessness were independently associated with sexual forms of violence reported by female respondents. However, in this study it was not clear whether the sexual violence was perpetrated by partners or others.
Financial stress
Experiences of economic hardship and the economic status of individuals are relatively objective measures of economic insecurity. However, there is evidence that independent of these factors, feelings of stress and distress associated with individuals’ financial wellbeing is associated with experiences of IPV (Benson et al., 2003; Fox et al., 2002; Morgan & Boxall, 2020; Roberts et al., 2011; Weatherburn, 2011). Fox and colleagues (2002) found that a one-unit increase in women’s subjective feelings of financial adequacy was equivalent to a 36 per cent reduction in her risk of physical IPV victimisation.
Further, Morgan and Boxall (2020) surveyed 15,000 women living in Australia during the first three months of the COVID-19 pandemic about their experiences of physical and sexual IPV. After controlling for a range of other factors, women experiencing high levels of financial stress had 4.6 times the odds of experiencing first-time physical or sexual violence in the last three months (compared to women experiencing no financial stress). These findings are supported by other Australian studies. For example, Weatherburn’s (2011) analysis of data collected as part of the General Social Survey found that individuals who reported very high levels of financial stress had four times the odds of reporting actual or threatened physical IPV in the last 12 months, compared to respondents reporting very low levels of financial stress.
This is consistent with family stress theory, which highlights the role of stress events, including those related to economic insecurity, as leading to conflict and violence, particularly where couples have limited access to resources or do not have the necessary coping skills (Wu & Xu, 2020). Family stress theory is supported by studies which have shown that episodes of violence are often preceded by conflict or arguments about financial matters (Boxall et al., 2018; Cascardi & Vivian, 1995; Copp et al., 2016). Copp and colleagues argued, “Couples experiencing economic pressures are at increased risk for emotional distress, exhibit fewer supportive behaviors, and show increases in negative interactions and conflict” (Copp et al., 2016, pp. 747–748).
Changes in financial status
Much of the research exploring the links between economic insecurity and IPV focuses on the socioeconomic status and financial wellbeing of people at one point in time. However, it has been suggested that changes in the economic security of individuals may increase risk associated with IPV as well.
Among the small number of studies that have explored the impact of changes in financial status and IPV there is consistent evidence of an association (Fox et al., 2002; Lucero et al., 2016; Morgan & Boxall, 2020; Roberts et al., 2011). For example, Roberts et al.’s (2011) analysis of multiple waves of data collected through the National Epidemiologic Survey on Alcohol and Related Conditions in the United States found that after controlling for a range of factors, including childhood developmental experiences, recent experiences of financial stress and being made redundant were independently associated with IPV perpetration in the last 12 months.
Further, Lucero et al.’s (2016) analysis of data collected through the Fragile Families and Child Wellbeing Study found that women who reported consistently high levels of economic hardship across data collection points had three times the odds of experiencing physical and emotional forms of IPV compared to women who reported no economic hardship. Interestingly, the study also found that the odds of experiencing IPV at nine-year follow-up was comparable for women who reported increasing and decreasing levels of economic hardship. In explaining why improvements in financial status were not associated with a decrease in IPV, the authors suggested that subsequent mitigation of financial stressors did not offset the initial impact of economic hardship (Lucero et al., 2016). Finally, Morgan and Boxall’s (2020) research found that women whose level of financial stress had increased in the last three months were 1.8 times as likely to have experienced first-time physical or sexual forms of IPV when compared with women who had not experienced an increase in stress levels.
Taken together, these findings suggest that disruptions and changes in the financial status of partners and couples may increase the risk of IPV.
Economic disparity or inequality between partners
Although not necessarily a measure of economic insecurity per se, researchers have argued that economic disparity or inequality within relationships may be crucial for understanding the role of economic factors in IPV (Antai et al., 2014; Fox et al., 2002). Several primary pathways have been identified in the literature focusing on this. First, it has been suggested that women who are financially dependent on their partner have lower access to natural support systems and resources which would assist them to leave their abusive partners (Anderson & Saunders, 2003). This in turn may lead to the persistence and escalation of violence and abuse within the relationship.
Alternatively, in situations where women are not financially dependent on their partners, or may themselves be the primary breadwinner, men may use violence as a means of establishing control within their relationships, and mitigating any feelings of inadequacy they may have. This is consistent with feminist and gender role strain theories which posit that male violence towards their female partners may be due to a perceived discrepancy between their idealised notions of masculinity and their living circumstances (Jakupcak, 2003). One such domain in which men may feel more masculine is their employment status and earning power. If they are unemployed or earn less than their partner, their use of violence may be a means by which they reaffirm their notion of themselves as masculine.
The evidence for the role of economic disparity as a cause of IPV is mixed. Fox and colleagues (2002) found that the employment status of the victim and survivor and the perpetrator was not associated with physical forms of IPV, either independently or when combined. Other research has shown that the effect of women’s employment on their risk of IPV is conditional on their (male) partner’s employment (i.e. is more likely when they are employed and their partner is not; Macmillan & Gartner, 1999). Ahmadabadi et al. (2020) found that income disparity within couples (defined as one partner earning more than the other) was not positively associated with experiences of IPV. However, this was most recently examined within the Australian context by Zhang and Breunig (2021) in their analysis of Personal Safety Survey (PSS) data, who found that a violation of the gender norm that male partners should earn more than female partners was associated with a significant increase in the likelihood of physical and emotional IPV.
Summary
Previous research has shown that different sources of economic insecurity, as well as the stress or distress experienced by individuals related to their financial wellbeing, may increase risk of IPV. However, the existing studies are limited in a number of key ways. First, most of the research has involved the secondary analysis of existing survey datasets, very few of which were developed specifically to understand the links between economic insecurity and IPV. As a consequence, measures of IPV included in these studies have been very limited, focusing on physical forms of violence and abuse (see for example Cortis & Bullen, 2016; Ricks et al., 2016). This means that we currently know relatively little about the impact of economic insecurity on different forms of IPV, including sexual violence and non-physical forms of abuse.
Further, much of the research has focused on collecting information from vulnerable populations, particularly those who are already receiving government financial assistance and support (see for example Cortis & Bullen, 2016; Lucero et al., 2016), or who have contact with welfare agencies. While this research is important for understanding the role of economic insecurity in experiences of IPV among vulnerable populations, these populations are not representative of the broader population who may not be engaging with or receiving such services.
Finally, as noted above, most of the research that has been undertaken so far has been focused on relatively “static” measures of economic insecurity and stress, rather than changes in the financial status and wellbeing of individuals. This research is particularly important in the context of understanding the impact of COVID-19 pandemic-related economic factors on experiences of IPV among Australian women. To improve our understanding of the role of economic insecurity in experiences of IPV among Australian women, including during periods of significant events like the COVID-19 pandemic, there is a need to collect information from large, heterogeneous samples of women living in Australia; to measure different forms of IPV; and to examine the role of static and dynamic factors related to the economic status of women and couples.
Method
The aim of the current study was to address the following research questions:
- What is the relationship between risk factors that can change over time, particularly factors related to economic insecurity, and Australian women’s experiences of IPV?
- Is there any evidence of a relationship between those risk factors that have been influenced or exacerbated by the COVID-19 pandemic and women’s experiences of IPV?
- Does the relationship between economic insecurity and IPV differ according to the type of IPV or pattern of violence and abuse (i.e. onset and escalation) experienced?
This involved an online survey of 10,107 women aged 18 years and over who said that they had been in a relationship in the 12 months prior to the survey. Respondents were asked about their experience of IPV in the last 12 months, as well as their experience of prior IPV. The focus of this study was on women’s experience of violence, given the overwhelming evidence that women are overrepresented as victims of IPV (ABS, 2017; Hulme et al., 2019) and intimate partner homicide (Bricknell & Doherty, 2021); experience significant harms associated with IPV (Australian Institute of Health and Welfare, 2019); and have been disproportionately affected by the pandemic in terms of domestic violence (Piquero et al., 2021) and household and economic impacts (Churchill, 2021; Power, 2020; Reichelt et al., 2021).
Sampling and weighting
The survey was conducted by Roy Morgan Research between 16 February 2021 and 6 April 2021 using their Single Source panel and panels managed by PureProfile and Dynata. This captures the national containment period, staggered reopening, and subsequent lockdowns and containment measures introduced in several states in mid- to late 2020 and early 2021. It does not capture the period of the lockdowns in mid- to late 2021 associated with outbreaks of the Delta strain of the virus. The survey was sent to female members of these online panels aged 18 years and over. Proportional quota sampling, a non-probability sampling method, was used. Quotas were based on the Australian, adult, female population stratified by age and usual place of residence, derived from data from the Australian Bureau of Statistics (ABS, 2021a). The Single Source Survey, which is recruited through a rigorous cluster sampled face-to-face survey approach, was conducted first and was used to calibrate the quotas for the external panels to account for the propensity of women to be in a relationship.
The survey and administration methods and protocols were approved by the Australian Institute of Criminology’s Human Research Ethics Committee in April 2020 (Protocol no. P0305B). We prioritised the safety of women participating in the survey and, given the sensitive nature of the information being collected, a range of safety measures were employed. For example, we included a safety trap to screen out ineligible participants, did not disclose the content of the survey until the participant had confirmed they met the eligibility criteria and that it was safe to participate, provided information about support services on every page, and had measures in place to ensure a non-participant could not access the information provided by the respondent. Further information about these measures is available in our earlier report (Boxall & Morgan, 2021).
The survey took respondents an average of 15 minutes to complete. Questions were about sociodemographic and relationship characteristics and women’s experiences of physical violence, sexual violence and emotionally abusive, harassing and controlling behaviours in the 12 months prior to the survey. Women who were in a relationship with a partner at the time of the survey were asked about violence by their current partner. Women who had been in a relationship at some time in the 12 months prior to the survey, but were not in a relationship at the time of the survey, were asked about violence by their most recent partner.
The estimated completion rate for the survey – the proportion of total invitations sent to panel members that resulted in completed surveys – was 10.4 per cent. However, 85.1 per cent of women who opened the invitation, passed the screening process and read the consent form went on to complete the survey. Data were subsequently weighted by age and jurisdiction to reflect the spread of the Australian population using data from the ABS (2021a). Additional rim weights were applied to account for internet and social media use and educational attainment, derived from the Single Source panel, to address the overrepresentation of more highly educated and more frequent internet respondents on online panels. The effective sample size for the study after weighting (i.e. the weighted sample size) was 10,189 respondents. All data presented in this paper are weighted.
Further information on the response rate, methodology and sampling strategy is provided in Appendix A of Boxall and Morgan (2021). Detailed information about the sample used for this study is provided in Appendix A of this report.
Analysis
The analysis was undertaken in two stages. First, experiences of economic insecurity among respondents were explored at a descriptive level. The second stage of the analysis involved the estimation of multivariate regression models to measure the independent effect of the major variables of interest (i.e. respondent experiences of economic insecurity) on the likelihood of having experienced IPV, while controlling for the effect of other risk factors for violence. This second stage examined the relationship between IPV and chronic stressors associated with economic insecurity as well as the acute stressors coinciding with the COVID-19 pandemic. Regression analysis allows us to measure the relationship between our outcome of interest (dependent variable) and one or more explanatory factors (independent variables). We are interested in whether, once we consider the relationship between all variables in the model and the outcome, there is a statistically significant relationship between our main variables of interest and the dependent variable. When one of the variables in a regression model is statistically significant, it means we can conclude that a change in that variable is associated with a change in the likelihood of the outcome being observed. Our threshold for statistical significance is p<0.05, which is the same as saying there is a less than five per cent chance that the observed result is due to chance.
Given most of the dependent variables were dichotomous variables (yes/no to whether or not a respondent experienced violence), logistic regression models were used to estimate the likelihood of experiencing violence (Hosmer & Lemeshow, 2000). Multinomial logistic regression was used to estimate the likelihood of violence escalating or de-escalating in frequency or severity (where no change in patterns of abuse was used as the base category). The analysis was undertaken using weighted data. Model fit was assessed using a modified version of the Hosmer–Lemeshow goodness-of-fit test, which estimates the F-adjusted mean residual test following the estimation of logistic regression models using survey commands in Stata (Archer & Lemeshow, 2006). Given the susceptibility of this test to bias in large samples (Nattino et al., 2020), further link tests were conducted where the goodness-of-fit test was significant. This test is used to detect specification errors and assumes in a properly specified model that it would not be possible to identify additional significant independent variables (Pregibon, 1979). A weighted area under the receiver operating characteristic curve (AUROC) was also calculated for logistic regression models using Somer’s D (Newson, 2006). The AUROC (measured on a scale of 0.5 to 1) is a useful statistic because it helps assess the predictive accuracy of a model (i.e. the ability to correctly discriminate between cases). It reflects the probability that two randomly selected cases – one with the outcome (e.g. physical violence) and one without (e.g. no physical violence) – would be correctly classified by the model. An AUROC of 0.7 and above is considered to have an acceptable level of discrimination, while an AUROC of 0.8 or higher is regarded as having excellent discrimination. Multicollinearity – where two explanatory variables are highly correlated with each other which affects the accuracy of coefficients – was also examined for all models, with the tolerance for each variable above 0.1, while the condition indices were no higher than 5.0. Polychoric correlations between all independent variables showed that the correlation index for each bivariate correlation did not exceed 0.7.
Odds ratios (ORs) are reported for each of the logistic regression models, and are a measure of association between an independent variable and the outcome. They are interpreted as the odds that an outcome will occur when the variable is present, relative to the odds of the outcome occurring when that variable is not present. The results of the multinomial logistic regression are expressed in terms of relative risk ratios (RRRs), which are also a measure of association, but refer to the ratio of the risk of the outcome being one group (e.g. escalating IPV) relative to the risk of the outcome falling in the reference group (i.e. no change in IPV) when a variable is present. ORs and RRRs are reported with a 95 per cent confidence interval (CI), which is the range within which we are confident the true estimate for the population falls. Both ORs and RRRs can be difficult to interpret. In places throughout this report we also estimate the average predictive margins, adjusted for covariates using marginal standardisation (Muller & MacLehose, 2014), for statistically significant variables of interest. Predictive margins indicate the average predicted probability of the outcome of interest being observed – in this case, the experience of IPV in the 12 months prior to the survey – when certain characteristics are present, controlling for the other variables in the regression model (in other words, the likelihood that an individual would experience IPV if a variable is present or not). These predictive margins can be easier to interpret than ORs or RRRs but they are estimated probabilities of the outcome, not a true measure of its prevalence in the sample.
Dependent variables
Physical violence
Physical violence was defined as the occurrence, attempt or face-to-face threat of physical assault by an intimate partner in the last 12 months. Respondents were asked about a range of behaviours, including being pushed, grabbed or shoved; having something thrown at them that could hurt them, slapped, bit, kicked or hit with a fist; choked, strangled or grabbed around the neck; hit with something that could hurt them, beaten or attacked with a weapon; physically assaulted; or hurt in any other way. The physical violence survey items were taken from the 2016 PSS, for which they were developed in consultation with an expert advisory group and are now – in the absence of a single agreed definition of violence – routinely used to monitor levels of self-reported violence (ABS, 2017). Overall, 9.6 per cent of respondents experienced at least one form of physical violence perpetrated by their current or most recent intimate partner in the last 12 months.
Sexual violence
Respondents were defined as experiencing sexual violence if their partner had subjected them to any of the following in the last 12 months:
- forced the respondent or tried to make them take part in sexual activity against their will
- made the respondent have sex without a condom or took off a condom during sex without their knowledge or consent
- took an intimate or sexual picture or video of the respondent without their consent
- forced the respondent to or tried to make them watch pornography when they did not want to
- threatened to or actually distributed/shared an intimate or sexual picture or video of the respondent online without their consent.
Overall, 7.6 per cent of respondents reported that they had experienced at least one form of sexual violence perpetrated by their current or most recent intimate partner in the last 12 months.
Emotionally abusive, harassing and controlling behaviours
Emotionally abusive, harassing and controlling behaviours (also referred to as non-physical abusive behaviours throughout this report) were measured using items derived from various sources. This includes the Psychological Maltreatment of Women Inventory–Short Form (PMWI-SF) Dominance–Isolation subscale (Tolman, 1999), the PSS (ABS, 2017) and the broader IPV literature (Dragiewicz et al., 2018; Monckton Smith, 2020; Woodlock et al., 2020). Emotionally abusive, harassing and controlling behaviours measured as part of the survey included:
- financial abuse (e.g. keeping financial information from the respondent)
- verbally abusive and threatening behaviours (e.g. threatening to have the respondent’s children taken away from them)
- monitoring their movement and stalking (e.g. accessing their social media or email accounts without their consent)
- socially restrictive behaviours (e.g. interfered with the respondent’s relationship with friends or family members)
- reproductive coercion (e.g. telling the respondent not to use birth control or interfering with their birth control so they would get pregnant).
Overall, 31.6 per cent of women reported that they had experienced at least one form of emotionally abusive, harassing or controlling behaviour perpetrated by their current or most recent intimate partner in the last 12 months.
First-time IPV
Women who reported that they had experienced IPV in the last 12 months were asked whether the violence had occurred prior to the COVID-19 pandemic (defined as prior to February 2020). Respondents who said they had not experienced prior violence within their relationship, and who were in a relationship longer than 12 months, were defined as experiencing the onset of, or first-time, IPV.
Escalating or de-escalating IPV
Respondents who were in a relationship longer than 12 months and had experienced IPV prior to February 2020 and in the 12 months prior to the survey were asked whether, relative to the 12-month period prior to February 2020, the violence had increased in frequency or severity, stayed the same, or decreased in frequency or severity. Women who said the violence had increased in frequency or severity were defined as experiencing escalating IPV. Women who said the violence had decreased in frequency or severity were defined as experiencing de-escalating IPV.
Independent variables
Sociodemographic characteristics
Respondents were asked to provide basic demographic information including age, Indigenous status, their partner’s sex, whether they spoke a language other than English most often at home, their highest education level, whether they had been pregnant in the last 12 months, whether they had a long-term health condition (and whether it impacted everyday activities), place of usual residence, and the number of children living at home.
Relationship characteristics
Respondents were asked to provide information about the nature of their most recent relationship in the last 12 months – particularly, whether they were living or had lived together for at least some of the time in the last 12 months (i.e. cohabitation), the length of their relationship, and whether they were still in the relationship or had separated in the last 12 months. Respondents were also asked whether they had experienced physical or sexual violence or emotionally abusive, harassing and controlling behaviours by their current or most recent partner prior to February 2020.
Economic security
The extent to which women were economically insecure was assessed across multiple domains: economic status, experiences of economic hardship, experiences of financial stress, and financial precarity.
Economic status
The economic status of respondents and their partners was measured according to whether:
- they had been employed on a full-time, part-time or casual basis at any point in the last 12 months (i.e. not necessarily at the time the survey was conducted)
- the respondent was the main income earner within the relationship (also referred to as the “breadwinner”)
- their main source of income in the last 12 months was a government pension, benefit or allowance (which includes individuals already in receipt of assistance prior to February 2020 as well as those respondents who applied for support payments introduced during the COVID-19 pandemic).
For the purpose of the regression analysis, the employment status of the respondent and their partner was combined into one measure with four categories: both the respondent and their partner were unemployed; the respondent was employed but their partner was unemployed; their partner was employed but the respondent was unemployed; and both the respondent and their partner were employed. This was to explore the role of economic disparity within the relationship – where one partner was employed and the other was not – on experiences of IPV.
Economic hardship
Respondents were asked whether they and/or their partner had experienced any of the following forms of economic hardship in the last 12 months:
- inability to pay essential household bills or expenses on time
- went without medical treatment or dental treatment when required
- pawned or sold something
- went without meals
- was unable to heat or cool their home.
These items were taken from the General Social Survey (ABS, 2020c).
For the purpose of the logistic regression analysis, these questions were combined to create a single, dichotomous variable. If a respondent answered yes to one or more of these items they were defined as experiencing economic hardship. Respondents had to answer at least two of these items (45 respondents were excluded).
Financial precarity
Financial precarity was defined as the inability of respondents and their partners to obtain $500 or $2,000 within a week if they had to. These items were also taken from the General Social Survey (ABS, 2020c).
For the purpose of the regression analysis, the financial precarity of both the respondent and their partner (using $2,000 as the threshold) was also combined into one measure with four categories: both the respondent and their partner were unable to access $2,000 (including when the respondent was not sure about their partner’s access to savings); the respondent could access $2,000 but their partner could not (or the respondent was not sure about their partner); their partner could access $2,000 but the respondent could not; and both the respondent and partner were able to access $2,000. Again, this was to explore the role of economic disparity – for example one partner being financially stable and the other not – on experiences of IPV.
Financial stress
To measure the extent to which respondents and their partners were distressed because of their financial situation, the survey included five items from the Financial Anxiety Scale (Archuleta et al., 2013). Specifically, women were asked to identify whether they or their partner had experienced any of the following because of their financial situation in the last 12 months:
- anxiety
- difficulty controlling worrying
- irritability
- difficulty sleeping
- difficulty concentrating.
Responses were based on a five-point Likert scale where 1 = strongly disagree and 5 = strongly agree. Responses for these five items were aggregated to create a mean overall score for financial stress. For the regression analysis, respondents were assigned to one of three categories: low levels of financial stress (mean score of 1 to 3 across all items); medium levels of financial stress (mean score of 3.01 to 4 across all items); and high levels of financial stress (mean score of 4.01 to 5 across all items). Respondents were excluded if they did not answer any of the five items (n = 22).
Acute economic stress during COVID-19
In measuring the relationship between changes in economic insecurity and IPV during COVID-19, we included variables related to acute economic stressors experienced since February 2020. This included whether the respondent or their partner had been laid off, temporarily lost their job or taken a pay cut or reduced their hours in the last 12 months (if they or their partner had been employed). For the purpose of the regression analysis, separate variables were specified for the respondent and their partner, each with three categories: employed and did not take a pay cut, reduce their hours or lose their job (temporarily or on a permanent basis) in last 12 months; never employed in last 12 months; and employed and took a pay cut, reduced their hours or lost their job in the last 12 months.
We also included a variable that measured whether the respondent or their partner’s financial situation had changed when compared to 12 months ago. This was on a five-point scale ranging from significantly worse to significantly better. Again, we specified separate variables for the respondent and their partner, and collapsed the five-point scale into three categories: financial situation was unchanged, worse or better.
Social support
Research has shown that the quality and breadth of women’s social support networks may mitigate the impact of economic insecurity on experiences of IPV. To measure the quality of respondents’ social support networks, women were asked to indicate their level of agreement (on a five-point Likert scale where 1 = strongly disagree, 5 = strongly agree) with a series of statements about their relationships with friends and family members:
- My family really tries to help me.
- I get emotional help and support I need from my family.
- I can talk about my problems with my family.
- My family is willing to help me make decisions.
- My friends really try to help me.
- I can count on my friends when things go wrong.
- I have friends with whom I can share my joys and sorrows.
- I can talk about my problems with my friends.
For the regression analysis, answers to these questions were combined to create three categories: low levels of social support (mean score of 1 to 3 across all items), medium levels of social support (mean score of 3.01 to 4 across all items) and high levels of social support (mean score of 4.01 to 5 across all items). Respondents only recorded an overall score for social support if they answered a minimum of four items (21 respondents were excluded).
Contact with family and friends
In measuring the relationship between changes in social support and IPV during COVID-19, we also asked respondents whether their level of contact with friends and family members they do not usually live with had changed since February 2020. Contact could mean communicating in person, on the phone, by email, or online via messaging apps or social media. Change was measured on a five-point scale from decreased a lot to increased a lot. For the regression analysis these response items were reduced to three categories: increased, decreased or stayed the same.
Mandatory or voluntary quarantine
The final variable relevant to measuring the effect of the COVID-19 pandemic on IPV was based on whether the respondent or their partner was self-isolating on a voluntary or mandatory basis. Self-isolation included government-imposed conditions such as hotel-based quarantine, self-isolation after COVID-19 testing, and remaining at home (shelter-in-place conditions) during lockdown periods, as well as self-isolation periods that the respondent had voluntarily engaged in to minimise their risk of contracting COVID-19. Respondents were categorised according to whether both they and their partner had spent time in mandatory or voluntary quarantine, whether only they had, or whether only their partner had.
Limitations
There are several limitations associated with this study that need to be acknowledged. Many of these same limitations were described in Boxall and Morgan (2021) and the appendices to that report. The survey was limited to women who had access to the internet and were registered as part of the online panel. Non-probability sampling means that, although the sample was large and there was a high concordance with several population-level demographic characteristics, not everyone had an equal likelihood of being selected to participate in the research, meaning results are not necessarily generalisable to the wider female population. Importantly, and as set out in Boxall and Morgan (2021), the use of the Single Source panel to adjust the quotas to account for the propensity of women to be in a relationship, and to weight the data based on age, geography, relationship status, educational attainment, and internet and social media use, did help to ensure the final sample was representative of the spread of the female population according to these characteristics. Further, the accuracy of the results is limited by women’s willingness to report violence, even anonymously, while some may have been unable to participate due to safety concerns. It is also difficult to accurately capture the complex forms of violence and abuse experienced by victims and survivors of domestic violence in a short survey with simple yes/no responses.
Further, as this study is based on cross-sectional data, a causal relationship between the main variables of interest – different domains of economic insecurity – and IPV cannot be established. One of the challenges in establishing a relationship between economic insecurity and IPV is determining the temporal order of the relationship; specifically, whether IPV is a consequence of economic insecurity, or whether economic insecurity is an outcome of a woman’s experience of IPV (or, in the case of non-physical abuse, characteristic of the abuse by a partner). This is important, given the high proportion of respondents who reported experiencing some form of financially abusive behaviour (19.3%; see Boxall & Morgan, 2021), and evidence of the impact of IPV on women’s economic security and wellbeing (Cortis & Bullen, 2016). While it is impossible to determine with certainty the direction of the relationship between IPV and economic insecurity in a cross-sectional study, we attempted to overcome this limitation by:
- examining first-time violence or changes in the severity or frequency of violence (recent changes in violence being less likely to influence chronic economic stress)
- examining the relationship between violence and both chronic and acute stressors (acute stressors being less likely to be a consequence of violence)
- examining the relationship between violence and the economic security of the respondent’s partner (and not just their own economic security)
- conducting sensitivity analysis comparing the results for respondents who have or have not experienced violence by their current or most recent partner prior to the pandemic.
We note that there are limitations with relying on victims’ and survivors’ ability to accurately recall the timing and frequency of violence (Yoshihama et al., 2002), especially when reporting the incidence of violence in different time periods (Hilton et al., 1998), and for this reason rely on their subjective assessment of the frequency or severity of violence, rather than estimating the number of incidents. This is especially important with measuring non-physical forms of violence, which are not reliably captured within an incident-based approach to reporting (Stark, 2012).
There may be unmeasured confounding factors that are relevant to women’s experiences of violence, such as alcohol use and psychological distress, that are not included in this study (though many of these factors were explored in relation to changes in the frequency or severity of violence; see Boxall & Morgan, 2021). This is especially true for the partner of the respondent, for whom only information provided by the respondent was available, including in relation to their financial status and economic stressors.
One of the issues that was encountered as part of the analysis was the presence of missing data. Given the sensitive nature of the questions being asked, it was important to allow respondents the option of choosing not to respond. This resulted in a proportion of cases with missing data on at least one of the items in the regression models. Missing completely at random tests revealed that data were not missing completely at random, which is where there are no systematic differences between missing and complete cases (Little, 1988; Sterne et al., 2009). While there is no way to test for certain whether the data were missing at random (where there are systematic differences that can be explained from other information about respondents), there is a strong possibility that missing data were correlated with the likelihood of responding to sensitive questions (i.e. missing not at random). That is, women who experienced IPV, acute or chronic economic stressors or other negative life events were less likely to answer a question about whether they had experienced that event or stressor. In this situation, using imputation methods for missing data may lead to bias greater than complete case analysis (Allison, 2000; Sterne et al., 2009). For this reason, we limited the analysis only to complete cases. While the proportion of missing cases did not exceed 11 per cent in any model (and rarely exceeded 6 per cent), it is plausible that missing cases may have influenced the results of the regression models, and this should be acknowledged.
Despite these limitations, this survey provides important evidence of the experiences of IPV among a large sample of Australian women, and the role that both chronic and acute economic stressors had in influencing that abuse.
Results
Experiences of economic insecurity among women
The first stage of the analysis focused on describing experiences of economic insecurity among women who participated in the survey.
Economic status
As shown in Table 1, over half of respondents (58.1%) reported that they had been employed on a full-time, part-time or casual basis in the last 12 months, and two in three (66.5%) said their partner had been employed. One in two respondents (50.7%) said that both they and their partner were employed during this period. Among respondents who had been employed at least some of the time in the last 12 months, 31.3 per cent reported that they had been temporarily laid off, lost their job or had to take a pay cut or reduce their hours. One in four respondents (24.7%) reported these experiences on behalf of their partner. Overall, one in three respondents said that they were the main income earner within their relationship (36.3%) while 63.8 per cent said they were not (their partner was the main income earner or they had comparable earnings to their partner).
Respondents were asked what their main source of income was in the last 12 months. One in four (25.7%) respondents reported that their main source of income was a government pension, benefit or allowance, and 21.8 per cent of women said this was their partner’s main source of income. This included individuals already in receipt of assistance prior to February 2020 as well as those respondents who applied for support payments introduced during the COVID-19 pandemic. Overall, 16.9 per cent of respondents reported that both their own and their partner’s main source of income was a government pension, benefit or allowance (Table 1).
Table 1: Economic status of respondents and their partners, n=10,189 (weighted; %)
| Respondent | Partner | Both | |
|---|---|---|---|
| Employed on a full-time, part-time or casual basis in last 12 months | 51.8a | 66.5b | 50.7 |
| Been laid off temporarily or lost their job, or had to take a pay cut or reduce your hours | 31.3c | 24.7d | 14.0 |
| Main source of income in the last 12 months was a government pension, benefit or allowanceg | 25.7e | 21.8f | 16.9 |
a Denominator includes 76 respondents who did not want to disclose this information.
b Denominator includes 112 respondents who did not want to disclose this information.
c Limited to respondents who said they had been employed at some point in the last 12 months. Denominator includes 68 respondents who did not want to disclose this information.
d Limited to respondents who said their partner had been employed at some point in the last 12 months. Denominator includes 62 respondents who did not want to disclose this information and 168 respondents who were not sure.
e Denominator includes 247 respondents who did not want to disclose this information.
f Denominator includes 196 respondents who did not want to disclose this information, and 237 respondents who were not sure.
g Includes individuals already in receipt of assistance prior to February 2020 as well as those respondents who applied for support payments introduced during the COVID-19 pandemic.
Source: Impact of COVID-19 on intimate partner violence survey, AIC [Computer file]
Economic hardship
Experiences of economic hardship in the last 12 months were common among respondents. Overall, one in three women (31.6%) said they had experienced at least one form of economic hardship, and 20.2 per cent said their partner had. As shown in Figure 1, in the last 12 months:
- one in seven women (18.1%) said they had been unable to pay for one or more household bills or expenses on time (11.9% said their partners had been unable to)
- 16.3 per cent of women said they had to pawn or sell something (8.1% of partners)
- 14.8 per cent of women said they went without medical or dental treatment when needed (6.6% of partners)
- one in 10 women (9.8%) had skipped meals (3.7% of partners)
- one in 20 women (5.8%) were unable to heat or cool their home (3.1% of partners).
Critically, experiences of economic hardship were not limited to respondents and their partners. One in 20 women (2.9%) reported that their children had to go without medical or dental treatment in the last 12 months, and 1.5 per cent said their children had missed meals.
Figure 1: Experiences of economic hardship among respondents, their partners and their children, n=10,189 (weighted; %)
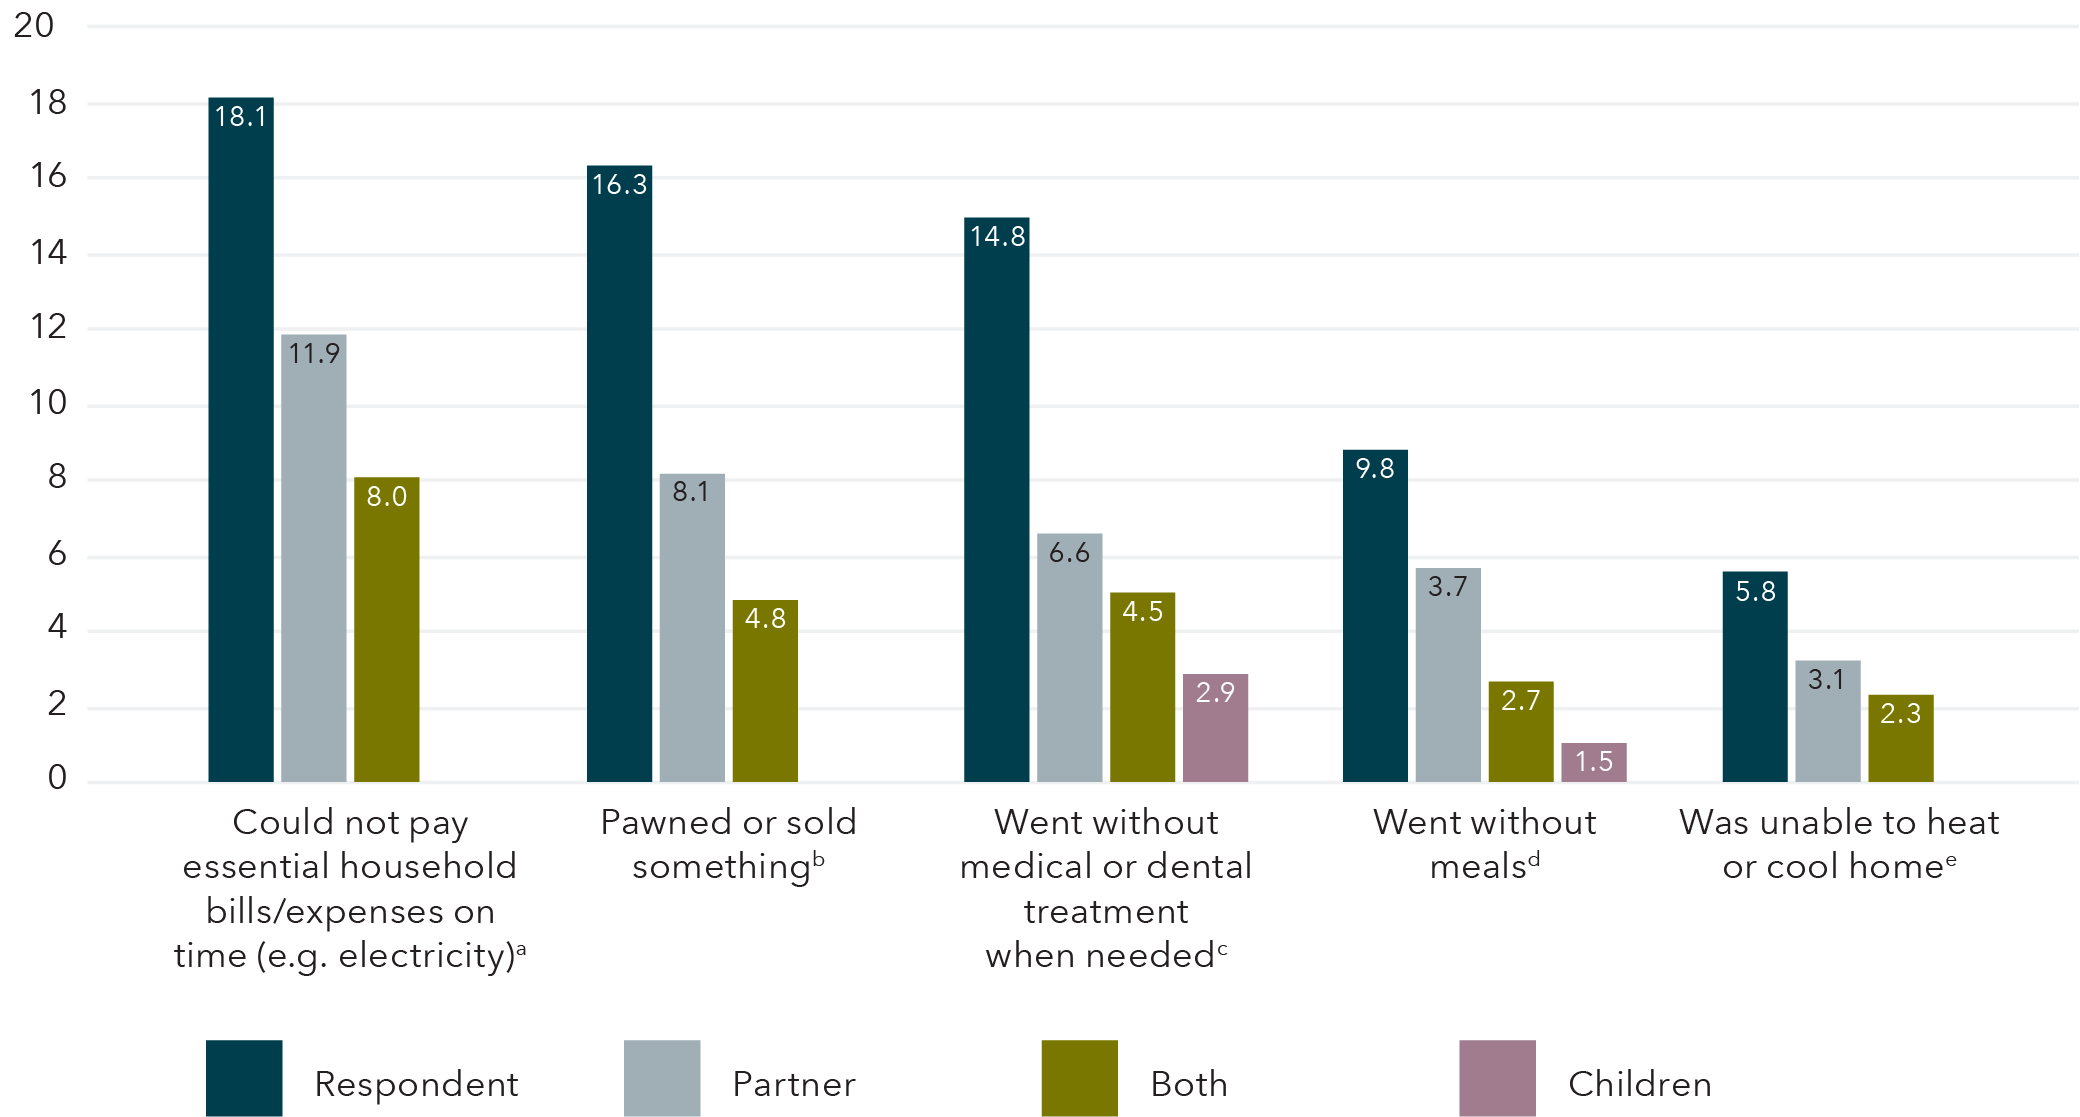
| Respondent | Partner | Both | Children | |
|---|---|---|---|---|
| Could not pay essential household bills/expenses on time (e.g. electricity) a | 18.1 | 11.9 | 8.0 | N/A |
| Pawned or sold something b | 16.3 | 8.1 | 4.8 | N/A |
| Went without medical or dental treatment when needed c | 14.8 | 6.6 | 4.5 | 2.9 |
| Went without meals d | 9.8 | 3.7 | 2.7 | 1.5 |
| Was unable to heat or cool home e | 5.8 | 3.1 | 2.3 | N/A |
Note: Estimates for children’s experience of economic hardship were limited to women who had at least one child living at home with them in the last 12 months.
a Denominator includes 218 respondents who did not want to disclose this information.
b Denominator includes 107 respondents who did not want to disclose this information.
c Denominator includes 81 respondents who did not want to disclose this information.
d Denominator includes 79 respondents who did not want to disclose this information.
e Denominator includes 101 respondents who did not want to disclose this information.
Source: Impact of COVID-19 on intimate partner violence survey, AIC [Computer file]
To alleviate the impact of the negative economic impacts and experiences described in Table 2 and Figure 1, a large number of respondents reported that they (19.6%) or their partner (14.9%) had sought government financial assistance in the last 12 months, including the support payments introduced during the COVID-19 pandemic. In comparison, it was less common for respondents and their partners to have sought financial assistance from non-government or community organisations (6.0% of respondents and 2.8% of partners). Further, 14.9% of respondents said they had asked to borrow money from their friends or family (8.2% of partners); and one in 10 respondents (11.8%) and their partners (10.6%) applied for early access to their superannuation.
Table 2: Financial help-seeking strategies among respondents and their partners, n=10,189 (weighted; %)
| Respondent | Partner | Both | |
|---|---|---|---|
| Applied for government financial assistance (e.g. JobKeeper)a | 19.6 | 14.9 | 7.0 |
| Asked to borrow money from friends or familyb | 14.9 | 8.2 | 4.6 |
| Applied for early access to superannuation fundsc | 11.8 | 10.6 | 4.3 |
| Asked for help from non-government welfare or community organisationsd | 6.0 | 2.8 | 18 |
a Denominator includes 122 respondents who did not want to disclose this information.
b Denominator includes 91 respondents who did not want to disclose this information.
Denominator includes 99 respondents who did not want to disclose this information.
d Denominator includes 110 respondents who did not want to disclose this information.
Source: Impact of COVID-19 on intimate partner violence survey, AIC [Computer file]
Financial precarity
Approximately one in six respondents (16.3%) said that they would not be able to obtain $500 within a week if they needed to. Around one in 10 (11.7%) said their partners would not be able to obtain $500 within a week. Further, a third of respondents (28.8%) said they would not be able to obtain $2,000 within a week, while one in five said their partner (20.5%) was in a similar position (Table 3).
Table 3: Financial precarity among respondents and their partners, n=10,189 (weighted; %)
| Respondent | Partner | Both | |
|---|---|---|---|
| Would not be able to obtain $500 if they needed to within a week | 16.3a | 11.7b | 4.5 |
| Would not be able to obtain $2,000 if they needed to within a week | 28.8c | 20.5d | 6.4 |
a Denominator includes 207 respondents who did not want to disclose this information.
b Denominator includes 151 respondents who did not want to disclose this information, and 714 who were not sure.
c Denominator includes 304 respondents who did not want to disclose this information.
d Denominator includes 194 respondents who did not want to disclose this information, and 1,003 who were not sure.
Source: Impact of COVID-19 on intimate partner violence survey, AIC [Computer file]
Financial stress
Financial stress levels were high among respondents. Overall, two in five respondents (40.9%) said that they were anxious about their current financial situation, and one in four (25.5%) said their partner was also anxious about their financial situation (though a large proportion were not sure about their partner; Table 4). When asked about the impact of financial stress on their day-to-day lives, respondents most frequently reported that they had difficulty controlling their worrying about their financial situation (24.5% of respondents and 14.4% of partners), irritability (23.9% of respondents and 15.8% of partners), and difficulty sleeping (20.8% of respondents and 12.0% of partners).
Table 4: Experiences of financial stress among respondents and their partners, n=10,189 (weighted; %)
| Respondent | Partner | Both | |
|---|---|---|---|
| Anxious about current financial situation | 40.9a | 25.5b | 19.4 |
| Difficulty controlling worrying about financial situation | 24.5c | 14.4d | 9.3 |
| Irritable because of financial situation | 23.9e | 15.8f | 10.3 |
| Difficulty sleeping because of financial situation | 20.8g | 12.0h | 7.0 |
| Difficulty concentrating because of financial situation | 19.4i | 11.2j | 7.1 |
a Denominator includes 59 respondents who did not want to disclose this information.
b Denominator includes 111 respondents who did not want to disclose this information, and 732 respondents who said they were not sure.
c Denominator includes 54 respondents who did not want to disclose this information.
d Denominator includes 110 respondents who did not want to disclose this information, and 711 respondents who said they were not sure.
e Denominator includes 55 respondents who did not want to disclose this information.
f Denominator includes 102 respondents who did not want to disclose this information, and 791 respondents who said they were not sure.
g Denominator includes 52 respondents who did not want to disclose this information.
h Denominator includes 117 respondents who did not want to disclose this information, and 828 respondents who said they were not sure.
i Denominator includes 55 respondents who did not want to disclose this information.
j Denominator includes 110 respondents who did not want to disclose this information, and 824 respondents who said they were not sure.
Source: Impact of COVID-19 on intimate partner violence survey, AIC [Computer file]
The relationship between economic insecurity and women’s experiences of intimate partner violence
The next stage of the analysis examined the relationship between key domains of economic insecurity and the likelihood of having experienced physical violence, sexual violence and emotionally abusive, harassing and controlling behaviours (non-physical abuse) in the last 12 months. This involved estimating multivariate logistic regression models which included controls for factors known to be associated with IPV (e.g. sociodemographic characteristics of respondents). Recall that regression analysis allows us to measure the relationship between IPV and one or more explanatory factors. When one of the variables in a regression model is statistically significant, it means we can conclude that a change in that variable is associated with a change in the likelihood of the outcome being observed.
Separate models were estimated for physical violence, sexual violence and emotionally abusive, harassing and controlling behaviours. As shown in Table 5, several domains of economic insecurity were consistently associated with all three forms of IPV.
Financial stress
First, there was a strong relationship between the level of reported financial stress and experiences of IPV. Relative to respondents who reported low levels of financial stress in the last 12 months:
- respondents who reported medium levels of financial stress had 1.9 times the odds of experiencing physical violence (OR=1.9, p<0.001), which increased to 3.0 times the odds among women who reported high levels of financial stress (OR=3.0, p<0.001)
- respondents who reported medium levels of financial stress had 1.8 times the odds of experiencing sexual violence (OR=1.8, p<0.001), which increased to 3.0 times the odds among women who reported high levels of financial stress (OR=3.0, p<0.001)
- respondents who reported medium levels of financial stress had 1.9 times the odds of experiencing emotionally abusive, harassing and controlling behaviours (OR=1.9, p<0.001), which increased to 2.6 times the odds among women who reported high levels of financial stress (OR=2.6, p<0.001).
Economic hardship
Further, women who reported at least one form of economic hardship in the last 12 months were more likely to experience all three forms of IPV. More specifically, compared to respondents who did not experience economic hardship in the last 12 months, women who did had 2.6 times the odds of reporting physical violence (OR=2.6, p<0.001), 2.5 times the odds of reporting sexual violence (OR=2.5, p<0.001), and 2.3 times the odds of reporting emotionally abusive, harassing and controlling behaviours (OR=2.3, p<0.001).
Table 5: Logistic regression model predicting IPV by a current or most recent intimate partner in the 12 months prior to the survey, by type of IPV
Age (vs. 25–34 years)
| Physical violencea OR (95% CI) | Sexual violenceb OR (95% CI) | Non-physical abusec OR (95% CI) | |
|---|---|---|---|
| 18–24 | 1.31 (0.91–1.88) | 1.15 (0.78–1.69) | 1.09 (0.84–1.42) |
| 35–44 | 1.13 (0.89–1.4) | 1.05 (0.82–1.35) | 1.01 (0.85–1.19) |
| 45–54 | 0.92 (0.69–1.23) | 0.84 (0.61–1.15) | 0.99 (0.83–1.18) |
| 55–64 | 0.73 (0.50–1.07) | 0.67 (0.43–1.05) | 0.75 (0.60–0.94)* |
| 65+ | 0.53 (0.33–0.87)* | 0.58 (0.33–1.02) | 0.80 (0.62–1.04) |
| Aboriginal and Torres Strait Islander (vs. non-Indigenous) | 2.82 (2.08–3.82)*** | 2.96 (2.15–4.07)*** | 2.43 (1.76–3.37)*** |
| Non-English speaking backgrounds (vs. English speaking) | 0.82 (0.54–1.24) | 0.85 (0.577–1.26) | 1.05 (0.84–1.32) |
| Restrictive long-term health condition (vs. no health condition) | 2.30 (1.80–2.94)*** | 2.55 (1.98–3.29)*** | 1.43 (1.19–1.73)*** |
| Partner is male (vs. partner is female) | 0.65 (0.47–0.90)** | 0.94 (0.67–1.32) | 0.89 (0.70–1.13) |
Place of usual residence (vs. metropolitan)
| Physical violencea OR (95% CI) | Sexual violenceb OR (95% CI) | Non-physical abusec OR (95% CI) | |
|---|---|---|---|
| Regional | 0.97 (0.77–1.21) | 1.00 (0.77–1.30) | 1.04 (0.90–1.21) |
| Remote | 1.26 (1.03–1.64) | 1.51 (0.91–2.49) | 1.13 (0.78–1.64) |
| At least one child living at home (vs. no children living at home) | 1.30 (1.03–1.64)* | 1.07 (0.85–1.37) | 1.41 (1.22–1.63)*** |
| Pregnant in the last 12 months (vs. not pregnant) | 1.47 (1.13–1.91)** | 1.85 (1.37–2.48)*** | 0.97 (0.79–1.19) |
| Former partner (vs. current partner) | 3.17 (2.34–4.30)*** | 3.08 (2.26–4.20)*** | 3.14 (2.46–4.00)*** |
| Cohabiting (vs. not cohabiting) | 1.49 (1.09–2.04)* | 1.00 (0.73–1.35) | 1.84 (1.49–2.27)*** |
| Respondent is the main income earner (vs. the respondent is not the main income earner) | 1.74 (1.42–2.14)*** | 1.59 (1.28–1.98)*** | 1.52 (1.34–1.74)*** |
Employment status of partner and respondent (vs. both partner and respondent unemployed)
| Physical violencea OR (95% CI) | Sexual violenceb OR (95% CI) | Non-physical abusec OR (95% CI) | |
|---|---|---|---|
| Respondent employed, partner unemployed | 1.05 (0.71–1.53) | 1.73 (1.07–2.78)* | 1.28 (0.98–1.68) |
| Partner employed, respondent unemployed | 0.66 (0.46–0.95)* | 1.26 (0.83–1.90) | 0.87 (0.69–1.08) |
| Both respondent and partner employed | 0.81 (0.61–1.08) | 1.82 (1.29–2.56)** | 1.24 (1.03–1.49)* |
Ability to access $2,000 in a week (vs. both partner and respondent unable to access $2,000)
| Physical violencea OR (95% CI) | Sexual violenceb OR (95% CI) | Non-physical abusec OR (95% CI) | |
|---|---|---|---|
| Respondent can access $2,000, partner cannot | 1.38 (0.99–1.93) | 2.12 (1.43–3.16)*** | 2.29 (1.78–2.95)*** |
| Partner can access $2,000, respondent cannot | 1.70 (1.23–2.34)** | 2.28 (1.61–3.24)*** | 1.74 (1.36–2.23)*** |
| Both respondent and partner can access $2,000 | 1.14 (0.90–1.46) | 1.35 (1.02–1.77)* | 1.03 (0.88–1.22) |
| Financial stress level (vs. low or none) | |||
| Medium levels of financial stress | 1.89 (1.49–2.39)*** | 1.77 (1.36–2.29)*** | 1.89 (1.63–2.18)*** |
| High levels of financial stress | 2.97 (2.27–3.89)*** | 2.99 (2.28–3.92)*** | 2.64 (2.15–3.23)*** |
| At least one economic hardship (vs. no economic hardship) | 2.55 (2.01–3.24)*** | 2.46 (1.91–3.18)*** | 2.26 (1.98–2.58)*** |
Level of social support (vs. low or no social support)
| Physical violencea OR (95% CI) | Sexual violenceb OR (95% CI) | Non-physical abusec OR (95% CI) | |
|---|---|---|---|
| Medium levels of social support | 0.68 (0.53–0.86)** | 0.68 (0.52–0.88)** | 0.57 (0.48–0.67)*** |
| High levels of social support | 0.66 (0.51–0.86)** | 0.63 (0.48–0.84)** | 0.51 (0.43–0.61)*** |
| Constant | 0.03 (0.16–0.052)*** | 0.01 (0.01–0.02)*** | 0.13 (0.09–0.20)*** |
a Sub-population n=9,659 (weighted), F=29.82, AUC=0.82, p<0.001. Eligible cases with missing data n=530 (5.2%).
b Sub-population n=9,667 (weighted), F=29.07, AUC=0.83, p<0.001. Eligible cases with missing data n=522 (5.1%).
c Sub-population n=9,670 (weighted), F=41.44, AUC=0.77, p<0.001. Eligible cases with missing data n=519 (5.1%).
OR=odds ratio; 95% CIs=95% confidence interval.
***p<0.001 **p<0.01 *p<0.05
Source: Impact of COVID-19 on intimate partner violence survey, AIC [Computer file]
Economic disparity
Certain measures of economic disparity also appeared to be associated with increased likelihood of experiencing IPV in the last 12 months. For example, respondents who said that they were the main income earner within their relationship were more likely to experience IPV, compared to women who said their partner was the main income earner or they had comparable income. More specifically, women who were the main income earner had:
- 1.7 times the odds of experiencing physical violence (OR=1.7, p<0.001)
- 1.6 times the odds of experiencing sexual violence (OR=1.6, p<0.001)
- 1.5 times the odds of experiencing emotionally abusive, harassing and controlling behaviours (OR=1.5, p<0.001).
Financial precarity
Experiences of financial precarity were also associated with experiences of IPV reported by women who responded to the survey, but only where one partner was in a financially precarious situation, potentially also highlighting the role of economic disparity in violence. Compared to respondents who said that both she and her partner would be unable to find $2,000 in a week (mutual financial precarity), women who said their partner would be able to obtain $2,000 in a week but that they would not were more likely to experience physical violence (OR=1.7, p<0.01), sexual violence (OR=2.3, p<0.001) or emotionally abusive, harassing and controlling behaviours (OR=1.7, p<0.001) in the last 12 months. Similarly, respondents who said they would be able to find $2,000 in a week but that their partner would not also had a higher likelihood of reporting experiences of sexual violence (OR=2.1, p<0.001) and emotionally abusive, harassing and controlling behaviours (OR=2.3, p<0.001) in the last 12 months, compared to respondents who said that both they and their partner would be unable to find the money. Of course, it is possible that this is characteristic of an abusive relationship, especially in situations where the partner has control over family finances, or in situations where the partner is in a precarious financial situation and pressures the respondent (who is not) for money.
Economic status
Other measures of economic insecurity included in the models were associated with some types of IPV, but not others. For example, as shown in Table 5, the relationship between the employment status of respondents and their partners differed according to the type of IPV experienced. Compared to respondents who said that both they and their partner were not working for the last 12 months, the odds of experiencing physical violence were 34 per cent lower (OR=0.7, p<0.05) for respondents who said that their partner had been employed and they had not. However, this relationship was not observed for sexual violence or emotionally abusive, harassing and controlling behaviours.
Also, compared to respondents who said that both they and their partner were not working:
- women who said that they were employed but their partner was not had 1.7 times the odds of experiencing sexual violence (OR=1.7, p<0.05)
- women who said that both they and their partner were employed had 1.8 times the odds of experiencing sexual violence (OR=1.8, p<0.01)
- women who said that both they and their partner were employed had 1.2 times the odds of experiencing emotionally abusive, harassing and controlling behaviours (OR=1.2, p<0.05).
Social support
Critically, there were also consistent findings regarding the role of protective factors in reducing the risk of IPV in the last 12 months, regardless of experiences of economic insecurity. Overall, women who said they had medium or high levels of social support were less likely to experience any type of IPV. The odds of respondents who reported medium levels of social support experiencing physical violence was 32 per cent lower compared to respondents reporting low levels of social support (OR=0.7, p<0.01), and 34 per cent lower for respondents who reported high levels of social support (OR=0.7, p<0.01). Similar results were found for experiences of sexual violence and emotionally abusive, harassing and controlling behaviours. Compared to respondents who reported low levels of social support:
- the odds of experiencing sexual violence were 32 per cent lower (OR=0.7, p<0.01) for respondents who reported medium levels of social support, and 37 per cent lower (OR=0.6, p<0.01) for respondents who reported high levels of social support
- the odds of experiencing non-physical abuse were 43 per cent lower (OR=0.6, p<0.01) for respondents who reported medium levels of social support, and 49 per cent lower (OR=0.5, p<0.01) for respondents who reported high levels of social support.
As with economic security, it is difficult to establish the temporal order of this relationship, especially since isolation from family and friends is a common feature of abusive and controlling relationships.
Sociodemographic and relationship characteristics
A number of other factors were associated with an increased likelihood of having experienced IPV in the last 12 months even after economic factors were taken into account. For example, Aboriginal and Torres Strait Islander respondents were more likely to have experienced physical violence (OR=2.8, p<0.001), sexual violence (OR=3.0, p<0.001) or emotionally abusive, harassing and controlling behaviours (OR=2.4, p<0.001) than non-Indigenous respondents. Respondents with a restrictive long-term health condition were more likely to have experienced all three forms of IPV compared to respondents who did not have a health condition (physical violence OR=2.3, p<0.001; sexual violence OR=2.5, p<0.001; non-physical abuse OR=1.4, p<0.001). Further, respondents who said they had been pregnant at any time in the last 12 months were more likely to report experiences of physical (OR=1.5, p<0.01) and sexual violence (OR=1.8, p<0.001) than respondents who had not been pregnant. However, there was no difference in the likelihood of having experienced emotionally abusive, harassing and controlling behaviours between respondents who had been pregnant and those who had not.
Respondents who said they had separated from their most recent partner in the last 12 months were more likely to report having experienced any form of IPV when compared to women who were still in a relationship (physical violence OR=3.2, p<0.001; sexual violence OR=3.1, p<0.001; non-physical abuse OR=3.1, p<0.001). Further, women who had lived with their partner in the last 12 months were more likely to report having experienced physical violence (OR=1.5, p<0.05) and emotionally abusive, harassing and controlling behaviours (OR=1.8, p<0.001) than women who did not live with their partner for any period in the last 12 months. This shows that economic security alone does not explain the variation in the likelihood of experiencing IPV.
First-time and repeat violence
To further explore the relationship between economic insecurity and IPV, separate models were estimated for respondents who had experienced physical violence or emotionally abusive, harassing or controlling behaviour by their current or most recent partner prior to February 2020 (prior violence), and for respondents who had experienced all three forms of violence for the first time (no prior violence; see Tables A3 to A5 for model results). This was limited to respondents who had been in a relationship for longer than 12 months (while not included, the no prior violence model was also estimated for all respondents regardless of relationship length, with no substantive difference in findings). The sample size of women who had experienced sexual violence prior to February was too small to estimate a reliable model. The assumption was that where measures of economic insecurity are associated with first-time violence, we can be more confident that they contribute to an increased likelihood of violence occurring, rather than being a consequence or feature of abusive relationships. This is particularly true if they are not also correlates of repeat violence.
What this analysis revealed was that certain measures of economic insecurity were associated with first-time physical violence among women who had not experienced violence by their current or most recent partner prior to February 2020, but not repeat physical violence among women who were in previously abusive relationships. Specifically, respondents who had experienced medium (OR=1.6, p<0.05) and high (OR=2.0, p<0.01) levels of financial stress were significantly more likely to have experienced first-time violence in the last 12 months than respondents who had experienced low levels of financial stress. Financial stress was also a strong predictor of first-time sexual and non-physical IPV, though there was some evidence that medium (but not high) levels of financial stress were associated with repeat non-physical abuse (OR=2.8, p<0.01), relative to low levels of financial stress. Conversely, economic hardship – the inability to pay for basic household necessities due to a shortage of money – was consistently associated with both first-time and repeat violence, suggesting that this might reflect both a cause of IPV for some women, and a characteristic of the type of financial abuse experienced by other victims and survivors of IPV.
Importantly, economic disparity was also associated with first-time but not repeat IPV. Specifically, respondents who said they were the main income earner (i.e. breadwinner) were significantly more likely than respondents who said they were not the main income earner to experience physical IPV (OR=1.9, p<0.001), sexual IPV (OR=1.5, p<0.05), and emotionally abusive, harassing and controlling behaviours (OR=1.5, p<0.001) for the first time by their current or most recent partner. However, it was not a significant predictor of any form of IPV among women who said they had experienced violence prior to February 2020. Financial precarity was also associated with first-time violence, but not repeat IPV, but this was also conditional on the relative status of the respondent and their partner. Non-physical abuse was more common among respondents who said they could access $2,000 when their partner couldn’t (OR=2.2, p<0.001) or vice versa (OR=1.4, p<0.05). The same was also true for sexual violence (OR=1.9, p<0.05 and OR=2.0, p<0.01 respectively), though the relationship with repeat sexual violence could not be measured. The exception to this was for physical violence, where a lack of financial precarity among both partners – where they could both access $2,000 – was associated with a lower likelihood of having experienced physical IPV (OR=0.6, p<0.05).
Finally, the level of social support women had was associated with first-time emotionally abusive, harassing and controlling behaviours. Respondents who said they had medium (OR=0.7, p<0.001) and high (OR=0.6, p<0.001) levels of social support were significantly less likely to experience non-physical abuse for the first time in the last 12 months than respondents who had low levels of social support. However, level of social support was not a significant predictor of repeat non-physical abuse among women who had experienced abuse prior to February 2020. The same was also true for respondents who reported medium (OR=0.7, p<0.05) levels of social support and who did not have a history of prior sexual violence by their current or most recent partner, though the relationship with repeat sexual violence could not be measured.
The intersection between economic insecurity and IPV among priority populations
Although it is helpful to identify the independent effect of economic insecurity on experiences of IPV among women, it is important to recognise that for many women, groups and communities, economic insecurity may intersect with other vulnerabilities in their lives to cumulatively increase their risk of IPV. We explore this using predictive margins, which refer to the average predicted probability of the outcome of interest being observed – in this case, the experience of physical violence, sexual violence or emotionally abusive, harassing and controlling behaviours in the 12 months prior to the survey – when certain characteristics are present, controlling for the other variables in the logistic regression models in Table 5. In other words, we estimate the probability of violence when specific forms of economic insecurity and respondent characteristics shown to be associated with IPV in Table 5 were both present, including Indigenous status, health status, pregnancy and living with children. For simplicity, domains of economic insecurity were limited to experiences of economic hardship in the last 12 months and self-reported high levels of financial stress.
Aboriginal and Torres Strait Islander women
After controlling for other factors shown in Table 5, Aboriginal and Torres Strait Islander respondents who were economically insecure were more likely to experience all three forms of IPV, when compared to economically insecure non-Indigenous respondents (Figure 2).
For example, compared to non-Indigenous respondents who reported experiencing at least one form of economic hardship in the last 12 months, Aboriginal and Torres Strait Islander respondents who also reported one form of economic hardship were:
- 2.1 times as likely to experience physical violence (23.7% vs 11.3%)
- 2.3 times as likely to experience sexual violence (19.6% vs 8.7%)
- 1.5 times as likely to experience emotionally abusive, harassing and controlling behaviours (58.5% vs 39.3%) in the last 12 months.
Similar results were identified for financial stress. Compared to non-Indigenous respondents experiencing high levels of financial stress, Aboriginal and Torres Strait Islander respondents who also reported high levels of financial stress were 2.0 times as likely to experience physical violence (28.9% vs 14.5%), 2.1 times as likely to experience sexual violence (24.8% vs 11.6%) and 1.5 times as likely to experience emotionally abusive, harassing and controlling behaviours (63.8% vs 44.9%) in the last 12 months (Figure 2).
Figure 2: Predicted probability of IPV in the 12 months prior to the survey, by Indigenous status and form of economic insecurity (%)
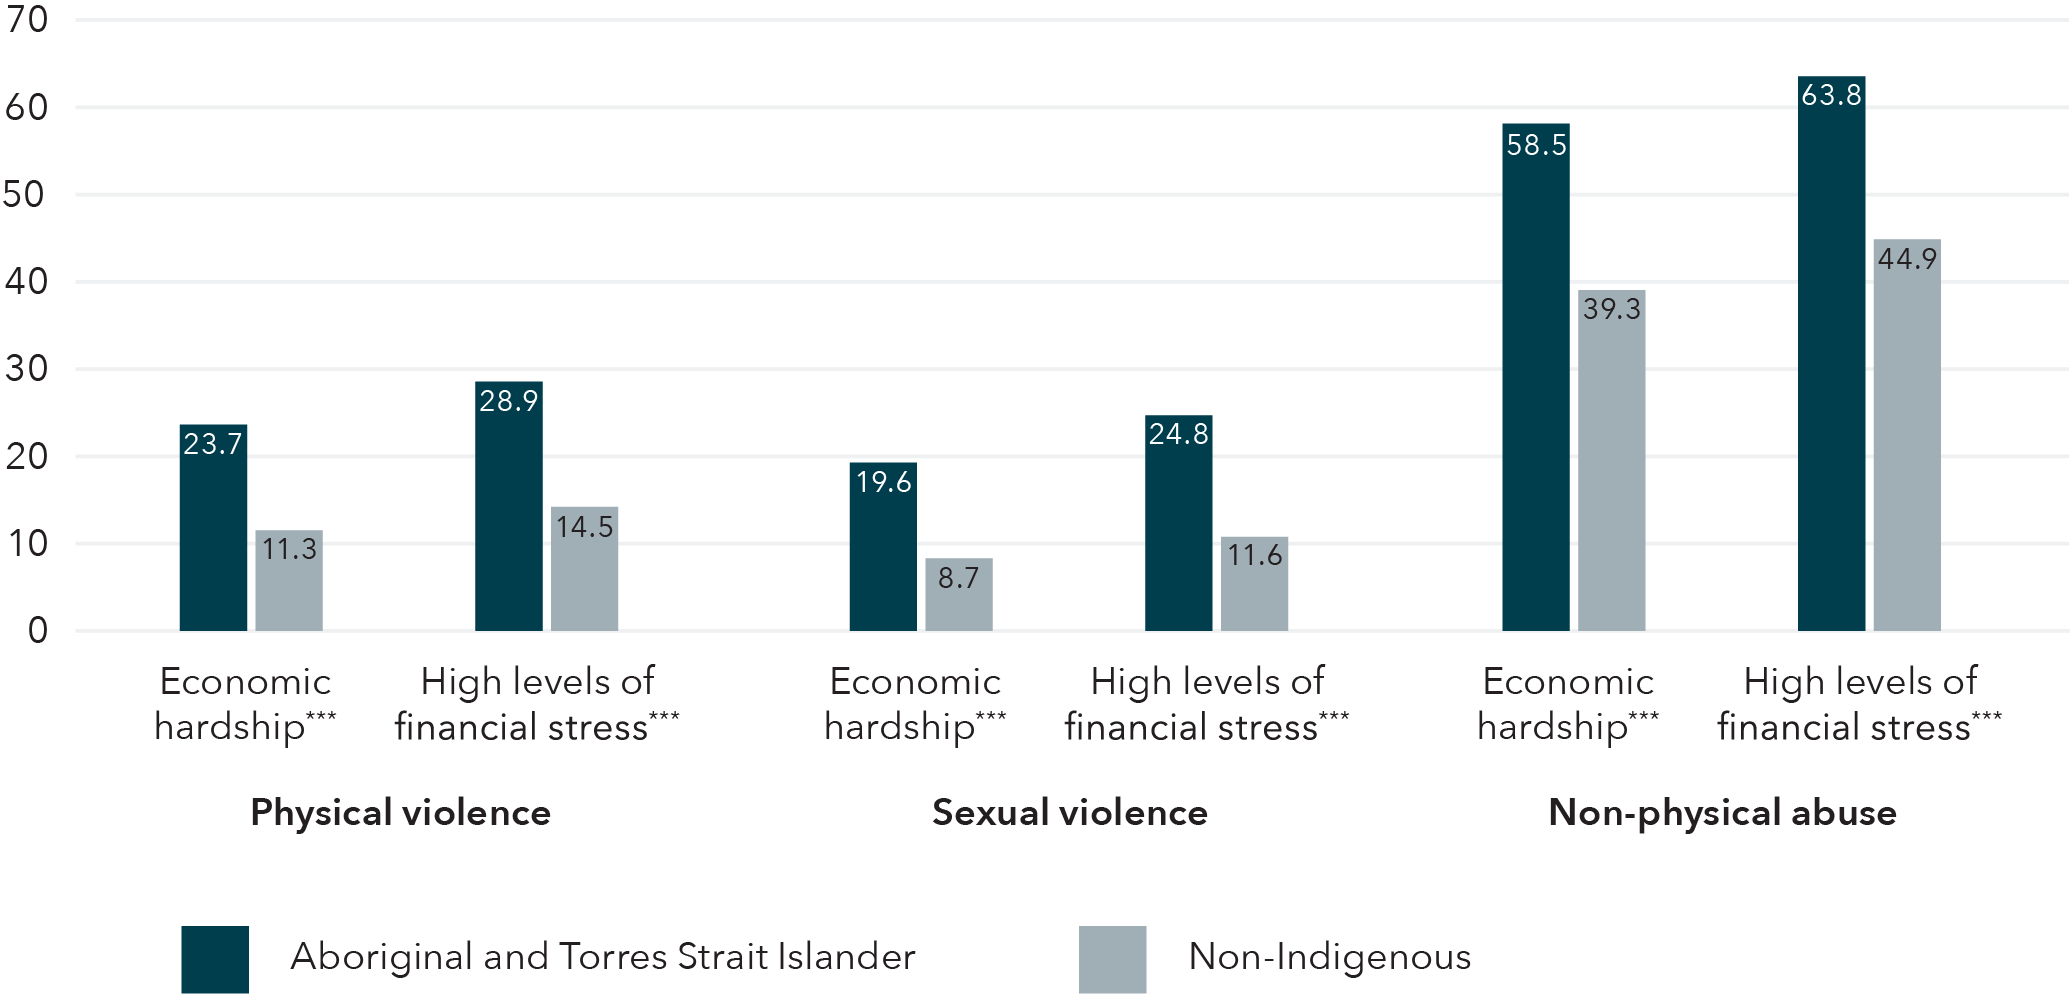
| Form of economic insecurity | Aboriginal and Torres Strait Islander | Non-Indigenous | |
|---|---|---|---|
| Physical violence | Economic hardship*** | 23.7 | 11.3 |
| High levels of financial stress*** | 28.9 | 14.5 | |
| Sexual violence | Economic hardship*** | 19.6 | 8.7 |
| High levels of financial stress*** | 24.8 | 11.6 | |
| Non-physical abuse | Economic hardship*** | 58.5 | 39.3 |
| High levels of financial stress*** | 63.8 | 44.9 |
***p<0.001 **p<0.01 *p<0.05
Note: Controls include age of respondent, Indigenous status, language spoken most of the time at home, sex of partner, place of usual residence, presence of children in the home, pregnancy in the last 12 months, relationship status, cohabitation with partner, whether the respondent was the main income earner, employment status of the respondent and partner, ability of the respondent and their partner to find $2,000 in a week, and respondent’s level of social support.
Source: Impact of COVID-19 on intimate partner violence survey, AIC [Computer file]
Women with a long-term restrictive health condition
After controlling for other factors (see Table 5), respondents who said they had a restrictive long-term health condition and were economically insecure were more likely to experience all three forms of IPV in the last 12 months. As shown in Figure 3, compared to respondents who did not have a health condition and experienced at least one form of economic hardship in the last 12 months, respondents with a long-term restrictive health condition who also reported at least one form of economic hardship were:
- 1.9 times as likely to experience physical violence (19.7% vs 10.6%)
- 2.1 times as likely to experience sexual violence (16.7% vs 8.1%)
- 1.2 times as likely to experience emotionally abusive, harassing and controlling behaviours (45.6% vs 39.0%) in the last 12 months.
Further, compared to respondents who did not have a health condition and reported high levels of financial stress in the last 12 months, respondents with a long-term restrictive health condition who also reported high levels of financial stress were:
- 1.8 times as likely to experience physical violence (24.4% vs 13.6%)
- 2.0 times as likely to experience sexual violence (21.3% vs 10.9%)
- 1.2 times as likely to experience emotionally abusive, harassing and controlling behaviours (52.2% vs 44.5%) in the last 12 months (see Figure 3).
Figure 3: Predicted probability of IPV in the 12 months prior to the survey, by health status and form of economic insecurity (%)
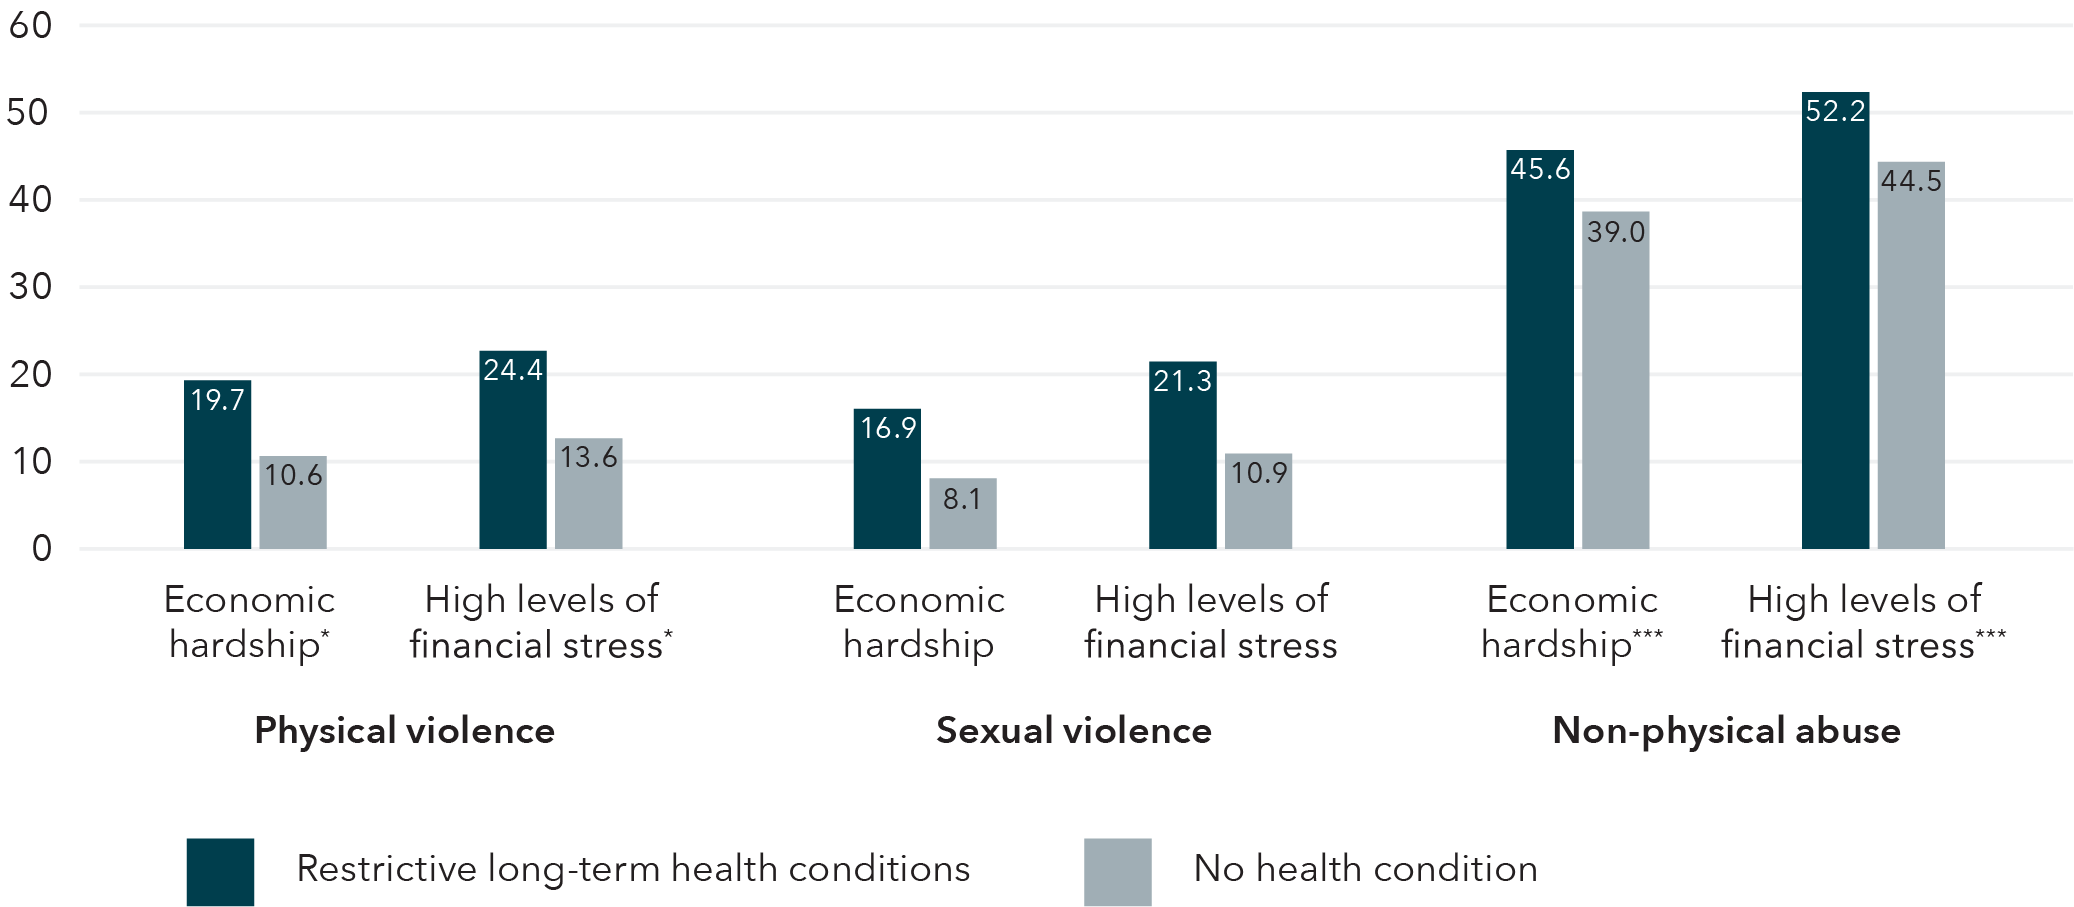
| Form of economic insecurity | Restrictive long-term health conditions | No health condition | |
|---|---|---|---|
| Physical violence | Economic hardship*** | 19.7 | 10.6 |
| High levels of financial stress*** | 24.4 | 13.6 | |
| Sexual violence | Economic hardship*** | 16.9 | 8.1 |
| High levels of financial stress*** | 21.3 | 10.9 | |
| Non-physical abuse | Economic hardship*** | 45.6 | 39.0 |
| High levels of financial stress*** | 52.2 | 44.5 |
***p<0.001 **p<0.01 *p<0.05
Note: Controls include age of respondent, Indigenous status, language spoken most of the time at home, sex of partner, place of usual residence, presence of children in the home, pregnancy in the last 12 months, relationship status, cohabitation with partner, whether the respondent was the main income earner, employment status of the respondent and partner, ability of the respondent and their partner to find $2,000 in a week, and respondent’s level of social support.
Source: Impact of COVID-19 on intimate partner violence survey, AIC [Computer file]
Women living with children
After controlling for all of the other factors shown in Table 5, respondents living with children who were economically insecure were more likely to experience physical violence or emotionally abusive, harassing and controlling behaviours. Compared to respondents who did not have any children in their care and who reported experiencing at least one form of economic hardship in the last 12 months, respondents living with children who also reported one form of economic hardship were 1.2 times as likely to experience physical violence (13.3% vs 11.0%) and 1.2 times as likely to experience emotionally abusive, harassing and controlling behaviours (44.3% vs 37.1%).
Similarly, compared to respondents who did not have children in their care and who experienced high levels of financial stress in the last 12 months, respondents living with children who also reported high levels of financial stress were 1.2 times as likely to experience physical violence (16.8% vs 13.9%) and 1.2 times as likely to experience emotionally abusive, harassing and controlling behaviours (50.0% vs 42.6%) in the last 12 months (Figure 4). However, there was no statistically significant difference between the probability of respondents living with children and respondents who were not living with children in terms of their experiences of sexual violence in the last 12 months.
Figure 4: Predicted probability of IPV in the 12 months prior to the survey, by presence of children in the home and form of economic insecurity (%)
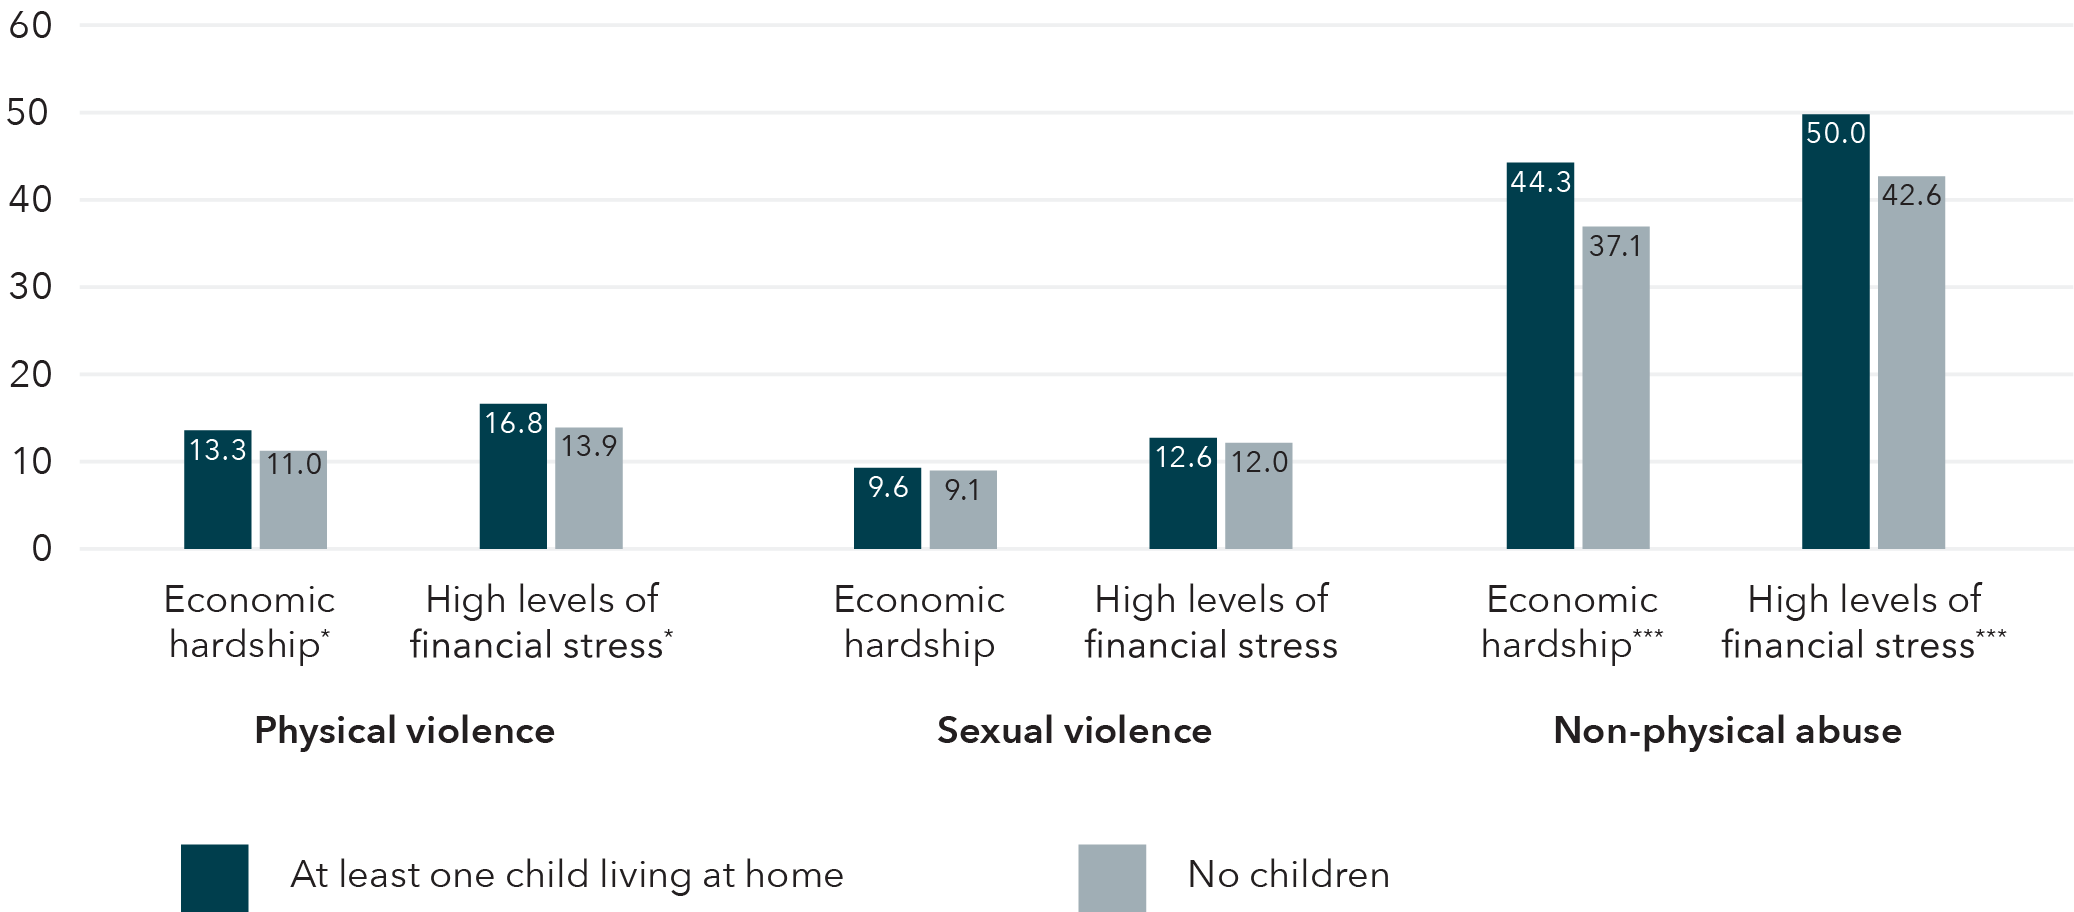
| At least one child living at home | No children | ||
|---|---|---|---|
| Physical violence | Economic hardship*** | 13.3 | 11.0 |
| High levels of financial stress*** | 16.8 | 13.9 | |
| Sexual violence | Economic hardship*** | 9.6 | 9.1 |
| High levels of financial stress*** | 12.6 | 12.0 | |
| Non-physical abuse | Economic hardship*** | 44.3 | 37.1 |
| High levels of financial stress*** | 50.0 | 42.6 |
***p<0.001 **p<0.01 *p<0.05
Note: Controls include age of respondent, Indigenous status, language spoken most of the time at home, sex of partner, place of usual residence, presence of children in the home, pregnancy in the last 12 months, relationship status, cohabitation with partner, whether the respondent was the breadwinner, employment status of the respondent and partner, ability of the respondent and their partner to find $2,000 in a week, and respondent’s assessed level of social support.
Source: Impact of COVID-19 on intimate partner violence survey, AIC [Computer file]
Pregnant women
Economically insecure respondents who said they had been pregnant in the last 12 months were more likely to experience physical or sexual violence than respondents who were also economically insecure but had not been pregnant during this period. For example, compared to respondents who had not been pregnant in the last 12 months and who reported experiencing at least one form of economic hardship in the last 12 months, respondents who also reported one form of economic hardship and had been pregnant were 1.3 times as likely to experience physical violence (15.3% vs 11.6%) and 1.6 times as likely to experience sexual violence (14.0% vs 8.8%).
Similarly, compared to respondents who had not been pregnant in the last 12 months and who reported high levels of financial stress in the last 12 months, respondents who had been pregnant and who also reported high levels of financial stress were 1.3 times as likely to experience physical violence (19.2% vs 14.7%) and 1.6 times as likely to experience sexual violence (18.0% vs 11.6%) in the last 12 months (Figure 5). The differences in the predicted probabilities of having experienced emotionally abusive, harassing and controlling behaviours in the last 12 months were not statistically significant.
Figure 5: Predicted probability of IPV in the 12 months prior to the survey, by pregnancy in last 12 months and form of economic insecurity (%)
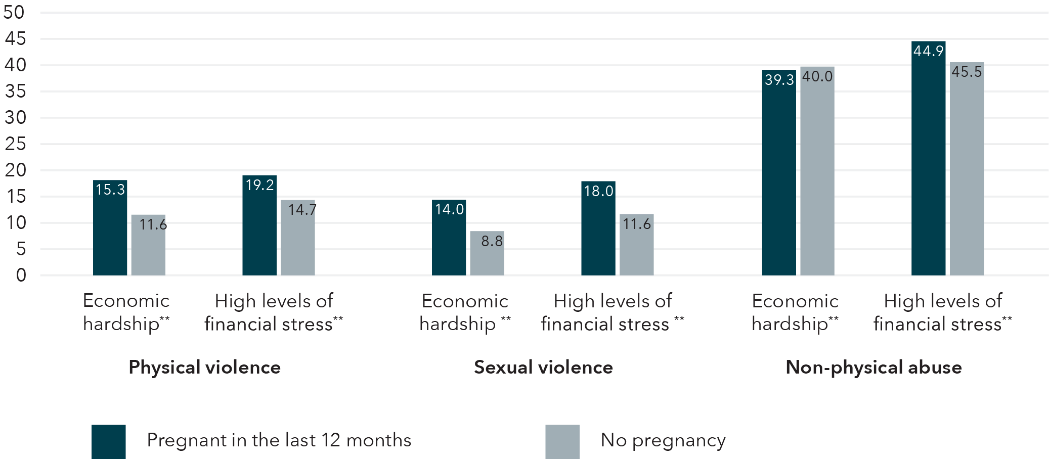
| Form of economic insecurity | Pregnant in the last 12 months | No pregnancy | |
|---|---|---|---|
| Physical violence | Economic hardship*** | 15.3 | 11.6 |
| High levels of financial stress*** | 19.2 | 14.7 | |
| Sexual violence | Economic hardship*** | 14.0 | 8.8 |
| High levels of financial stress*** | 18.0 | 11.6 | |
| Non-physical abuse | Economic hardship*** | 39.3 | 40.0 |
| High levels of financial stress*** | 44.9 | 45.5 |
***p<0.001 **p<0.01 *p<0.05
Note: Controls include age of respondent, Indigenous status, language spoken most of the time at home, sex of partner, place of usual residence, presence of children in the home, pregnancy in the last 12 months, relationship status, cohabitation with partner, whether the respondent was the breadwinner, employment status of the respondent and partner, ability of the respondent and their partner to find $2,000 in a week, and respondent’s assessed level of social support.
Source: Impact of COVID-19 on intimate partner violence survey, AIC [Computer file]
Changes in financial status and their impact on patterns of violence and abuse experienced by women
The next stage of the analysis measures the impact of COVID-19 on IPV experienced by women by exploring the effect of acute pandemic-related economic stressors. This involved examining the onset of IPV within previously non-abusive relationships longer than 12 months, and changes in the frequency and severity of violence and abuse within already abusive relationships. Our main variables of interest were whether the respondent or their partner had lost their job, had to take a pay cut or reduced their hours (hereafter referred to as loss of job or work), as well as a subjective measure of the respondents’ and their partners’ financial situation compared to the same time last year. We also included variables related to changes in social support and mandatory or voluntary quarantine in the last 12 months, alongside sociodemographic and relationship characteristics.
First-time intimate partner violence
The first step was to estimate a series of logistic regression models predicting the likelihood of respondents having experienced first-time physical or sexual violence or emotionally abusive, harassing or controlling behaviours. Results showed that recent changes in the financial status and economic security of respondents were positively associated with the onset of abuse and violence in their relationship (see Table 6). First, compared to women who said their partner’s financial situation had stayed the same, respondents who said that their partner’s financial situation was worse now relative to the same time last year were more likely to experience first-time sexual violence (OR=1.9, p<0.01) and first-time emotionally abusive, harassing and controlling behaviours (OR=1.6, p<0.001). However, positive changes in their partner’s financial situation were also associated with an increase in risk of first-time sexual violence (OR=1.8, p<0.05) and emotionally abusive, harassing and controlling behaviours (OR=1.3, p<0.05). Self-reported changes in the respondent’s own financial situation were not associated with experiences of first-time IPV in their relationships.
There was also evidence that changes in their partner’s employment status was associated with the onset of physical violence and emotionally abusive, harassing and controlling behaviours (non-physical abuse). Compared to respondents whose partners were employed and who hadn’t lost their job or work, women who said that their partner had lost their job or work were more likely to experience the onset of physical violence (OR=2.1, p<0.001) and first-time emotionally abusive, harassing and controlling behaviours (OR=1.2, p<0.05). However, changes in a partner’s employment status were not associated with first-time sexual violence.
Conversely, women who said their partner was never employed in the previous 12 months were also more likely to experience first-time physical (OR=2.4, p<0.001) and non-physical abuse (OR=1.4, p<0.01), suggesting that not just employment, but employment stability, reduces the likelihood of IPV.
Further, after controlling for other factors associated with IPV, compared to respondents who said they had been employed in the last 12 months and had not lost their job, women who had been employed but lost their job were more likely to experience first-time physical violence (OR=1.6, p<0.05) and first-time sexual violence (OR=1.5, p<0.05). The odds of women who had never been employed (in the last 12 months) experiencing the onset of emotionally abusive, harassing and controlling behaviours within the relationship were 30 per cent lower than for women who had been employed and whose jobs had not been impacted (OR=0.7, p<0.01).
A range of other factors, including the sociodemographic characteristics of respondents and relationship characteristics, were also associated with risk of experiencing first-time IPV during the COVID-19 pandemic. For example:
- Compared to respondents who were 25 to 34 years old, older women were less likely to have experienced first-time physical violence, sexual violence or emotionally abusive, harassing and controlling behaviours (see Table 6 for ORs for respondents aged 45–54, 55–64 and 65 years and older).
- Compared to non-Indigenous respondents, Aboriginal and Torres Strait Islander respondents were more likely to have experienced the onset of physical violence (OR=2.1, p<0.01), sexual violence (OR=2.5, p<0.01) and non-physical abuse (OR=3.0, p<0.001).
- Compared to respondents who did not have a long-term restrictive health condition, respondents who did were more likely to have experienced the onset of all three forms of IPV (physical violence OR=2.4, p<0.001; sexual violence OR=2.5, p<0.001; non-physical abuse OR=1.7, p<0.001).
- Compared to respondents who were still in a relationship with their partner, respondents who had separated from their partner were more likely to report having experienced all three forms of IPV (physical violence OR=3.4, p<0.001; sexual violence OR=2.9, p<0.001; non-physical abuse OR=2.7, p<0.001).
Respondents who said that they had less contact with family members and friends in the last 12 months were also more likely to report having experienced first-time physical violence (OR=1.7, p<0.01) and emotionally abusive, harassing and controlling behaviours (OR=1.3, p<0.05), compared to respondents who said their levels of social contact had remained the same. This is consistent with the isolation and control exerted by many IPV perpetrators (Stark & Hester, 2019). Similar results were identified among respondents whose levels of social contact increased in the last 12 months. Compared to women whose level of contact with family members and friends remained unchanged over the last 12 months, respondents who said they had more contact had higher odds of having experienced first-time physical violence (OR=1.8, p<0.01) and emotionally abusive, harassing and controlling behaviours (OR=1.3, p<0.05). Given we did not specify whether this contact was in-person or online, it is possible that this reflects an increase in informal help-seeking among victims and survivors, or the response by a partner seeking to exert their control in response to an increase in social contact by the respondent.
Table 6: Logistic regression model predicting first-time IPV by a current or most recent intimate partner in the 12 months prior to the survey, by type of IPV
Age (vs. 25–34 years)
| Physical violence OR (95% CI)a | Sexual violence OR (95% CI)b | Non-physical abuse OR (95% CI)c | |
|---|---|---|---|
| 18–24 | 1.16 (0.64–2.09) | 1.34 (0.73–2.46) | 1.13 (0.80–1.58) |
| 35–44 | 0.67 (0.47–0.98)* | 0.97 (0.66–1.42) | 0.97 (0.79–1.18) |
| 45–54 | 0.58 (0.36–0.93)* | 1.12 (0.70–1.81) | 0.70 (0.56–0.89)** |
| 55–64 | 0.25 (0.14–0.43)*** | 0.33 (0.16–0.68)** | 0.49 (0.37–0.64)*** |
| 65+ | 0.09 (0.04–0.20)*** | 0.35 (0.14–0.86)* | 0.37 (0.26–0.53)*** |
| Aboriginal and Torres Strait Islander (vs. non-Indigenous) | 2.18 (1.30–3.64)** | 2.45 (1.45–4.12)** | 3.04 (2.03–4.55)*** |
| Non-English-speaking backgrounds (vs. English speaking) | 0.72 (0.42–1.25) | 1.04 (0.63–1.72) | 1.44 (1.11–1.87)** |
| Restrictive long-term health condition (vs. no health condition) | 2.42 (1.67–3.51)*** | 2.55 (1.75–3.73)*** | 1.73 (1.36–2.19)*** |
| Partner is male (vs. partner is female) | 0.84 (0.44–1.59) | 1.30 (0.69–2.47) | 0.91 (0.64–1.28) |
Place of usual residence (vs. metropolitan)
| Physical violence OR (95% CI)a | Sexual violence OR (95% CI)b | Non-physical abuse OR (95% CI)c | |
|---|---|---|---|
| Regional | 0.92 (0.63–1.34) | 1.25 (0.85–1.83) | 1.10 (0.91–1.34) |
| Remote | 1.81 (0.84–3.90) | 1.01 (0.33–3.08) | 0.87 (0.54–1.39) |
| At least one child living at home (vs. no children living at home) | 1.19 (0.85–1.68) | 0.96 (0.67–1.38) | 1.25 (1.04–1.50)* |
| Pregnant in the last 12 months (vs. not pregnant) | 1.29 (0.82–2.03) | 2.17 (1.28–3.67)** | 0.99 (0.77–1.28) |
| Former partner (vs. current partner) | 3.42 (1.93–6.04)*** | 2.86 (1.69–4.85)*** | 2.66 (1.74–4.07)*** |
| Cohabiting (vs. not cohabiting) | 1.25 (0.70–2.23) | 0.63 (0.40–0.99)* | 0.94 (0.69–1.27) |
Respondent employment status (vs. employed and did not take a pay cut/reduce hours/lost their job in last 12 months)
| Physical violence OR (95% CI)a | Sexual violence OR (95% CI)b | Non-physical abuse OR (95% CI)c | |
|---|---|---|---|
| Never employed in last 12 months | 1.15 (0.79–1.69) | 0.77 (0.48–1.24) | 0.73 (0.60–0.89)** |
| Employed and took a pay cut/reduced hours/lost job in last 12 months | 1.59 (1.09–2.31)* | 1.51 (1.03–2.22)* | 1.06 (0.87–1.29) |
Partner’s employment status (vs. employed and did not take a pay cut/reduce hours/lost their job in last 12 months)
| Physical violence OR (95% CI)a | Sexual violence OR (95% CI)b | Non-physical abuse OR (95% CI)c | |
|---|---|---|---|
| Never employed in last 12 months | 2.46 (1.66–3.65)*** | 1.25 (0.75–2.09) | 1.43 (1.15–1.79)** |
| Employed and took a pay cut/reduced hours/lost job in last 12 months | 2.12 (1.45–3.11)*** | 1.36 (0.93–1.99) | 1.23 (1.01–1.49)* |
Respondent’s financial situation compared to 12 months ago (vs. unchanged)
| Physical violence OR (95% CI)a | Sexual violence OR (95% CI)b | Non-physical abuse OR (95% CI)c | |
|---|---|---|---|
| Worse | 1.15 (0.74–1.77) | 1.31 (0.85–2.01) | 1.16 (0.92–1.47) |
| Better | 0.99 (0.62–1.59) | 0.87 (0.53–1.43) | 0.91 (0.72–1.15) |
Partner’s financial situation compared to 12 months ago (vs. unchanged)
| Physical violence OR (95% CI)a | Sexual violence OR (95% CI)b | Non-physical abuse OR (95% CI)c | |
|---|---|---|---|
| Worse | 1.31 (0.82–2.09) | 1.90 (1.19–3.04)** | 1.59 (1.24–2.04)*** |
| Better | 1.25 (0.79–1.98) | 1.78 (1.11–2.83)* | 1.26 (1.00–1.58)* |
Respondent’s level of contact with friends and family members that they do not usually live with (vs. stayed the same)
| Physical violence OR (95% CI)a | Sexual violence OR (95% CI)b | Non-physical abuse OR (95% CI)c | |
|---|---|---|---|
| Decrease | 1.67 (1.16–2.39)** | 0.83 (0.55–1.24) | 1.25 (1.05–1.50)* |
| Increase | 1.84 (1.25–2.72)** | 1.18 (0.82–1.70) | 1.33 (1.09–1.62)** |
| Respondent had to spend time in quarantine (mandatory and voluntary) in last 12 months (vs. no) | 0.95 (0.61–1.49) | 1.19 (0.78–1.82) | 1.09 (0.89–1.33) |
| Partner had to spend time in quarantine (mandatory and voluntary) in last 12 months (vs. no) | 1.18 (0.77–1.83) | 0.84 (0.56–1.27) | 0.71 (0.58–0.87)** |
| Constant | 0.01 (0.01–0.03)*** | 0.02 (0.01–0.04)*** | 0.23 (0.14–0.37)*** |
a Sub-population n=7,723 (weighted), F=9.06, AUC=0.78, p<0.001. Eligible cases with missing data n=481 (5.9%).
b Sub-population n=8,026 (weighted), F=8.59, AUC=0.77, p<0.001. Eligible cases with missing data n=497 (5.8%).
c Sub-population n=7,100 (weighted), F=10.89, AUC=0.69, p<0.001. Eligible cases with missing data n=421 (5.6%).
OR=odds ratio; 95% CIs=95% confidence interval.
***p<0.001 **p<0.01 *p<0.05
Source: Impact of COVID-19 on intimate partner violence survey, AIC [Computer file]
To analyse the potential role of economic disparity in the occurrence of first-time IPV, we estimated the average predictive margins for the different combinations of employment status of respondents and their partners. The predicted probabilities are presented in Figure 6.
While the relationship between the respondent and their partner’s employment and probability of IPV varied according to the type of IPV, several patterns were observed. First, the probability of first-time violence was generally highest when both partners were employed and both had lost their job or work (5.9% for physical violence, 5.6% for sexual violence and 22.6% for non-physical abuse), or where the respondent was employed but lost her job or work and her partner was unemployed (6.7% for physical violence, 5.1% for sexual violence and 25.2% for non-physical abuse). First-time violence was least common when both partners were employed and neither had lost their job or work (1.9% for physical violence, 2.9% for sexual violence and 18.6% for non-physical abuse), or where the respondent was not working and their partner was employed and didn’t experience any changes to their employment status or work hours (2.2% for physical violence, 2.2% for sexual violence and 14.6% for non-physical abuse).
The probability of violence was higher when the respondent lost her job or work and her partner was unemployed than when the respondent was unemployed and her partner lost their job or work (e.g. 6.7% vs. 4.4% for physical violence). The probability of violence was also higher when the respondent was employed and their partner was unemployed than in circumstances where the partner was employed and the respondent was not (e.g. 24.2% vs 14.6% for non-physical abuse). Both patterns point to the potential role that economic dependence and backlash to the loss of that dependence may play in the onset of violence in non-abusive relationships, and also to the role of economic disparity and, in cases where the partner was male, violation of gender norms regarding who should maintain the earning power in a relationship.
Figure 6: Predicted probability of first-time IPV in the 12 months prior to the survey, by respondent and partner employment status and IPV type (%)
| First-time physical violence | First-time sexual violence | First-time non-physical abuse |
|---|---|---|
 6.7% |  5.6% |  25.2% |
 5.9% |  5.1% |  24.2% |
 5.1% |  4.2% |  22.6% |
 4.5% |  3.8% |  21.7% |
 4.4% |  3.5% |  19.4% |
 3.9% |  3.0% |  19.3% |
3.0% |  2.8% |  18.6% |
 2.2% |  2.9% |  17.2% |
 1.9% |  2.2% |  14.6% |
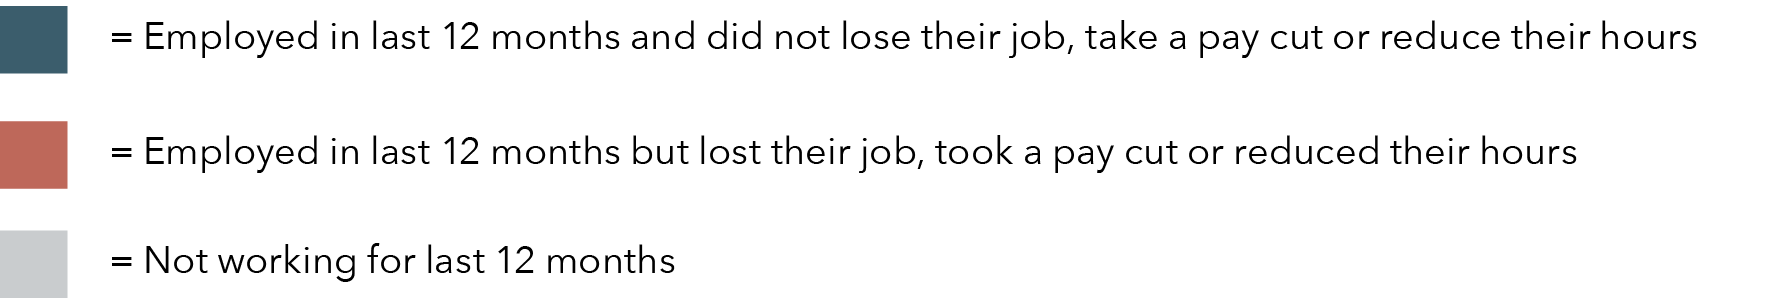
Note: Controls include age of respondent, Indigenous status, health status, language spoken most of the time at home, sex of partner, place of usual residence, presence of children in the home, pregnancy in the last 12 months, relationship status, cohabitation with partner, respondent’s financial status, partner’s financial status, changes in frequency of contact with family members and friends that they do not usually live with, and whether the respondent or their partner was in mandatory or voluntary quarantine at any stage in the last 12 months. Employment includes working on a full-time, part-time or casual basis.
Source: Impact of COVID-19 on intimate partner violence survey, AIC [Computer file]
Escalation of intimate partner violence
The final stage of the analysis examined factors associated with the escalation or de-escalation of IPV using multinomial logistic regression. Multinomial logistic regression is used when the dependent variable has multiple outcomes – in this case, whether the IPV experienced by respondents in historically abusive relationships had increased in severity or frequency, decreased in severity or frequency, or stayed the same, when compared with the equivalent period prior to February 2020. The interpretation of the results is largely the same as with logistic regression, except in this case findings are relative to respondents who said that the abuse – while it had continued during the 12 months prior to the survey – had not increased in frequency or severity (base category). Relative risk ratios are reported in place of odds ratios.
Results are presented in Table 7 (physical violence) and Table 8 (emotionally abusive, harassing and controlling behaviours). The sample of respondents who had experienced sexual IPV in the last 12 months and prior to February 2020 was too small to estimate a reliable model.
While a respondent’s employment status in the last 12 months was not associated with the escalation of IPV, respondents who reported that their partner had lost their job, taken a pay cut or had to reduce their hours were:
- more likely to report that physical violence had increased in frequency or severity (RRR =4.5, p<0.01) when compared to respondents whose partner’s employment had not been negatively impacted
- more likely to report that emotionally abusive, harassing and controlling behaviours had increased in frequency or severity (RRR=2.0, p<0.01).
Moreover, compared to respondents who said their financial situation had not changed, respondents who said their financial situation had improved when compared with 12 months ago were more likely to experience a de-escalation of physical violence (RRR=3.1, p<0.05), but an increased likelihood of escalating physical violence (RRR=2.6, p<0.05) and emotionally abusive, harassing and controlling behaviours (RRR=1.9, p<0.05). This is indicative of the complex role of economic stressors in relationships characterised by ongoing patterns of abuse. It is possible that women’s improved financial situation is a protective factor in already violent relationships, but it might also be a provocation in some relationships, especially those characterised by more traditional gender norms regarding men’s and women’s earning power. While the relationship between job loss or lost work and escalating violence suggests that changes in employment exacerbated the risk of violence, we cannot rule out the possibility that escalating violence impacted the respondent’s employment (Lindhorst et al., 2007), though the evidence of the direct impact of IPV on employment status is not certain (Lloyd, 1997). Similarly, the relationship between changes in financial stress and de-escalating violence – especially in relationships characterised by historical abuse – might be indicative of financial stress as either a cause or consequence of violence (Breiding et al., 2017).
Consistent with the findings from the analysis of first-time IPV, changes in the respondent’s level of contact with family members and friends were also associated with escalation of IPV. Respondents who reported that their contact with others had increased were more likely to experience an escalation of physical violence (RRR=6.8, p<0.001) and the escalation of emotionally abusive, harassing and controlling behaviours (RRR=3.8, p<0.001). Respondents may have experienced an increase in violence as a consequence of their increased social interaction, by a partner threatened by the loss of control. Conversely, the escalation of violence may have led to the dissolution of the relationship, followed by an increase in social contact. The direction of the association cannot be determined.
Finally, respondents were less likely to experience an increase in the frequency or severity of non-physical violence if their partner had spent time in voluntary or mandatory quarantine in the 12 months prior to the survey (RRR=0.6, p<0.05), when compared to respondents who said their partner had not spent time in quarantine.
Table 7: Multinomial logistic regression model predicting escalation or de-escalation of physical IPV by respondents’ current or most recent intimate partner in the 12 months prior to the survey (RRR, 95% CIs)
Age (vs. 25–34 years)
| Escalation | De-escalation | |
|---|---|---|
| 18–24 | 0.89 (0.20–3.99) | 0.77 (0.17–3.59) |
| 35–44 | 0.84 (0.36–1.97) | 0.40 (0.16–0.99)* |
| 45–54 | 0.98 (0.36–2.71) | 0.88 (0.33–2. 31) |
| 55–64 | 3.52 (0.83–14.88) | 0.74 (0.21–2. 62) |
| 65+ | 2.29 (0.38–13.96) | 0.77 (0.15–3.83) |
| Aboriginal and Torres Strait Islander (vs. non-Indigenous) | 0.84 (0.31–2.26) | 0.92 (0.35–2.39) |
| Non-English-speaking backgrounds (vs. English speaking) | 0.31 (0.04–2.36) | 0.45 (0.11–1.80) |
| Restrictive long-term health condition (vs. no health condition) | 1.47 (0.67–3.25) | 1.83 (0.81–4.18) |
| Partner is male (vs. partner is female) | 3.21 (1.04–9.89)* | 1.44 (0.45–4.63) |
Place of usual residence (vs. metropolitan)
| Escalation | De-escalation | |
|---|---|---|
| Regional | 1.19 (0.58–2.45) | 1.26 (0.59–2.68) |
| Remote | 4.61 (0.94–22.56) | 4.69 (0.77–28.44) |
| At least one child living at home (vs. no children living at home) | 1.18 (0.53–2.64) | 0.52 (0.24–1.12) |
| Pregnant in the last 12 months (vs. not pregnant) | 1.96 (0.74–5.21) | 2.30 (0.85–6.19) |
| Former partner (vs. current partner) | 0.80 (0.34–1.92) | 0.29 (0.10–0.86)* |
| Cohabiting (vs. not cohabiting) | 1.39 (0.47–4.12) | 1.02 (0.32–3.20) |
Respondent employment status (vs. employed and did not take a pay cut/reduce hours/lost their job in last 12 months)
| Escalation | De-escalation | |
|---|---|---|
| Never employed in last 12 months | 1.05 (0.40–2.81) | 1.17 (0.49–2.78) |
| Employed and took a pay cut/reduced hours/lost job in last 12 months | 1.14 (0.44–2.95) | 0.97 (0.41–2.30) |
Partner’s employment status (vs. employed and did not take a pay cut/reduce hours/lost their job in last 12 months)
| Escalation | De-escalation | |
|---|---|---|
| Never employed in last 12 months | 1.64 (0.69–3.88) | 1.31 (0.56–3.03) |
| Employed and took a pay cut/reduced hours/lost job in last 12 months | 4.53 (1.92–10.69)** | 1.29 (0.53–3.13) |
Respondent’s financial situation compared to 12 months ago (vs. unchanged)
| Escalation | De-escalation | |
|---|---|---|
| Worse | 0.66 (0.28–1.55) | 1.13 (0.47–2.71) |
| Better | 2.64 (1.01–6.92)* | 3.09 (1.12–8.53)* |
Partner’s financial situation compared to 12 months ago (vs. unchanged)
| Escalation | De-escalation | |
|---|---|---|
| Worse | 2.31 (0.96–5.60) | 0.96 (0.39–2.38) |
| Better | 1.95 (0.81–4.70) | 1.02 (0.41–2.58) |
Respondent’s level of contact with friends and family members that they do not usually live with (vs. stayed the same)
| Escalation | De-escalation | |
|---|---|---|
| Decrease | 1.81 (0.71–4.61) | 1.48 (0.68–3.24) |
| Increase | 6.80 (2.64–17.48)*** | 2.39 (1.00–5.75) |
| Respondent had to spend time in quarantine (mandatory and voluntary) in last 12 months (vs. no) | 1.61 (0.74–3.51) | 0.72 (0.35–1.51) |
| Partner had to spend time in quarantine (mandatory and voluntary) in last 12 months (vs. no) | 0.69 (0.30–1.64) | 0.82 (0.36–1.85) |
| Constant | 0.02 (0.00–0.18)*** | 0.61 (0.08–4.38) |
Base category is respondents who said that the severity and frequency of violence had stayed the same.
RRR=relative risk ratio; 95% CIs=95% confidence interval.
a Sub-population n=394 (weighted), F=2.18. Eligible cases with missing data n=48 (10.9%).
***p<0.001 **p<0.01 *p<0.05
Source: Impact of COVID-19 on intimate partner violence survey, AIC [Computer file]
Table 8: Multinomial logistic regression model predicting escalation or de-escalation of non-physical IPV by respondents’ current or most recent intimate partner in the 12 months prior to the survey (RRR, 95% CIs)a
Age (vs. 25–34 years)
| Escalation | De-escalation | |
|---|---|---|
| 18–24 | 0.94 (0.32–2.77) | 0.65 (0.23–1.85) |
| 35–44 | 1.12 (0.67–1.87) | 0.52 (0.30–0.90)* |
| 45–54 | 1.11 (0.64–1.92) | 0.67 (0.37–1.21) |
| 55–64 | 1.00 (0.49–2.04) | 0.59 (0.29–1.20) |
| 65+ | 1.03 (0.45–2.35) | 0.37 (0.23–1.20) |
| Aboriginal and Torres Strait Islander (vs. non-Indigenous) | 1.18 (0.52–2.67) | 1.95 (0.87–4.35) |
| Non-English-speaking backgrounds (vs. English speaking) | 0.87 (0.36–2.11) | 0.47 (0.17–1.17) |
| Restrictive long-term health condition (vs. no health condition) | 1.86 (1.13–3.04)* | 1.16 (0.66–2.07) |
| Partner is male (vs. partner is female) | 1.11 (0.41–2.99) | 0.74 (0.29–1.91) |
Place of usual residence (vs. metropolitan)
| Escalation | De-escalation | |
|---|---|---|
| Regional | 0.76 (0.50–1.16) | 0.96 (0.61–1.49) |
| Remote | 0.62 (0.27–1.45) | 0.85 (0.30–2.37) |
| At least one child living at home (vs. no children living at home) | 1.49 (0.97–2.28) | 1.12 (0.71–1.76) |
| Pregnant in the last 12 months (vs. not pregnant) | 1.63 (0.80–3.33) | 1.48 (0.75–2.92) |
| Former partner (vs. current partner) | 1.12 (0.67–1.89) | 0.27 (0.13–0.58)** |
| Cohabiting (vs. not cohabiting) | 1.10 (0.58–2.07) | 1.16 (0.52–2.58) |
Respondent employment status (vs. employed and did not take a pay cut/reduce hours/lost their job in last 12 months)
| Escalation | De-escalation | |
|---|---|---|
| Never employed in last 12 months | 1.06 (0.66–1.72) | 0.96 (0.59–1.56) |
| Employed and took a pay cut/reduced hours/lost job in last 12 months | 1.46 (0.92–2.32) | 1.18 (0.72–1.94) |
Partner’s employment status (vs. employed and did not take a pay cut/reduce hours/lost their job in last 12 months)
| Escalation | De-escalation | |
|---|---|---|
| Never employed in last 12 months | 1.49 (0.90–2.45) | 1.12 (0.68–1.86) |
| Employed and took a pay cut/reduced hours/lost job in last 12 months | 2.01 (1.26–3.22)** | 1.11 (0.67–1.84) |
Respondent’s financial situation compared to 12 months ago (vs. unchanged)
| Escalation | De-escalation | |
|---|---|---|
| Worse | 1.59 (0.97–2.59) | 1.36 (0.83–2.23) |
| Better | 1.92 (1.12–3.28)* | 1.34 (0.78–2.30) |
Partner’s financial situation compared to 12 months ago (vs. unchanged)
| Escalation | De-escalation | |
|---|---|---|
| Worse | 1.14 (0.69–1.88) | 0.88 (0.52–1.49) |
| Better | 1.24 (0.75–2.06) | 1.33 (0.80–2.21) |
Respondent’s level of contact with friends and family members that they do not usually live with (vs. stayed the same)
| Escalation | De-escalation | |
|---|---|---|
| Decrease | 1.53 (0.95–2.48) | 0.94 (0.61–1.45) |
| Increase | 3.84 (2.34–6.28)*** | 1.27 (0.76–2.12) |
| Respondent had to spend time in quarantine (mandatory and voluntary) in last 12 months (vs. no) | 1.41 (0.90–2.22) | 0.99 (0.59–1.65) |
| Partner had to spend time in quarantine (mandatory and voluntary) in last 12 months (vs. no) | 0.56 (0.36–0.88)* | 0.88 (0.53–1.46) |
| Constant | 0.15 (0.04–0.53)** | 1.02 (0.26–4.01) |
Base category is respondents who said that the severity and frequency of violence had stayed the same.
RRR=relative risk ratio; 95% CIs=95% confidence interval.
a Sub-population n=1,055 (weighted), F=3.30. Eligible cases with missing data n=61 (5.5%).
***p<0.001 **p<0.01 *p<0.05
Source: Impact of COVID-19 on intimate partner violence survey, AIC [Computer file]
Discussion
The aim of this study was to explore the relationship between economic insecurity and IPV within the context of the COVID-19 pandemic. We found strong evidence that women’s economic insecurity was associated with the likelihood of having experienced IPV in the last 12 months. However, the relationship was complex, and varied according to the domain of economic security and the type and pattern of IPV. In this section we highlight the key findings from this report and the implications for policy and practice.
Key finding 1: Experiences of economic insecurity were common among women living in Australia during the first 12 months of the COVID-19 pandemic
High levels of economic insecurity were reported by women who participated in the survey across multiple domains. In addition, while we note the limitations of relying on an assessment by respondents, the prevalence of economic insecurity, and the impact of that insecurity, was greater among women relative to their partners. For example, while one in three women (31.3%) said they had been laid off, lost their job or had to take a pay cut/reduce their hours in the last 12 months, only one in four women said the same of their partner (24.7%). This finding is consistent with research which suggests women have been more negatively impacted by the pandemic than men, given the concentration of job losses in industries with higher proportions of female employees (Churchill, 2021; Reichelt et al., 2021). This includes early childhood education, tourism, retail and hospitality. In mid-2020 following the first national lockdown, the proportion of women who were unemployed and looking for work was as high as 9.1 per cent, while at the same time 7.1 per cent of men were unemployed and looking for work (ABS, 2021b).
The economic status of women has also been negatively impacted because of their role as primary carers of children, and the rise in parent-only childcare arrangements during different stages of the pandemic (Hand et al., 2020; Power, 2020). For example, a survey of over 7,000 Australian men and women conducted by Hand and colleagues (2020) found that a much higher proportion of women than men were identified as the primary carer for children both before (54% vs 8%) and after the initial stages of the COVID-19 period (52% vs 11%). Further, although research has shown that both men and women have reported that the number of hours per week they spend on caring for children has increased during the pandemic, women still spent on average twice the number of hours caring for children than their partner (Johnston et al., 2020). Unsurprisingly then, research in Australia and overseas has shown that women were more likely than men to voluntarily reduce their hours of paid work so that they could take on additional childcare responsibilities during the pandemic (Collins et al., 2021). Taken together, this evidence suggests that women’s workforce participation has decreased during the COVID-19 pandemic, more so than it has for men (Wood et al., 2021).
Beyond the specific impact of the COVID-19 pandemic on their employment status, there was also evidence that respondents were more economically insecure than their partner. For example, 31.6 per cent of respondents said they had experienced at least one form of economic hardship in the last 12 months, compared to one in five respondents who said their partner had (20.2%). The most common economic hardship reported by respondents was being unable to pay essential household bills on time (18.1%), while one in 10 respondents said they had gone without meals (9.8%) and 1.5 per cent said their children had. High levels of financial precarity, defined as being unable to raise $500 in a week if they had to, was also more common among respondents than their partners (16.3% vs 11.7%).
Overall, 40.9 per cent of respondents said they were anxious about their financial situation, while only 25.5 per cent of respondents said the same of their partner. A larger proportion of respondents also reported higher levels of financial stress compared to their partners. Specifically:
- 24.5 per cent of respondents said they had difficulty controlling worrying about their financial situation (14.4% of partners)
- 19.4 per cent of respondents said they had difficulty concentrating because of their financial situation (11.2% of partners)
- 20.8 per cent of respondents said they had difficulty sleeping because of their financial situation (12.0% of partners).
Importantly, the financial stress experienced by women who participated in the survey was associated with the likelihood of experiencing IPV by a current or most recent former partner.
Key finding 2: Economic insecurity was associated with an increased likelihood of IPV among women
Economic insecurity was positively associated with the likelihood of having experienced physical violence, sexual violence and emotionally abusive, harassing and controlling behaviours by a current or most recent partner in the last 12 months. For example, respondents who reported economic hardship during the first 12 months of the COVID-19 pandemic, such as skipping meals or being unable to heat and cool their home, were more likely to experience all three forms of IPV compared to respondents who did not experience economic hardship.
Further, respondents who experienced medium or high levels of financial stress were more likely to experience all forms of IPV. Critically, this relationship was present even after controlling for the relative economic status of individuals, including experiences of economic hardship and financial precarity which are likely contributors to feelings of financial stress. In other words, even in situations where respondents were economically secure, they were more likely to experience IPV if they were experiencing emotional distress as a result of their financial situation.
Seen through a family stress theory lens, it may be that financial stress experienced by one or more partners in a relationship may lead to conflict within the relationship, and in turn increase the risk of violence (Ahmadabadi et al., 2020; Wu & Xu, 2020). While the financial stress levels of partners could not be included in the regression analyses due to missing data (a large number of respondents were unsure of the impact of financial stress on their partners), among those respondents for whom data were available there was a relationship between partners’ financial stress levels and their likelihood of being abusive towards the respondent. Bivariate analyses revealed a statistically significant association between partners’ financial stress levels and the likelihood of respondents having experienced physical violence (F=244.9, p<0.001), sexual violence (F =207.6, p<0.001) and emotionally abusive, harassing and controlling behaviours (F =311.03, p<0.001). For example, 5.6 per cent of respondents who said their partner was experiencing low levels of financial stress had experienced physical violence by that partner in the last 12 months, compared with 17.1 per cent of women whose partners were experiencing medium levels of financial stress and 33.8 per cent of women whose partners were experiencing high levels of financial stress. It is also worth noting that respondents who lost their job or work during the pandemic, or who said their partner had, were also at greater risk of first-time IPV, while the escalation of violence in abusive relationships was more likely when only the partner had lost their job or work. Even with the financial supports that were available, especially in the early stages of the pandemic, it’s likely that this was disruptive and emotionally stressful for many relationships.
Previous research has shown that situational and acute stressors can increase the risk of IPV. This has led some researchers and practitioners to recommend that IPV perpetrator interventions include information about stress management and conflict resolution strategies, as well as education and information about gender inequity and gender norms (Copp et al., 2016; Roberts et al., 2011). In reflecting on similar findings from their own study, Roberts and colleagues suggested:
In terms of practice, the current results indicate that intervention programs may want to explore more extensively the role of stress and reaction to stress in perpetration, particularly among individuals with histories of childhood maltreatment … Stress management training, mindfulness training, and psychotherapy reduce reactivity to stress and therefore may be useful in treating perpetrators. (Roberts et al., 2011, p. 136)
Ensuring that IPV perpetrator interventions include stress management and mitigation training may be particularly important during periods of economic downturn (not limited to pandemic conditions), even when the victim and survivor and perpetrator have not been economically impacted. This research is also consistent with prior research into the consequences of natural disasters, such as bushfires and floods (Harville et al., 2011; Parkinson, 2019; Peterman, Potts, et al., 2020b; Thurston et al., 2021), and further reinforces the need to be prepared for future periods of economic stress and ready to deploy resources to support communities that are negatively impacted (especially noting the significant bushfires that occurred just 12 months prior to the COVID-19 pandemic).
However, while there was a positive association between economic insecurity and IPV, the use of a cross-sectional survey means the direction of this relationship could not be established with certainty. It is likely that economic insecurity experienced by women was an outcome of the violence and abuse they experienced, rather than a factor that contributed to its occurrence. Certainly, various studies have shown that IPV can have a range of negative economic impacts on women, including unemployment and under-employment, welfare dependence and homelessness (Cortis & Bullen, 2016). Economic insecurity as an outcome of IPV may be particularly likely among women who experience financial abuse. Financial abuse is defined as “a dynamic of the abuser holding economic power over the survivor and the abuser limiting the survivor’s ability to gain or keep financial independence” (Hageman & St. George, 2018, p. 391). One in five respondents (19.3%) to this survey experienced some form of economic abuse, including their partner keeping financial information from them, making major purchases using the respondent’s money or shared money without talking to them, refusing to contribute to household expenses, and pressuring or intimidating them to give them money or access to their money (Boxall & Morgan, 2021).
That said, financial stress was associated with first-time physical and sexual violence in previously non-abusive relationships and not repeat violence, while job loss or lost work was associated with first-time and escalating violence. Were financial stress a consequence of the IPV experienced by respondents, rather than a contributing factor towards women’s experience of IPV, then we would expect it to be associated with repeat violence in already abusive relationships. This finding is consistent with Australian longitudinal research which has found that financial stress precedes women’s experiences of IPV (Smith & Weatherburn, 2013). Financial stress was also a strong predictor of first-time sexual and non-physical IPV, though there was some evidence that medium (but not high) levels of financial abuse were associated with repeat non-physical abuse. While we did not examine the relationship between job loss and lost work and repeat violence, research during the early stages of the pandemic found no relationship with repeat IPV (Morgan & Boxall, 2020). Conversely, economic hardship – the inability to pay for basic household necessities due to a shortage of money – was associated with both first-time and repeat violence, suggesting that it may be a cause of IPV in some relationships and, in others, be characteristic or a consequence of the type of financial abuse experienced by victims and survivors of IPV.
Regardless of the direction of the relationship, the high rate of economic insecurity among victims and survivors is evidence that many women who experience IPV may require economic support and material resources in order to leave abusive relationships, and also maintain their independence and longer term safety (Lucero et al., 2016). This could include access to stable housing, income support, debt forgiveness, microloans and access to affordable childcare options if women choose to enter the workforce.
Key finding 3: Economic disparity within relationships was associated with IPV, even after controlling for economic insecurity
Economic disparity between partners was associated with recent experiences of IPV. Women who were the main income earners, were employed when their partner was not, or had access to financial savings that their partner did not (or vice versa) were more likely to experience one or more forms of IPV. The relationship between relative earning power (i.e. being the main income earner) and violence is consistent with recent Australian research using the ABS PSS, which found that violations of the gender norm that male partners should earn more than female partners were associated with a significant increase in the likelihood of IPV (Zhang & Breunig, 2021). Though we did not expressly examine the role of gender norms in this study, the vast majority of women who responded to the survey (95%) said their current or most recent partner was male.
The relationship between the relative employment status of the respondent and their partner and IPV also highlights the important role of economic disparity. Specifically, compared to respondents who said that both she and her partner were unemployed for the last 12 months, women who were employed but whose partner was unemployed were more likely to experience sexual violence, and women who were unemployed while their partner was employed were less likely to report experiences of physical violence. This finding – that the effects of a woman’s employment on IPV appears conditional on the employment status of their partner – is consistent with previous research into the relationship between employment and IPV (Macmillan & Gartner, 1999).
There are various feminist-informed frameworks that can help explain the role of economic disparity in IPV. For example, gender role strain theory suggests that IPV is more likely in situations where men perceive themselves to be failing to live up to their internalised notions of hegemonic masculinity (Copenhaver et al., 2000; Jakupcak, 2003; Jakupcak et al., 2002). Men who feel that they are economically subordinate to their partners – or even have comparable levels of economic power with their partner – may feel that their masculinity is being threatened and use violence and abuse against their partner to re-establish feelings of control and dominance in the relationship. This is supported in part by research from developing nations which has found that microfinance schemes that are intended to provide disadvantaged women with financial independence from their partners may actually cause IPV to increase as their male partners feel threatened and emasculated (Eggers del Campo & Steinart, 2020; Hughes et al., 2015).
However, gender role strain theory does not explain the finding that partners who were less financially precarious than respondents (i.e. their partner would be able to find $2,000 in a week while the respondent would not) were more likely to use violence and abuse against them. In situations where women are more financially dependent on their partner, perpetrators may be abusive towards them because of a feeling of entitlement (Ahmadabadi et al., 2020; Fox et al., 2002). Relative resource theory suggests that domestic partners use the resources that are available to them to obtain power and control within the relationship (Ahmadabadi et al., 2020). In situations where men have more economic power within the relationship, they may use this to justify their abusive behaviours. Similarly, economic dependence has been identified as a barrier to leaving violent relationships (Anderson & Saunders, 2003) and formal help-seeking (Barrett & Pierre, 2011), because this may expose victims and survivors to additional hardship if their partner withdrew financial support as a consequence, which increases the likelihood of women being trapped in long-term abusive relationships.
All of this means that women’s employment, relative income or access to financial savings were not on their own protective against the occurrence of IPV. Schemes focused on improving the economic status of women may not mitigate the risk of IPV in some situations. This is especially true in those circumstances where male partners have attitudes that support traditional gender norms and hegemonic masculinities. Efforts to improve the economic security of women therefore need to be supported by strategies to address these harmful attitudes, and dismantle the systems that enable them, as well as additional protections for women to minimise risk of harm to recipients from the potential backlash from their partners.
Key finding 4: Economic insecurity co-occurred with other vulnerabilities reported by women which were associated with an increased likelihood of IPV
Although economic insecurity was independently associated with experiences of physical violence, sexual violence and emotionally abusive, harassing and controlling behaviours among respondents, economic insecurity often co-occurred with other factors that have been shown to increase risk of IPV within relationships (Antai et al., 2014; Foshee et al., 2005; Hatcher et al., 2019). This research highlighted the relationship between economic security and other risk factors for violence:
- Women who were economically insecure and were Aboriginal and Torres Strait Islander were more likely to experience physical violence, sexual violence and emotionally abusive, harassing and controlling behaviours than economically insecure non-Indigenous women.
- Women who were economically insecure and had a long-term restrictive health condition were more likely to experience physical violence, sexual violence and emotionally abusive, harassing and controlling behaviours than economically insecure women who did not have a health condition.
- Women who were economically insecure and had been pregnant in the last 12 months were more likely to experience physical violence and emotionally abusive, harassing and controlling behaviours than economically insecure women who had not been pregnant.
- Women who were economically insecure and lived with children were more likely to experience physical violence and sexual violence than economically insecure women who did not live with any children.
Though we did not explore these as interaction effects per se, the heightened risk of IPV when economic insecurity intersects with these other risk factors illustrates that the burden of economic insecurity on violence (and vice versa) is not shared equally by all women and their families. For example, research has shown that stress and conflict related to rearing of children can increase the risk of IPV, which may be exacerbated by co-occurring economic insecurity (Béland et al., 2020; Lucero et al., 2016). Further, alternative childcare arrangements may not be possible when families are financially stressed, meaning that children are likely to be cared for by their parents at home. This in turn limits opportunities for mothers to re-enter the workforce, and contributes to their financial dependence, which can also act as a barrier to escaping an abusive relationship (Anderson & Saunders, 2003).
Alternatively, it may be that economic insecurity and other risk factors for IPV overlap in some communities, possibly as a consequence of the same underlying causes. For example, over-policing of Indigenous communities, systemic racism and high levels of alcohol and drug use and early school drop-out may contribute to high levels of economic insecurity among Aboriginal and Torres Strait Islander women, as well as the occurrence of IPV (Boxall & Morgan, 2020; Nancarrow, 2019; Porter, 2016).
Understanding that the relationship between economic insecurity and IPV may be compounded by the presence of other co-occurring factors, and may be concentrated in particular communities, is crucial when developing and implementing strategies that are intended to improve women’s economic security. For example, financial supports need to be tailored to ensure they are accessible by women who have carer commitments and disabilities, and are delivered in partnership with Indigenous services and communities to ensure they are culturally appropriate.
Key finding 5: The relationship between economic status, stress and disparity and IPV varied according to the type of IPV and whether it was experienced as a chronic condition or an acute stressor
The relationship between economic status, stress and disparity and IPV varied according to the type of IPV, as shown in Table 9. This table summarises the economic factors that were both positively and negatively associated with experiences of IPV among women. It shows that, compared to physical violence and emotionally abusive, harassing and controlling behaviours, sexual violence was uniquely associated with relationships characterised by economic disparity and economic parity.
For example, sexual violence was the only type of IPV that was associated with different configurations of relative financial precarity within relationships. Respondents in a relationship where they or their partner were able to access $2,000 within a week if they needed to but the other person could not, and respondents in a relationship where both they and their partner could access the money, were both more likely than respondents who said that neither partner could access the money to have experienced sexual violence. In comparison, physical violence and non-physical abuse were only more likely when there was evidence of economic disparity – where only one person (in the case of physical violence, the respondent) could access $2,000 within a week. Similarly, sexual violence was also more likely when both partners were employed or where the respondent was employed but their partner was not, relative to when both partners were unemployed. This risk profile was also unique to sexual IPV.
Though we can’t be certain on the basis of this research, it’s possible that abusive partners use sexual violence in an attempt to establish control within relationships where they share equal levels of economic power with their partner, or have less economic power than their partner. This finding should be explored in more detail as part of future research.
The relationship between economic insecurity and IPV also varied according to whether it was experienced as a chronic or acute stressor (Lucero et al., 2016). This was particularly true for employment status. Women who said that both they and their partner were employed (at any point in the 12 months prior to the survey) were more likely than respondents who said neither partner had been employed to have experienced sexual and non-physical IPV in the 12 months prior to the survey. Sexual violence was more likely when the respondent was employed and their partner was not, while physical violence was less likely when only the partner was employed (relative also to both partners being unemployed). However, when the analysis shifted to first-time violence, we found that all forms of IPV were more common when at least one partner who had been working lost their job, took a pay cut or had a reduction in hours. There was also a relationship between job loss and lost work and escalating violence. Physical and non-physical violence was more likely when a respondent’s partner had been unemployed for the 12 months prior to the survey (but not the respondent). Read together, it suggests that it was this acute economic stress (especially if the one person lost their job and the other was not working) that increased the risk of IPV. In other words, being employed only emerged as a risk factor in the overall model because many of those respondents (and partners) who were employed at some point in the previous 12 months were the ones who lost their job or work. Certainly, this is consistent with prior research that has shown the importance of changes in employment status in increasing the likelihood of IPV (Fox et al., 2002; Roberts et al., 2011), and the conditional effect of employment on IPV (Macmillan & Gartner, 1999), and highlights the limitation of relying on static measures of a person’s economic situation, or information about only one person in the relationship.
Key finding 6: Consistent with other Australian and international research, there was clear evidence that the acute economic stressors associated with the COVID-19 pandemic were associated with both the onset and escalation of IPV
It is well established that the COVID-19 pandemic has had significant economic consequences for Australian families and has been a major contributing factor to the acute economic stress examined in this report. The public health measures introduced to contain the spread of COVID-19 led to significant job losses and an increase in financial stress during the first national lockdown (ABS, 2020b) and, while the situation has improved, these consequences have persisted throughout 2020 and into 2021 (ABS, 2021b). Notably, women – particularly younger women – have been more negatively impacted, given the concentration of job losses in industries with higher proportions of female employees and consequences of the pandemic for childcare responsibilities (Churchill, 2021).
This research adds to a growing number of Australian and international studies which have involved surveying the wider community to examine the impact of the pandemic and patterns of violence experienced by victims and survivors during periods of containment measures (Arenas-Arroyo et al., 2021; Béland et al., 2020; Boxall et al., 2020; Fereidooni et al., 2021; Hamadani et al., 2020; Jetelina et al., 2021; Perez-Vincent et al., 2020). A common theme within these studies is the strong link between pandemic-related stressors and an increased likelihood of experiencing violence, which could be attributable to economic consequences for women (Arenas-Arroyo et al., 2021) and their inability to meet financial obligations (Béland et al., 2020), and their partner’s unemployment (Fereidooni et al., 2021) or decrease in income due to COVID-19 (Perez-Vincent et al., 2020).
Our findings show that the acute economic stress of the pandemic on women and their partners – especially the loss of jobs and having to take a pay cut or reduce working hours – has been associated with an increased likelihood of first-time violence among respondents whose current or most recent partner (with whom they’d been in a relationship longer than 12 months) had not previously been violent, and an increase in the frequency or severity of violence among respondents in abusive relationships. The relationship between these acute stressors and recent changes in women’s experiences of violence provides the strongest evidence – though still based on cross-sectional data – of the relationship between women’s economic insecurity and experiences of IPV.
The pandemic continues to significantly impact many Australian states, with large-scale lockdowns easing at the time of writing this report. Consideration should be given to how to mitigate economic consequences when stay-at-home measures are in place, and in future stages of the Australian response to the pandemic, noting that the economic supports available now differ from those offered during the first 12 months of the pandemic. While there appears to be evidence of a short-term impact on IPV, it is also possible that violence in relationships will persist over time, especially for those women who experienced violence for the first time, while the long-term economic consequences of the pandemic are still unclear. Measures to prepare, monitor and respond to these economic consequences now and into the future are therefore critical to ensuring women’s safety in pandemic and post-pandemic Australia. There are also important lessons from the COVID-19 pandemic with respect to managing and responding to the economic impact of future natural disasters and the risk these pose in terms of IPV (Harville et al., 2011; Parkinson, 2019; Peterman, Potts, et al., 2020b; Thurston et al., 2021) – especially as it was the knowledge gleaned from previous disasters that was highlighted early in the pandemic when concerns about its impact on IPV were first being raised (Peterman, Potts, et al., 2020b).
Table 9: Overview of key findings, by IPV type
Economic security and IPV
| Physical violence | Sexual violence | Non-physical violence | ||||||
|---|---|---|---|---|---|---|---|---|
| Any | First-time | Escalation | Any | First-time | Any | First-time | Escalation | |
| Respondent is the main income earnera |  | | | |||||
| Respondent can access $2,000, partner cannotb |  | | | |||||
| Partner can access $2,000, respondent cannotb | | | | |||||
| Both can access $2,000b | | | | |||||
| Medium–high financial stress levelsc | | | | |||||
| Economic hardshipd | | | | |||||
| Respondent employed, partner unemployede | | | | |||||
| Partner employed, respondent unemployede |  | | | |||||
| Both respondent and partner employede | | | | |||||
Acute economic stressors during COVID-19 and IPV
| Physical violence | Sexual violence | Non-physical violence | ||||||
|---|---|---|---|---|---|---|---|---|
| Any | First-time | Escalation | Any | First-time | Any | First-time | Escalation | |
| Respondent lost job, took a pay cut or had reduction in hoursf | | | | | | |||
| Partner lost job, took a pay cut or had reduction in hoursf | | | | | | |||
| Respondent’s financial situation improvedg | |  | | | ||||
| Respondent’s financial status worsenedg | | | | | ||||
| Partner’s financial situation improvedh | | | | | | |||
| Partner’s financial status worsenedh | | | | | | |||
Notes:  = increased likelihood of IPV (or escalating IPV);
  = decreased likelihood of IPV (or increased likelihood of de-escalating violence; see notes);
  = no increase/decrease. Sample of prior victims of sexual violence who did not experience sexual violence in previous 12 months too small to fit a reliable model.
a vs. the respondent is not the main income earner or respondent and partner are equal earners.
b vs. both the respondent and her partner being unable to access $2,000 within a week.
c vs. the respondent experiencing low levels of financial stress.
d vs. the respondent not experiencing any form of economic hardship.
e vs. the respondent and her partner both being unemployed for the last 12 months.
f vs. employed and did not take a pay cut, reduce their hours or lose their job in last 12 months.
g vs. the respondent’s financial situation stayed the same.
h vs. the partner’s financial situation stayed the same.
i Increased likelihood of both escalating and de-escalating violence, relative to respondents who said their financial situation was unchanged.
Conclusion
Findings from this study, summarised in Table 8, contribute detailed evidence of the relationship between economic insecurity and IPV experienced by women living in Australia during the first 12 months of the COVID-19 pandemic. They address some of the key limitations of previous research that has explored the link between economic insecurity and IPV, including by measuring different types of IPV – physical violence, sexual violence and emotionally abusive, harassing and controlling behaviours – recruiting a large sample of women from the wider community, and measuring the relationship between acute economic stressors and IPV as well as more chronic forms of economic insecurity. This means that the findings are more generalisable to the broader Australian population than previous studies, at least to those individuals who are more likely to be members of online panels, while also allowing us to differentiate the effects of the COVID-19 pandemic from economic insecurity more broadly.
Nevertheless, this study is not without its own limitations. These include the use of a cross-sectional research design, which makes it difficult to establish with certainty whether economic insecurity is a cause, characteristic or consequence of IPV (Breiding et al., 2017). There are also limitations associated with using a blended probability and non-probability sampling design and online panel that may have produced a sample that was not representative of the most vulnerable sections of the community or was not able to include women who could not participate for safety reasons.
Even so, this research has important implications for responding to IPV, both in the context of the COVID-19 pandemic and more generally. The strong association between economic insecurity, especially economic hardship, and all forms of IPV highlights the importance of providing economic assistance and resources to victims and survivors – including measures such as stable housing, income support, debt forgiveness, microloans and access to affordable childcare – which can support women to leave abusive relationships and promote their economic independence from their partner. Though we have acknowledged the difficulty of establishing a causal relationship, the fact that financial stress was associated with first-time and not repeat violence, and that the loss of a job or work was associated with first-time and escalating violence, demonstrates the importance of efforts to try and mitigate the short- and longer term economic consequences of the pandemic for IPV. While this also highlights the need to be prepared for future periods of economic downturn, be they localised or more widespread, these economic stressors are certainly not confined to natural disasters, and consideration should be given to how the effects of these stressors can be addressed outside of pandemic conditions. At the same time, given this was a survey of women, the majority of whom had male partners, and economic disparity was also strongly associated with IPV, we cannot ignore the likely role of harmful gender norms and the need for strategies that promote the economic security of women to be supported by efforts to dismantle and address the systems and attitudes that support these norms. Finally, any measures to improve the economic security of women must recognise the intersection with other factors, meaning the burden of economic stress on IPV is not shared equally by all women or by all communities, and not all strategies will be universally effective.
Taken together, this research highlights the complexity associated with understanding the role of economic insecurity on IPV. Future research should avoid taking a narrow approach to researching the role of economic security, focusing solely on one or two measures of women’s economic status or stress. Relatedly, the findings from this study also demonstrate the importance of not limiting our analysis to the victim and survivor or perpetrator of IPV. Future studies attempting to understand the role of economic security in IPV need to consider the circumstances of both partners in the relationship and, specifically, the role of economic parity and disparity. This includes a need to better understand the role of gender norms regarding economic power and how they intersect with economic status, stress and precarity. Surveys of perpetrators of IPV, or of perpetrator–victim dyads, may provide greater insight into how the economic security of women’s partners, who are predominantly male, influences abusive behaviour. Finally, while this study has provided insights into the role of short-term stressors and changes in the patterns of IPV experienced by victims and survivors, longitudinal studies – ideally with a representative sample of the wider population – are clearly needed to disentangle the direction of the relationship between economic security and IPV and to better understand which factors are causes, and which are consequences, of IPV. This will further enhance our understanding of the best types and timing of economic supports for women to prevent IPV, how to support victims and survivors in abusive relationships, and how to support women post-separation from abusive partners.
References
Ahmadabadi, Z., Najman, J. M., Williams, G. M., & Clavarino, A. M. (2020). Income, gender, and forms of intimate partner violence. Journal of Interpersonal Violence, 35(23–24), 5500–5525. https://doi.org/10.1177/0886260517719541
Allison, P. D. (2000). Multiple imputation for missing data: A cautionary tale. Sociological Methods & Research, 28(3), 301–309. https://doi.org/10.1177/0049124100028003003
Anderson, D. K., & Saunders, D. G. (2003). Leaving an abusive partner: An empirical review of predictors, the process of leaving, and psychological well-being. Trauma, Violence, & Abuse, 4(2), 163–191. https://doi.org/10.1177/1524838002250769
Antai, D., Antai, J., & Anthony, D. S. (2014). The relationship between socio-economic inequalities, intimate partner violence and economic abuse: A national study of women in the Philippines. Global Public Health, 9(7), 808–826. https://doi.org/10.1080/17441692.2014.917195
Archer, K. J., & Lemeshow, S. (2006). Goodness-of-fit test for a logistic regression model fitted using survey sample data. Stata Journal, 6(1), 97–105. https://doi.org/10.1177/1536867X0600600106
Archuleta, K. L., Dale, A., & Spann, S. M. (2013). College students and financial distress: Exploring debt, financial satisfaction, and financial anxiety. Journal of Financial Counseling and Planning, 24(2), 50–62. https://eric.ed.gov/?id=EJ1043230
Arenas-Arroyo, E., Fernandez-Kranz, D., & Nollenberger, N. (2021). Intimate partner violence under forced cohabitation and economic stress: Evidence from the COVID-19 pandemic. Journal of Public Economics, 194, 104350. https://doi.org/10.1016/j.jpubeco.2020.104350
Australian Bureau of Statistics. (2017). Personal Safety, Australia, 2016. ABS. https://www.abs.gov.au/statistics/people/crime-and-justice/personal-safety-australia/latest-release
Australian Bureau of Statistics. (2020a). Education and Work, Australia, May 2020. ABS. https://www.abs.gov.au/statistics/people/education/education-and-work-australia/latest-release
Australian Bureau of Statistics. (2020b). Household Impacts of COVID-19 Survey, 14–17 Apr 2020 (Cat. no. 4940.0). ABS. https://www.abs.gov.au/ausstats/abs%40.nsf/mediareleasesbyCatalogue/DB259787916733E4CA25855B0003B21C?OpenDocument
Australian Bureau of Statistics. (2020c). General Social Survey: Summary results, Australia methodology. ABS. https://www.abs.gov.au/methodologies/general-social-survey-summary-results-australia-methodology/2019
Australian Bureau of Statistics. (2021a). National, state and territory population, September 2020. ABS. https://www.abs.gov.au/statistics/people/population/national-state-and-territory-population/dec-2020
Australian Bureau of Statistics. (2021b). Labour Force, Australia, September 2021. ABS. https://www.abs.gov.au/statistics/labour/employment-and-unemployment/labour-force-australia/latest-release
Australian Institute of Health and Welfare. (2019). Family, domestic and sexual violence in Australia: Continuing the national story 2019. AIHW. https://www.doi.org/10.25816/5ebcc837fa7ea
Barrett, B. J., & Pierre, M. St. (2011). Variations in women’s help seeking in response to intimate partner violence: Findings from a Canadian population-based study. Violence Against Women, 17(1), 47–70. https://doi.org/10.1177/1077801210394273
Béland, L.-P., Brodeur, A., Haddad, J., & Mikola, D. (2020). Covid-19, family stress and domestic violence: Remote work, isolation and bargaining power (SSRN Scholarly Paper ID 3627031). Social Science Research Network. https://papers.ssrn.com/abstract=3627031
Benson, M. L., Fox, G. L., DeMaris, A., & Wyk, J. V. (2003). Neighborhood disadvantage, individual economic distress and violence against women in intimate relationships. Journal of Quantitative Criminology, 19(3), 207–235. https://doi.org/10.1023/A:1024930208331
Bourgault, S., Peterman, A., & O’Donnell, M. (2021). Violence against women and children during Covid-19—One year on and 100 papers in: A fourth research round up. Center For Global Development. https://www.cgdev.org/publication/violence-against-women-and-children-during-covid-19-one-year-and-100-papers-fourth
Boxall, H., & Morgan, A. (2021). Who is most at risk of physical and sexual partner violence and coercive control during the COVID-19 pandemic? Trends & Issues in Crime and Criminal Justice, 618, 19. https://doi.org/10.52922/ti78047
Boxall, H., Morgan, A., & Brown, R. (2020). The prevalence of domestic violence among women during the COVID-19 pandemic (No. 28; Statistical Bulletin, p. 19). Australian Institute of Criminology. https://doi.org/10.52922/sb04718
Breiding, M. J., Basile, K. C., Klevens, J., & Smith, S. G. (2017). Economic insecurity and intimate partner and sexual violence victimization. American Journal of Preventive Medicine, 53(4), 457–464. https://doi.org/10.1016/j.amepre.2017.03.021
Bricknell, S., & Doherty, L. (2021). Homicide in Australia 2018-19 (No. 34; Statistical Report). Australian Institute of Criminology. https://www.aic.gov.au/publications/sr/sr34
Cascardi, M., & Vivian, D. (1995). Context for specific episodes of marital violence: Gender and severity of violence differences. Journal of Family Violence, 10(3), 265–293. https://doi.org/10.1007/BF02110993
Churchill, B. (2021). COVID-19 and the immediate impact on young people and employment in Australia: A gendered analysis. Gender, Work & Organization, 28(2), 783–794. https://doi.org/10.1111/gwao.12563
Collins, C., Landivar, L. C., Ruppanner, L., & Scarborough, W. J. (2021). COVID-19 and the gender gap in work hours. Gender, Work & Organization, 28, 101–112. https://doi.org/10.1111/gwao.12506
Copenhaver, M. M., Lash, S. J., & Eisler, R. M. (2000). Masculine gender-role stress, anger, and male intimate abusiveness: Implications for men’s relationships. Sex Roles, 42(5–6), 405–414. https://doi.org/10.1023/A:1007050305387
Copp, J. E., Giordano, P. C., Manning, W. D., & Longmore, M. A. (2016). Couple-level economic and career concerns and intimate partner violence in young adulthood. Journal of Marriage and Family, 78(3), 744–758. https://doi.org/10.1111/jomf.12282
Cortis, N., & Bullen, J. (2016). Domestic violence and women’s economic security: Building Australia’s capacity for prevention and redress: Final report (ANROWS Horizons, 05/2016). Australia’s National Research Organisation for Women’s Safety. https://www.anrows.org.au/publication/domestic-violence-and-womens-economic-security-building-australias-capacity-for-prevention-and-redress-key-findings-and-future-directions/
Deidda, M. (2015). Economic hardship, housing cost burden and tenure status: Evidence from EU-SILC. Journal of Family and Economic Issues, 36(4), 531–556. https://doi.org/10.1007/s10834-014-9431-2
Dragiewicz, M., Burgess, J., Matamoros-Fernández, A., Salter, M., Suzor, N. P., Woodlock, D., & Harris, B. (2018). Technology facilitated coercive control: Domestic violence and the competing roles of digital media platforms. Feminist Media Studies, 18(4), 609–625. https://doi.org/10.1080/14680777.2018.1447341
Eggers Del Campo, I., & Steinert, J. I. (2020). The effect of female economic empowerment interventions on the risk of intimate partner violence: A systematic review and meta-analysis. Trauma, Violence, & Abuse. https://doi.org/10.1177/1524838020976088
Fereidooni, R., Mootz, J., Sabaei, R., Khoshnood, K., Heydari, S. T., Moradian, M. J., Taherifard, E., Nasirian, M., & Molavi Vardanjani, H. (2021). The COVID-19 pandemic, socioeconomic effects, and intimate partner violence against women: A population-based cohort study in Iran (SSRN Scholarly Paper ID 3752688). Social Science Research Network. https://papers.ssrn.com/abstract=3752688
Foshee, V. A., Ennett, S. T., Bauman, K. E., Benefield, T., & Suchindran, C. (2005). The association between family violence and adolescent dating violence onset: Does it vary by race, socioeconomic status, and family structure? Journal of Early Adolescence, 25(3), 317–344. https://doi.org/10.1177/0272431605277307
Fox, G. L., Benson, M. L., DeMaris, A. A., & Van Wyk, J. (2002). Economic distress and intimate violence: Testing family stress and resources theories. Journal of Marriage and Family, 64(3), 793–807.
Golden, S. D., Perreira, K. M., & Durrance, C. P. (2013). Troubled times, troubled relationships: How economic resources, gender beliefs, and neighborhood disadvantage influence intimate partner violence. Journal of Interpersonal Violence, 28(10), 2134–2155. https://doi.org/10.1177/0886260512471083
Hacker, J. S. (2018). Economic security. In J. Stiglitz, J.-P. Fitoussi, & M. Durand (Eds.), For Good Measure: Advancing Research on Well-Being Metrics Beyond GDP (pp. 203–240). OECD. https://doi.org/10.1787/9789264307278-10-en
Hageman, S. A., & St. George, D. M. M. (2018). Social workers, intimate partner violence (IPV), and client financial concerns. Journal of Social Service Research, 44(3), 391–399. https://doi.org/10.1080/01488376.2018.1476288
Hamadani, J. D., Hasan, M. I., Baldi, A. J., Hossain, S. J., Shiraji, S., Bhuiyan, M. S. A., Mehrin, S. F., Fisher, J., Tofail, F., Tipu, S. M. M. U., Grantham-McGregor, S., Biggs, B.-A., Braat, S., & Pasricha, S.-R. (2020). Immediate impact of stay-at-home orders to control COVID-19 transmission on socioeconomic conditions, food insecurity, mental health, and intimate partner violence in Bangladeshi women and their families: An interrupted time series. Lancet Global Health, 8(11), e1380–e1389. https://doi.org/10.1016/S2214-109X(20)30366-1
Hand, K., Baxter, J., Carroll, M., & Budinski, M. (2020). Families in Australia Survey: Life during COVID-19 (p. 10). Australian Institute of Family Studies. https://aifs.gov.au/media-releases/new-report-reveals-how-aussie-families-are-adjusting-during-covid-19
Harville, E. W., Taylor, C. A., Tesfai, H., Xiong, X., & Buekens, P. (2011). Experience of Hurricane Katrina and reported intimate partner violence. Journal of Interpersonal Violence, 26(4), 833–845. https://doi.org/10.1177/0886260510365861
Hatcher, A. M., Stöckl, H., McBride, R.-S., Khumalo, M., & Christofides, N. (2019). Pathways from food insecurity to intimate partner violence perpetration among peri-urban men in South Africa. American Journal of Preventive Medicine, 56(5), 765–772. https://doi.org/10.1016/j.amepre.2018.12.013
Hilton, N. Z., Harris, G. T., & Rice, M. E. (1998). On the validity of self-reported rates of interpersonal violence. Journal of Interpersonal Violence, 13(1), 58–72. https://doi.org/10.1177/088626098013001004
Hosmer, D. W., & Lemeshow, S. (2000). Applied Logistic Regression (2nd ed.). John Wiley & Sons.
Hughes, C., Bolis, M., Fries, R., & Finigan, S. (2015). Women’s economic inequality and domestic violence: Exploring the links and empowering women. Gender & Development, 23(2), 279–297. https://doi.org/10.1080/13552074.2015.1053216
Hulme, S., Morgan, A., & Boxall, H. (2019). Domestic violence offenders, prior offending and reoffending in Australia. Trends & Issues in Crime and Criminal Justice, 580, 1–22. https://www.aic.gov.au/publications/tandi/tandi580
Jakupcak, M. (2003). Masculine gender role stress and men’s fear of emotions as predictors of self-reported aggression and violence. Violence and Victims, 18(5), 533–541. https://doi.org/10.1891/vivi.2003.18.5.533
Jakupcak, M., Lisak, D., & Roemer, L. (2002). The role of masculine ideology and masculine gender role stress in men’s perpetration of relationship violence. Psychology of Men & Masculinity, 3(2), 97. https://doi.org/10.1037/1524-9220.3.2.97
Jetelina, K. K., Knell, G., & Molsberry, R. J. (2021). Changes in intimate partner violence during the early stages of the COVID-19 pandemic in the USA. Injury Prevention, 27(1), 93–97. https://doi.org/10.1136/injuryprev-2020-043831
Johnston, R. M., Mohammed, A., & Van Der Linden, C. (2020). Evidence of exacerbated gender inequality in child care obligations in Canada and Australia during the COVID-19 pandemic. Politics & Gender, 16(4), 1131–1141. https://doi.org/10.1017/S1743923X20000574
Kahlmeter, A., Bäckman, O., & Brännström, L. (2018). Housing evictions and economic hardship: A prospective study. European Sociological Review, 34(1), 106–119. https://doi.org/10.1093/esr/jcx087
Kutin, J., Russell, R., & Reid, M. (2017). Economic abuse between intimate partners in Australia: Prevalence, health status, disability and financial stress. Australian and New Zealand Journal of Public Health, 41(3), 269–274. https://doi.org/10.1111/1753-6405.12651
Lindhorst, T., Oxford, M., & Gillmore, M. R. (2007). Longitudinal effects of domestic violence on employment and welfare outcomes. Journal of Interpersonal Violence, 22(7), 812–828. https://doi.org/10.1177/0886260507301477
Lloyd, S. (1997). The effects of domestic violence on women’s employment. Law & Policy, 19(2), 139–167. https://doi.org/10.1111/1467-9930.00025
Little, R. J. A. (1988). A test of missing completely at random for multivariate data with missing values. Journal of the American Statistical Association, 83(404), 1198–1202. https://doi.org/10.2307/2290157
Lucero, J. L., Lim, S., & Santiago, A. M. (2016). Changes in economic hardship and intimate partner violence: A family stress framework. Journal of Family and Economic Issues, 37(3), 395–406. https://doi.org/10.1007/s10834-016-9488-1 =
Macmillan, R., & Gartner, R. (1999). When she brings home the bacon: Labor-force participation and the risk of spousal violence against women. Journal of Marriage and Family, 61(4), 947–958. https://doi.org/10.2307/354015
Monckton Smith, J. (2020). Intimate partner femicide: Using Foucauldian analysis to track an eight stage progression to homicide. Violence against Women, 26(11), 1267–1285. https://doi.org/10.1177/1077801219863876
Morgan, A., & Boxall, H. (2020). Social isolation, time spent at home, financial stress and domestic violence during the COVID-19 pandemic. Trends & Issues in Crime and Criminal Justice, 18. https://doi.org/10.52922/ti04855
Mouzos, J., & Makkai, T. (2004). Women’s experiences of male violence: Findings from the Australian component of the International Violence Against Women Survey (IVAWS). Research and Public Policy report no. 56. Australian Institute of Criminology. https://www.aic.gov.au/media_library/publications/rpp/56/rpp056.pdf
Muller, C. J., & MacLehose, R. F. (2014). Estimating predicted probabilities from logistic regression: Different methods correspond to different target populations. International Journal of Epidemiology, 43(3), 962–970. https://doi.org/10.1093/ije/dyu029
Nancarrow, H. (2019). Unintended consequences of domestic violence law: Gendered aspirations and racialised realities. Springer Nature.
Nattino, G., Pennell, M. L., & Lemeshow, S. (2020). Assessing the goodness of fit of logistic regression models in large samples: A modification of the Hosmer-Lemeshow test. Biometrics, 76(2), 549–560. https://doi.org/10.1111/biom.13249
Newson, R. (2006). Confidence intervals for rank statistics: Somers’ D and extensions. Stata Journal, 6(3), 309–334. https://doi.org/10.1177/1536867X0600600302
Parkinson, D. (2019). Investigating the increase in domestic violence post disaster: An Australian case study. Journal of Interpersonal Violence, 34(11), 2333–2362. https://doi.org/10.1177/0886260517696876
Perez-Vincent, S. M., Carreras, E., Gibbons, M. A., Murphy, T. E., & Rossi, M. (2020). COVID-19 lockdowns and domestic violence: Evidence from two studies in Argentina. Inter-American Development Bank. https://doi.org/10.18235/0002490
Peterman, A., & O’Donnell, M. (2020a). COVID-19 and violence against women and children: A second research round up. Centre for Global Development. https://www.cgdev.org/publication/covid-19-and-violence-against-women-and-children-second-research-round
Peterman, A., & O’Donnell, M. (2020b). COVID-19 and violence against women and children: A third research round up for the 16 Days of Activism (p. 12). Center for Global Development. https://www.cgdev.org/publication/covid-19-and-violence-against-women-and-children-third-research-round-16-days-activism
Peterman, A., O’Donnell, M., & Palermo, T. (2020). COVID-19 and violence against women and children: What have we learned so far? (p. 8). Center for Global Development. https://www.cgdev.org/publication/covid-19-violence-against-women-and-children-what-have-we-learned-so-far
Peterman, A., Potts, A., O’Donnell, M., Thompson, K., Shah, N., Oertelt-Prigione, S., & Van Gelder, N. (2020a). Pandemics and violence against women and children (CGD Working Paper No. 528). Center for Global Development. https://www.cgdev.org/publication/pandemics-and-violence-against-women-and-children
Peterman, A., Potts, A., O’Donnell, M., Thompson, K., Shah, N., Oertelt-Prigione, S., & Van Gelder, N. (2020b). Pandemics and violence against women and children (CGD Working Paper No. 528). Center for Global Development. https://www.cgdev.org/publication/pandemics-and-violence-against-women-and-children
Piquero, A. R., Jennings, W. G., Jemison, E., Kaukinen, C., & Knaul, F. M. (2021). Domestic violence during the COVID-19 pandemic—Evidence from a systematic review and meta-analysis. Journal of Criminal Justice, 74, 101806. https://doi.org/10.1016/j.jcrimjus.2021.101806
Porter, A. (2016). Decolonizing policing: Indigenous patrols, counter-policing and safety. Theoretical Criminology, 20(4), 548–565. https://doi.org/10.1177/1362480615625763
Power, K. (2020). The COVID-19 pandemic has increased the care burden of women and families. Sustainability: Science, Practice and Policy, 16(1), 67–73. https://doi.org/10.1080/15487733.2020.1776561
Pregibon, D. (1979). Data analytic methods for generalized linear models. University of Toronto.
Reichelt, M., Makovi, K., & Sargsyan, A. (2021). The impact of COVID-19 on gender inequality in the labor market and gender-role attitudes. European Societies, 23(sup1), S228–S245. https://doi.org/10.1080/14616696.2020.1823010
Ricks, J. L., Cochran, S. D., Arah, O. A., Williams, J. K., & Seeman, T. E. (2016). Food insecurity and intimate partner violence against women: Results from the California Women’s Health Survey. Public Health Nutrition, 19(5), 914–923. https://doi.org/10.1017/S1368980015001986
Roberts, A. L., McLaughlin, K. A., Conron, K. J., & Koenen, K. C. (2011). Adulthood stressors, history of childhood adversity, and risk of perpetration of intimate partner violence. American Journal of Preventive Medicine, 40(2), 128–138. https://doi.org/10.1016/j.amepre.2010.10.016
Schwab-Reese, L. M., Peek-Asa, C., & Parker, E. (2016). Associations of financial stressors and physical intimate partner violence perpetration. Injury Epidemiology, 3(1), 1–10. https://doi.org/10.1186/s40621-016-0069-4
Smith, N., & Weatherburn, D. (2013). Personal stress, financial stress, social support and women’s experiences of physical violence: A longitudinal analysis. Crime and Justice Bulletin, 168, 1–20. https://www.bocsar.nsw.gov.au/Pages/bocsar_publication/Pub_Summary/CJB/cjb168-Personal-stress-financial-stress-social-support-and-women’s-experiences-of-physical-violence-A-longitudinal-analysis.aspx
Stark, E. (2012). Looking beyond domestic violence: Policing coercive control. Journal of Police Crisis Negotiations, 12(2), 199–217. https://doi.org/10.1080/15332586.2012.725016
Stark, E., & Hester, M. (2019). Coercive control: Update and review. Violence against Women, 25(1), 81–104.
Sterne, J. A., White, I. R., Carlin, J. B., Spratt, M., Royston, P., Kenward, M. G., Wood, A. M., & Carpenter, J. R. (2009). Multiple imputation for missing data in epidemiological and clinical research: Potential and pitfalls. BMJ (Clinical Research Ed.), 338, b2393. https://doi.org/10.1136/bmj.b2393
Thurston, A. M., Stöckl, H., & Ranganathan, M. (2021). Natural hazards, disasters and violence against women and girls: A global mixed-methods systematic review. BMJ Global Health, 6(4), e004377. https://doi.org/10.1136/bmjgh-2020-004377
Tolman, R. M. (1999). The validation of the Psychological Maltreatment of Women Inventory. Violence and Victims, 14(1), 25–37. https://pubmed.ncbi.nlm.nih.gov/10397624/
Weatherburn, D. (2011). Personal stress, financial stress and violence against women. Contemporary Issues in Crime and Justice, 151, 12. https://www.bocsar.nsw.gov.au/Pages/bocsar_publication/Pub_Summary/CJB/cjb151-Personal-stress-financial-stress-and-violence-against-women.aspx
Wood, D., Griffiths, K., & Crowley, T. (2021). Women’s work: The impact of the COVID crisis on Australian women. Grattan Institute. https://grattan.edu.au/report/womens-work/
Woodlock, D., McKenzie, M., Western, D., & Harris, B. (2020). Technology as a weapon in domestic violence: Responding to digital coercive control. Australian Social Work, 73(3), 368–380.
Wu, Q., & Xu, Y. (2020). Parenting stress and risk of child maltreatment during the COVID-19 pandemic: A family stress theory-informed perspective. Developmental Child Welfare, 2(3), 180–196. https://doi.org/10.1177/2516103220967937
Yoshihama, M., Clum, K., Crampton, A., & Gillespie, B. (2002). Measuring the lifetime experience of domestic violence: Application of the life history calendar method. Violence and Victims, 17(3), 297–317. https://doi.org/10.1891/vivi.17.3.297.33663
Zhang, H., & Breunig, R. (2021). Gender norms and domestic abuse: Evidence from Australia (No. 14225; Discussion Paper Series). IZA Institute of Labor Economics. https://taxpolicy.crawford.anu.edu.au/sites/default/files/publication/taxstudies_crawford_anu_edu_au/2021-04/complete_breunig_zhang_wp_mar_2021.pdf
Appendix A
Table A1: Sociodemographic characteristics of respondents (weighted data; n=10,189)
Age
| n | % | |
|---|---|---|
| 18–24 | 1,077 | 10.6 |
| 25–34 | 2,198 | 21.6 |
| 35–44 | 2,005 | 19.7 |
| 45–54 | 1,723 | 16.9 |
| 55–64 | 1,469 | 14.4 |
| 65+ | 1,717 | 16.9 |
| Aboriginal and/or Torres Strait Islandera | 351 | 3.4 |
| Non-English-speaking background | 617 | 6.1 |
| Current long-term health condition restricting everyday activitiesb | 1,220 | 12.0 |
Sexualityc
| n | % | |
|---|---|---|
| Heterosexual | 9,269 | 91.0 |
| Gay/lesbian | 180 | 1.8 |
| Bisexual | 552 | 5.4 |
| Other | 67 | <1 |
| Not sure | 55 | <1 |
Citizenship statusd
| n | % | |
|---|---|---|
| Australian citizen or permanent resident | 9,938 | 97.5 |
| Temporary visa | 227 | 2.2 |
| Unsure of citizenship status | 14 | <1 |
Highest level of education completed
| n | % | |
|---|---|---|
| Year 9 or below | 413 | 4.1 |
| Year 10/11 or equivalent | 1,951 | 19.1 |
| Year 12 or equivalent | 2,622 | 25.7 |
| Vocational certificate | 1,175 | 11.5 |
| University | 4,028 | 39.5 |
Usual place of residencee
| n | % | |
|---|---|---|
| Major cities | 7,610 | 75.0 |
| Regional | 2,256 | 22.2 |
| Remote | 276 | 2.7 |
Note: Percentage totals may not equal 100 due to rounding, and respondents choosing not to disclose specific information.
a Denominator includes 57 respondents who did not want to disclose this information.
b Defined as someone who said they had a health condition that had lasted or was expected to last six months or longer and, because of this condition, they were restricted in or needed help or supervision with day-to-day activities.
c Denominator includes 66 respondents who did not want to disclose this information.
d Denominator includes 11 respondents who did not want to disclose this information.
e Regional classification calculated using the respondent’s postcode and concordance with the Australian Statistical Geography Standard (2018). Excludes 45 respondents who did not provide their postcode.
Source: Impact of COVID-19 and financial stress on intimate partner violence survey, AIC [Computer file]
Table A2: Relationship characteristics of respondents, by relationship status (weighted data)
| Ongoing relationship (n=9,343) | Former relationship (n=846) | Overall (n=10,189) | ||||
|---|---|---|---|---|---|---|
| n | % | n | % | n | % | |
| Cohabitated with partner in past 12 months | 8,422 | 90.1 | 273 | 32.2 | 8,694 | 85.3 |
Relationship typea
| Ongoing relationship (n=9,343) | Former relationship (n=846) | Overall (n=10,189) | ||||||
|---|---|---|---|---|---|---|---|---|
| n | % | n | % | n | % | |||
| Married | 5,654 | 62.0 | – | – | – | – | ||
| Defacto/committed | 3,047 | 33.4 | – | – | – | – | ||
| Dating | 236 | 2.6 | – | – | – | – | ||
| Other | 181 | 2.0 | – | – | – | – | ||
Sex of partnerb
| Ongoing relationship (n=9,343) | Former relationship (n=846) | Overall (n=10,189) | ||||
|---|---|---|---|---|---|---|
| n | % | n | % | n | % | |
| Male | 8,871 | 95.0 | 791 | 93.5 | 9,662 | 94.8 |
| Female | 436 | 4.7 | 46 | 5.4 | 482 | 4.7 |
| Non-binary sex | 11 | <1 | 0 | 0 | 11 | <1 |
Length of relationshipc
| Ongoing relationship (n=9,343) | Former relationship (n=846) | Overall (n=10,189) | ||||
|---|---|---|---|---|---|---|
| n | % | n | % | n | % | |
| <1 year | 384 | 4.1 | 279 | 32.9 | 663 | 6.5 |
| 1–3 years | 1,201 | 12.9 | 240 | 28.4 | 1,442 | 14.2 |
| 4–6 years | 918 | 9.8 | 91 | 10.8 | 1,009 | 10.0 |
| 7–10 years | 692 | 7.4 | 39 | 4.6 | 731 | 7.2 |
| 11–15 years | 1,401 | 15.0 | 52 | 6.1 | 1,453 | 14.3 |
| 15+ years | 4,328 | 46.3 | 49 | 5.8 | 4,377 | 43.0 |
Length of separationd
| Ongoing relationship (n=9,343) | Former relationship (n=846) | Overall (n=10,189) | ||||
|---|---|---|---|---|---|---|
| n | % | n | % | n | % | |
| Less than three months ago | – | – | 191 | 22.6 | – | – |
| 4–6 months ago | – | – | 190 | 22.4 | – | – |
| 7–12 months ago | – | – | 346 | 40.8 | – | – |
| At least one child with partner | 5,310 | 56.8 | 129 | 15.2 | 5,439 | 53.4 |
| Average number of children with partnere | 2.1 | 1.9 | 2.1 | |||
Custodial arrangements for shared childrenf
| Ongoing relationship (n=9,343) | Former relationship (n=846) | Overall (n=10,189) | ||||
|---|---|---|---|---|---|---|
| n | % | n | % | n | % | |
| Sole or majority custody (respondent) | – | – | 76 | 77.8 | – | – |
| Shared custody (respondent and their partner) | – | – | 16 | 11.7 | – | – |
| Sole or majority custody (partner) | – | – | 2 | 1.5 | – | – |
| Pregnant in the last 12 monthsg | 818 | 8.8 | 28 | 3.3 | 845 | 8.3 |
| Any children living in household | 3,538 | 37.9 | 237 | 28.0 | 3,775 | 37.1 |
| Average number of children living in householdh | 1.8 | 1.8 | 1.8 | |||
Note: Percentage totals may not equal 100 due to rounding, and respondents choosing not to disclose specific information.
a This question was only asked of respondents who were in a current relationship at time of completing the survey.
b Denominator includes 28 respondents in a current relationship, and nine respondents in a former relationship, who did not want to disclose this information.
c Denominator includes 419 respondents in a current relationship, and 96 respondents in a former relationship, who did not want to disclose this information.
d This question was only asked of respondents who had separated from their partner in the 12 months before the survey. Denominator includes 120 respondents in a former relationship who did not want to disclose this information.
e Limited to respondents who said they had at least one child with their current or former partner.
f Limited to respondents who said they had at least one child with their partner and were no longer in a relationship with them. Denominator includes 10 respondents who did not want to disclose this information, and four respondents who were not sure of the custody arrangements in place for shared children.
g Includes current and former pregnancy. Denominator includes five respondents in a current relationship who were not sure if they had been pregnant in the past 12 months.
h Limited to respondents who said they had at least one child living with them, either full-time or part-time.
Source: Impact of COVID-19 on intimate partner violence survey, AIC [Computer file]
Table A3: Logistic regression model predicting women’s experience of physical violence perpetrated by their current or most recent intimate partner in the 12 months prior to the survey, by prior violence (ORs, 95% CIs)
Age (vs. 25–34 years)c
| Prior violencea | No prior violenceb | |
|---|---|---|
| 18–24 | – | 1.43 (0.84–2.43) |
| 35–44 | 0.85 (0.40–1.81) | 0.66 (0.45–0.97)* |
| 45–54 | 0.42 (0.18–0.97)* | 0.66 (0.42–1.03) |
| 55–64 | 0.36 (0.14–0.90)* | 0.41 (0.23–0.73)** |
| 65+ | 0.18 (0.06–0.54)** | 0.28 (0.12–0.69)** |
| Aboriginal and Torres Strait Islander (vs. non-Indigenous) | 9.05 (2.38–34.40)** | 1.63 (0.97–2.72) |
| Non-English-speaking backgrounds (vs. English speaking) | 1.37 (0.46–4.10) | 1.02 (0.55–1.90) |
| Restrictive long-term health condition (vs. no health condition) | 1.49 (0.78–2.85) | 2.16 (1.45–3.25)*** |
| Partner is male (vs. partner is female) | 0.57 (0.10–3.18) | 0.70 (0.40–1.24) |
Place of usual residence (vs. metropolitan)
| Prior violencea | No prior violenceb | |
|---|---|---|
| Regional | 1.05 (0.60–1.84) | 0.74 (0.51–1.07) |
| Remote | 1.14 (0.29–4.53) | 1.41 (0.63–3.14) |
| At least one child living at home (vs. no children living at home) | 0.95 (0.53–1.70) | 1.19 (0.85–1.65) |
| Pregnant in the last 12 months (vs. not pregnant) | 0.41 (0.17–1.00)* | 1.47 (0.94–2.30) |
| Former partner (vs. current partner) | 2.80 (1.05–7.44)* | 3.07 (1.89–5.00)*** |
| Cohabiting (vs. not cohabiting) | 0.53 (0.19–1.47) | 1.52 (0.89–2.58) |
| Respondent is the breadwinner (vs. respondent is not the breadwinner) | 1.08 (0.61–1.91) | 1.90 (1.40–2.59)*** |
Employment status of partner and respondent (vs. both partner and respondent unemployed)
| Prior violencea | No prior violenceb | |
|---|---|---|
| Respondent employed, partner unemployed | 0.53 (0.23–1.22) | 0.77 (0.42–1.44) |
| Partner employed, respondent unemployed | 0.48 (0.22–1.08) | 0.63 (0.35–1.14) |
| Both respondent and partner employed | 0.98 (0.45–2.16) | 0.77 (0.49–1.22) |
Ability to access $2,000 in a week (vs. both partner and respondent unable to access $2,000)
| Prior violencea | No prior violenceb | |
|---|---|---|
| Respondent can access $2,000, partner cannot | 0.89 (0.36–2.19) | 1.20 (0.72–1.99) |
| Partner can access $2,000, respondent cannot | 0.55 (0.23–1.32) | 1.44 (0.89–2.33) |
| Both respondent and partner can access $2,000 | 1.63 (0.83–3.21) | 0.63 (0.43–0.92)* |
Financial stress level (vs. low or none)
| Prior violencea | No prior violenceb | |
|---|---|---|
| Medium levels of financial stress | 1.30 (0.68–2.48) | 1.64 (1.11–2.40)* |
| High levels of financial stress | 1.74 (0.80–3.76) | 2.03 (1.30–3.17)** |
| At least one economic hardship (vs. no economic hardship) | 2.51 (1.30–4.83)** | 2.43 (1. 68–3.51)*** |
Level of social support (vs. low or no social support)
| Prior violencea | No prior violenceb | |
|---|---|---|
| Medium levels of social support | 0.79 (0.44–1.43) | 0.79 (0.54–1.15) |
| High levels of social support | 0.81 (0.36–1.78) | 0.81 (0.54–1.21) |
| Constant | 6.02 (0.49–72.49) | 0.03 (0.01–0.06)*** |
***p<0.001 **p<0.01 *p<0.05
ORs=odds ratios, 95% CIs=95% confidence intervals
a Sub-population n=573 (weighted), F=3.40, AUC=0.815, p<0.001. Eligible cases with missing data n=39 (6.4%).
b Sub-population n=7,903 (weighted), F=11.23, AUC=0.822, p<0.001. Eligible cases with missing data n=301 (3.7%).
c Due to small numbers, 18–24 year olds were included in the reference category (25–34 years).
Source: Impact of COVID-19 on intimate partner violence survey, AIC [Computer file]
Table A4: Logistic regression model predicting women’s experience of first-time sexual violence perpetrated by their current or most recent intimate partner in the 12 months prior to the survey
Age (vs. 25–34 years)
| ORs (95% CIs)a | |
|---|---|
| 18–24 | 1.29 (0.72–2.32) |
| 35–44 | 0.86 (0.59–1.25) |
| 45–54 | 1.01 (0.65–1.59) |
| 55–64 | 0.39 (0.20–0.76)** |
| 65+ | 0.55 (0.25–1.24) |
| Aboriginal and Torres Strait Islander (vs. non-Indigenous) | 2.07 (1. 25–3.42)** |
| Non-English-speaking backgrounds (vs. English speaking) | 1.17 (0.72–1.89) |
| Restrictive long-term health condition (vs. no health condition) | 1.99 (1.36–2.92)*** |
| Partner is male (vs. partner is female) | 1.00 (0.57–1.80) |
Place of usual residence (vs. metropolitan)
| ORs (95% CIs)a | |
|---|---|
| Regional | 1.12 (0.76–1.65) |
| Remote | 0.93 (0.32–2.73) |
| At least one child living at home (vs. no children living at home) | 0.96 (0.69–1.34) |
| Pregnant in the last 12 months (vs. not pregnant) | 2.04 (1.26–3.30)** |
| Former partner (vs. current partner) | 1.88 (1.13–3.13)* |
| Cohabiting (vs. not cohabiting) | 0. 74 (0.48–1.15) |
| Respondent is the breadwinner (vs. respondent is not the breadwinner) | 1.51 (1.10–2.06)* |
Employment status of partner and respondent (vs. both partner and respondent unemployed)
| ORs (95% CIs)a | |
|---|---|
| Respondent employed, partner unemployed | 1.70 (0.87–3.30) |
| Partner employed, respondent unemployed | 1.04 (0.56–1.93) |
| Both respondent and partner employed | 1.54 (0.95–2.50) |
Ability to access $2,000 in a week (vs. both partner and respondent unable to access $2,000)
| ORs (95% CIs)a | |
|---|---|
| Respondent can access $2,000, partner cannot | 1.88 (1.02–3.47)* |
| Partner can access $2,000, respondent cannot | 2.03 (1.24–3.34)** |
| Both respondent and partner can access $2,000 | 1.02 (0.69–1.52) |
Financial stress level (vs. low or none)
| ORs (95% CIs)a | |
|---|---|
| Medium levels of financial stress | 2.05 (1.41–2.98)*** |
| High levels of financial stress | 2.41 (1.59–3.64)*** |
| At least one economic hardship (vs. no economic hardship) | 1.95 (1.41–2.71)*** |
Level of social support (vs. low or no social support)
| ORs (95% CIs)a | |
|---|---|
| Medium levels of social support | 0.65 (0.44–0.96)** |
| High levels of social support | 0.67 (0.44–1.03) |
| Constant | 0.02 (0.01–0.04)*** |
***p<0.001 **p<0.01 *p<0.05
ORs=odds ratios, 95% CIs=95% confidence intervals
a Sub-population n=8,214 (weighted), F=11.71, AUC=0.799, p<0.001. Eligible cases with missing data n=309 (3.6%).
Source: Impact of COVID-19 on intimate partner violence survey, AIC [Computer file]
Table A5: Logistic regression model predicting women’s experience of emotionally abusive, harassing or controlling behaviours perpetrated by their current or most recent intimate partner in the 12 months prior to the survey, by prior violence (ORs, 95% CIs)
Age (vs. 25–34 years)
| Prior violencea | No prior violenceb | |
|---|---|---|
| 18–24 | 1.00 (0.27–3.64) | 1.19 (0.86–1.66) |
| 35–44 | 2.24 (0.85–5.93) | 0.96 (0.79–1.19) |
| 45–54 | 1.64 (0.55–4.83) | 0.82 (0.65–1.04) |
| 55–64 | 2.02 (0.56–7.30) | 0.62 (0.47–0.83)** |
| 65+ | 3.08 (0.68–13.98) | 0.61 (0.43–0.87)** |
| Aboriginal and Torres Strait Islander (vs. non-Indigenous) | 1.37 (0.35–5.32) | 2.11 (1.38–3.21)** |
| Non-English-speaking backgrounds (vs. English speaking) | 1.63 (0.33–8.02) | 1.45 (1.12–1.89)** |
| Restrictive long-term health condition (vs. no health condition) | 2.28 (0.56–9.37) | 1.26 (0.98–1.61) |
| Partner is male (vs. partner is female) | 3.80 (1.33–10.86)* | 0.90 (0.65–1.24) |
Place of usual residence (vs. metropolitan)
| Prior violencea | No prior violenceb | |
|---|---|---|
| Regional | 0.65 (0.32–1.33) | 1.04 (0.86–1.26) |
| Remote | 1.76 (0.34–9.15) | 0.82 (0.51–1.32) |
| At least one child living at home (vs. no children living at home) | 1.63 (0.80–3.33) | 1.25 (1.04–1.50)* |
| Pregnant in the last 12 months (vs. not pregnant) | 0.51 (0.16–1.58) | 0.99 (0.77–1.28) |
| Former partner (vs. current partner) | 7.22 (1.81–28.80)** | 2.49 (1.69–3.67)*** |
| Cohabiting (vs. not cohabiting) | 5.61 (2.18–14.40)*** | 1.07 (0.80–1.43) |
| Respondent is the breadwinner (vs. respondent is not the breadwinner) | 1.45 (0.66–3.16) | 1.46 (1.23–1.73)*** |
Employment status of partner and respondent (vs. both partner and respondent unemployed)
| Prior violencea | No prior violenceb | |
|---|---|---|
| Respondent employed, partner unemployed | 1.02 (0.26–3.99) | 0.95 (0.65–1.39) |
| Partner employed, respondent unemployed | 1.17 (0.33–4.14) | 0.83 (0.62–1.11) |
| Both respondent and partner employed | 1.52 (0.53–4.26) | 1.18 (0.93–1.50) |
Ability to access $2,000 in a week (vs. both partner and respondent unable to access $2,000)
| Prior violencea | No prior violenceb | |
|---|---|---|
| Respondent can access $2,000, partner cannot | 1.83 (0.54–6.19) | 2.21 (1.56–3.12)*** |
| Partner can access $2,000, respondent cannot | 3.28 (0.63–17.02) | 1.44 (1.04–1.99)* |
| Both respondent and partner can access $2,000 | 1.72 (0.72–4.11) | 0.97 (0.79–1.20) |
| Financial stress level (vs. low or none) | ||
| Medium levels of financial stress | 2.83 (1.32–6.07)** | 1.77 (1.47–2.14)*** |
| High levels of financial stress | 2.87 (0.91–9.06) | 2.01 (1. 55–2.62)*** |
| At least one economic hardship (vs. no economic hardship) | 2.51 (1.24–5.06)* | 2.02 (1.71–2.39)*** |
Level of social support (vs. low or no social support)
| Prior violencea | No prior violenceb | |
|---|---|---|
| Medium levels of social support | 0.81 (0.33–1.98) | 0.69 (0.56–0.85)*** |
| High levels of social support | 0.51 (0.24–1.10) | 0.64 (0.51–0.8 0)*** |
| Constant | 0.11 (0.02–0.72)* | 0.16 (0.10–0.28)*** |
***p<0.001 **p<0.01 *p<0.05
ORs=odds ratios, 95% CIs=95% confidence intervals
a Sub-population n=1,127 (weighted), F=3.63, AUC=0.793, p<0.001. Eligible cases with missing data n=46 (3.9%).
b Sub-population n=7,237 (weighted), F=18.05, AUC=0.731, p<0.001. Eligible cases with missing data n=284 (3.8%).
Source: Impact of COVID-19 on intimate partner violence survey, AIC [Computer file]


